Best Places for New Canadians 2017
The top 100 spots for newcomers to the country
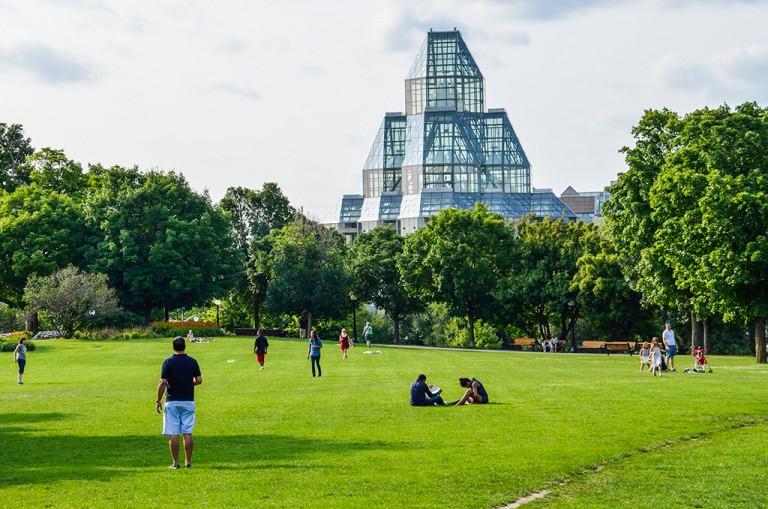
Ottawa, Canada – July 24, 2014: People in Majors Hill Park by National Gallery museum (ablokhin/iStock)
Share
[widgets_on_pages id=”2017 – BPTL – NAV”]
Danee Georgiou and Joakim Keussen have lived all over the world. Their list of cities resembles something you might see on the back of a concert t-shirt: San Fransisco, Berlin, Melbourne. And like a rock band on the final leg of a tour, they were exhausted.
Two years ago the young couple was living in Berlin. “There was always something going on,” says Georgiou, 33, of her time in the German capital. “I constantly had a fear of missing out on things.” It sounds like a nice pitch for the city, but there were drawbacks too, adds Keussen, 25. “We both didn’t feel like we could raise a family in Berlin,” explains Georgiou.
They already contemplating making another move when Keussen got a recruiting call from Shopify to move to Ottawa to work as a senior designer. They were skeptical at first. Canada was never on their radar and neither of them had ties to the country. Keussen would visit twice before jumping at the opportunity. They expect to never look back.
Photo gallery: Top 10 Best Places for New Canadians »
Anyone looking to move to Canada would likely start with the cities they’ve heard of like Toronto and Vancouver or maybe Montreal. There are many other places with a lot to offer anyone searching for a new place to call home. Some might be surprised to see Ottawa at the top of this list—but you shouldn’t be.
Ottawa has a strong and diverse economy, fronted by government and well-paid high-tech jobs, which are a particular draw. It’s true the city isn’t quite as cosmopolitan as say Toronto or Vancouver, but it’s still a welcome blend of cultures and nationalities. One in five people in the city speaks a language other than French or English.
And for a big city, it’s also pretty friendly. The community index value for the city, a measure of how engaged residents are in the city, also compares favourably to other large cities.
The city has a way of cultivating this sense of community says Ottawa Mayor Jim Watson. In 1970 it welcomed 4,000 Vietnamese Boat people and helped them settle in the area. Now those some of those same immigrants in the city are holding fundraisers to help Syrian refugees start a new life in Canada. “A lot of people felt we couldn’t do it,” says Waston. “What warmed my heart, was attending a fund raising with the Vietnamese community.”
Interactive tool: Find your best place to live »
“Canada is tricky to explain, but it quickly felt like home,” says Georgiou, who also works at Shopify as a recruiter. They love how the way they interact with the city as it changes with the seasons. Georgiou who was born and raised in Australia is particularly appreciative of the hot summers. Integrating into the city has been a breeze. Shopify not only helps with the transition, like a lot of tech companies in the area they actively push employees to live outside of work.
While Ottawa doesn’t quiet offer the level of grandeur that you’d find in some of the other places they lived, there are still more than enough food events and craft brewers and outdoor activities to enjoy.
In the coming weeks Gerogiou and Keussen plan to apply for permanent residency and keep the door open for eventual citizenship. For now they have no plans to leave. “I think we’d call Ottawa home,” says Keussen.
[widgets_on_pages id=”2017 – BPTL – SUBNAV”]
Best Places to Raise For New Canadians – by region
Atlantic Canada:
Fredericton, N.B. (No. 70)
Quebec:
Brossard, Que. (No. 4)
Ontario:
Ottawa (No. 1)
Prairies:
Regina, Sask. (No. 3)
Alberta:
Lethbridge, Alta. (No. 22)
British Columbia & the Territories:
Delta, B.C. (No. 10)
The Top 100
| Rank | Name | Province | City Size | Population | Population Change (2012 to 2017) | Estimated Unemployment Rate | Regional Unemployment rate | Median Household Income | Average Household Discretionary Income | Average Household Net Worth | Avg. Value Of Primary Real Estate | Avg. Rent | Vacancy % | Home to income ratio | Travel To Work By Public Transit | % of pop. Who say English/French is not their first language |
|---|---|---|---|---|---|---|---|---|---|---|---|---|---|---|---|---|
| 1 | Ottawa CV | Ont. | L | 974,701 | 5.5% | 5.0% | 6.5% | $91,122 | $57,260 | $631,905 | $481,223 | $1,204 | 3.0% | 4.2 | 13.8% | 21.0% |
| 2 | Waterloo CY | Ont. | M | 109,532 | 5.4% | 5.4% | 5.6% | $90,726 | $54,852 | $710,206 | $467,659 | $1,098 | 1.4% | 4.3 | 4.1% | 25.1% |
| 3 | Regina | Sask. | M | 226,682 | 10.9% | 5.7% | 4.5% | $83,178 | $56,360 | $428,940 | $378,617 | $1,109 | 5.5% | 3.7 | 3.5% | 13.6% |
| 4 | Brossard V | Que. | S | 87,842 | 7.4% | 7.0% | 6.2% | $73,711 | $48,765 | $552,418 | $395,627 | $793 | 4.2% | 4.1 | 16.3% | 36.7% |
| 5 | Brandon | Man. | S | 50,634 | 6.2% | 7.7% | 6.1% | $71,811 | $46,400 | $322,026 | $285,708 | $844 | 3.3% | 3.3 | 2.5% | 19.6% |
| 6 | Guelph | Ont. | M | 134,832 | 6.0% | 5.6% | 5.6% | $83,447 | $47,113 | $516,064 | $490,591 | $1,079 | 1.0% | 5.2 | 5.2% | 18.2% |
| 7 | Thunder Bay | Ont. | M | 111,415 | 0.1% | 5.5% | 5.6% | $70,929 | $46,375 | $349,161 | $269,059 | $940 | 5.0% | 3.2 | 2.4% | 11.1% |
| 8 | Oakville T | Ont. | M | 211,025 | 10.0% | 5.8% | 6.8% | $111,468 | $72,845 | $1,303,745 | $879,261 | $1,423 | 1.1% | 5.8 | 8.0% | 29.3% |
| 9 | London | Ont. | M | 399,125 | 4.7% | 6.9% | 5.6% | $68,459 | $44,509 | $428,006 | $326,499 | $1,002 | 2.1% | 3.8 | 4.9% | 19.3% |
| 10 | Delta DM | B.C. | M | 108,943 | 5.6% | 6.0% | 6.1% | $97,174 | $58,892 | $955,028 | $820,429 | $1,113 | - | 7.3 | 5.9% | 27.7% |
| 11 | Blainville V | Que. | S | 58,099 | 6.4% | 4.2% | 5.8% | $93,677 | $52,538 | $575,467 | $373,781 | $779 | 3.9% | 3.5 | 4.8% | 6.2% |
| 12 | Kitchener | Ont. | M | 238,951 | 4.5% | 5.9% | 5.6% | $74,656 | $43,295 | $405,032 | $396,963 | $1,033 | 2.6% | 4.6 | 5.2% | 26.4% |
| 13 | Aurora T | Ont. | S | 60,096 | 7.7% | 5.9% | 6.8% | $99,328 | $67,090 | $1,179,111 | $814,390 | $1,270 | 3.1% | 5.8 | 5.3% | 25.2% |
| 14 | Burlington CY | Ont. | M | 199,858 | 8.6% | 5.5% | 6.9% | $93,893 | $57,730 | $862,227 | $710,453 | $1,294 | 1.1% | 6.2 | 5.5% | 18.2% |
| 15 | Winnipeg | Man. | L | 736,028 | 7.1% | 7.4% | 6.3% | $72,265 | $44,503 | $399,382 | $330,022 | $1,067 | 2.8% | 3.8 | 8.5% | 24.0% |
| 16 | Ajax T | Ont. | M | 124,489 | 8.5% | 7.0% | 6.8% | $103,983 | $55,464 | $585,154 | $573,539 | $1,212 | 6.0% | 5.1 | 10.8% | 20.6% |
| 17 | Vaughan CY | Ont. | M | 330,306 | 9.1% | 5.1% | 6.8% | $101,325 | $61,637 | $1,265,691 | $959,514 | $1,327 | 1.3% | 7.6 | 6.7% | 52.3% |
| 18 | Newmarket T | Ont. | S | 89,595 | 6.9% | 5.9% | 6.8% | $96,053 | $54,925 | $750,212 | $700,481 | $1,178 | 1.7% | 6.3 | 5.3% | 21.6% |
| 19 | North Vancouver DM | B.C. | S | 91,984 | 5.6% | 6.4% | 6.1% | $99,393 | $69,980 | $1,575,419 | $1,264,378 | $1,449 | 0.1% | 9.4 | 8.4% | 23.4% |
| 20 | Barrie | Ont. | M | 149,572 | 7.1% | 6.5% | 5.6% | $86,518 | $46,376 | $419,495 | $429,222 | $1,153 | 2.2% | 4.6 | 4.1% | 9.6% |
| 21 | Gatineau V | Que. | M | 283,706 | 4.4% | 4.7% | 7.0% | $71,300 | $42,665 | $287,600 | $300,848 | $763 | 6.3% | 3.5 | 10.6% | 9.5% |
| 22 | Lethbridge | Alta. | S | 95,293 | 8.0% | 9.7% | 6.6% | $81,598 | $60,661 | $707,258 | $435,799 | $939 | 8.5% | 4.3 | 2.5% | 13.0% |
| 23 | Cambridge CY | Ont. | M | 136,830 | 3.9% | 5.8% | 5.6% | $83,564 | $46,706 | $432,153 | $411,770 | $1,065 | 1.6% | 4.4 | 3.4% | 18.1% |
| 24 | Halton Hills T | Ont. | S | 67,094 | 8.7% | 5.2% | 6.8% | $110,086 | $60,390 | $816,020 | $659,079 | $1,140 | 0.6% | 5.3 | 2.3% | 12.2% |
| 25 | Saskatoon | Sask. | M | 268,127 | 13.3% | 6.2% | 6.3% | $76,938 | $53,065 | $462,103 | $431,700 | $1,101 | 10.3% | 4.2 | 3.8% | 17.5% |
| 26 | St. Albert CY | Alta. | S | 72,372 | 11.3% | 8.3% | 6.8% | $133,871 | $82,998 | $787,660 | $466,879 | $1,322 | 5.6% | 3.1 | 4.4% | 9.0% |
| 27 | Québec V | Que. | L | 552,528 | 4.6% | 3.3% | 5.2% | $59,904 | $40,307 | $304,661 | $300,648 | $816 | 4.8% | 4 | 9.9% | 3.7% |
| 28 | Hamilton C | Ont. | L | 566,276 | 4.7% | 7.5% | 6.9% | $70,412 | $45,546 | $500,649 | $459,992 | $965 | 4.5% | 5.2 | 6.1% | 22.9% |
| 29 | Port Coquitlam CY | B.C. | S | 60,366 | 6.2% | 6.3% | 6.1% | $88,337 | $53,455 | $575,767 | $608,518 | $1,065 | 1.2% | 5.9 | 8.5% | 28.9% |
| 30 | Saanich DM | B.C. | M | 117,781 | 4.3% | 3.9% | 7.5% | $82,867 | $51,421 | $892,539 | $709,974 | $1,206 | 0.5% | 7.1 | 6.9% | 17.5% |
| 31 | Longueuil V | Que. | M | 247,715 | 4.7% | 6.4% | 6.2% | $56,412 | $36,192 | $267,986 | $318,020 | $733 | 4.9% | 4.5 | 12.5% | 12.2% |
| 32 | Markham T | Ont. | M | 344,557 | 8.5% | 7.6% | 6.8% | $92,329 | $58,341 | $1,202,922 | $946,996 | $1,271 | 1.4% | 8.1 | 8.2% | 59.3% |
| 33 | Edmonton CY | Alta. | L | 973,755 | 12.2% | 10.1% | 6.8% | $84,865 | $59,056 | $510,793 | $469,827 | $1,229 | 7.0% | 4.3 | 9.6% | 29.6% |
| 34 | Coquitlam CY | B.C. | M | 138,151 | 6.9% | 6.9% | 6.1% | $80,825 | $49,934 | $790,894 | $793,321 | $1,123 | 1.9% | 8.1 | 10.0% | 43.0% |
| 35 | Richmond Hill T | Ont. | M | 211,841 | 7.0% | 7.4% | 6.8% | $71,922 | $55,178 | $1,246,188 | $1,059,612 | $1,327 | 0.7% | 9.4 | 9.2% | 61.0% |
| 36 | Repentigny V | Que. | S | 85,626 | 2.8% | 4.7% | 6.7% | $77,896 | $45,298 | $365,299 | $293,317 | $717 | 4.9% | 3.4 | 4.5% | 5.8% |
| 37 | Mississauga CY | Ont. | L | 802,272 | 7.2% | 7.5% | 6.8% | $85,588 | $51,789 | $719,658 | $691,426 | $1,276 | 1.4% | 6.7 | 9.3% | 48.3% |
| 38 | Laval V | Que. | L | 434,017 | 5.6% | 5.4% | 8.5% | $66,449 | $40,614 | $412,399 | $365,417 | $3 | 3.0% | 4.5 | 8.9% | 30.9% |
| 39 | North Vancouver CY | B.C. | S | 53,605 | 6.7% | 5.9% | 6.1% | $67,209 | $41,557 | $663,775 | $906,374 | $1,432 | 0.3% | 10.9 | 13.8% | 31.2% |
| 40 | Milton T | Ont. | M | 107,247 | 17.6% | 4.0% | 6.8% | $114,128 | $55,565 | $721,124 | $634,980 | $1,248 | 1.8% | 5.4 | 4.2% | 29.1% |
| 41 | Caledon T | Ont. | S | 67,697 | 8.5% | 5.1% | 6.8% | $100,214 | $66,257 | $1,108,884 | $769,024 | $1,327 | 1.3% | 5.8 | 2.2% | 21.3% |
| 42 | Langley DM | B.C. | M | 116,915 | 7.8% | 4.7% | 6.1% | $94,233 | $58,469 | $922,000 | $766,515 | $1,319 | 1.2% | 6.9 | 2.5% | 15.7% |
| 43 | Toronto C | Ont. | L | 2,882,614 | 5.4% | 8.4% | 6.8% | $62,285 | $49,239 | $794,583 | $808,377 | $1,341 | 1.3% | 8 | 19.3% | 44.2% |
| 44 | Kingston | Ont. | M | 132,757 | 3.5% | 5.3% | 7.3% | $71,011 | $46,829 | $490,337 | $378,930 | $1,119 | 2.6% | 4.2 | 4.8% | 9.4% |
| 45 | Richmond CY | B.C. | M | 210,539 | 8.1% | 6.0% | 6.1% | $93,911 | $46,734 | $991,692 | $926,614 | $1,353 | 1.0% | 10.3 | 7.9% | 57.5% |
| 46 | Pickering CY | Ont. | S | 98,741 | 6.6% | 8.3% | 6.8% | $103,664 | $59,075 | $776,452 | $634,214 | $1,327 | 1.3% | 5.3 | 7.9% | 18.6% |
| 47 | Whitby T | Ont. | M | 136,296 | 6.9% | 6.8% | 6.8% | $103,442 | $56,169 | $650,311 | $577,398 | $1,103 | 1.1% | 4.9 | 7.2% | 13.6% |
| 48 | Vancouver CY | B.C. | L | 669,660 | 6.0% | 7.4% | 6.1% | $62,938 | $45,250 | $997,799 | $1,348,591 | $1,757 | 0.8% | 14.8 | 15.9% | 46.6% |
| 49 | St. Catharines CY | Ont. | M | 136,554 | 1.0% | 6.6% | 6.9% | $65,265 | $41,211 | $410,409 | $333,466 | $1,008 | 2.4% | 4.3 | 2.8% | 15.2% |
| 50 | Châteauguay V | Que. | S | 51,356 | 6.4% | 7.0% | 6.2% | $65,026 | $41,497 | $284,224 | $264,124 | $775 | - | 3.4 | 6.7% | 9.8% |
| 51 | Maple Ridge DM | B.C. | S | 84,387 | 6.8% | 6.0% | 6.1% | $89,525 | $49,877 | $592,510 | $579,164 | $947 | 0.5% | 5.9 | 5.9% | 13.4% |
| 52 | Calgary | Alta. | L | 1,326,819 | 13.1% | 9.0% | 8.5% | $88,670 | $72,067 | $733,978 | $517,030 | $1,260 | 6.9% | 3.9 | 10.1% | 29.8% |
| 53 | Brampton CY | Ont. | L | 607,113 | 9.6% | 7.1% | 6.8% | $88,831 | $49,529 | $542,885 | $599,148 | $1,243 | 1.2% | 6.1 | 7.0% | 44.7% |
| 54 | Lévis V | Que. | M | 146,830 | 3.8% | 2.4% | 6.4% | $77,911 | $46,485 | $346,183 | $287,403 | $744 | 4.6% | 3.3 | 4.3% | 0.8% |
| 55 | Surrey CY | B.C. | L | 527,547 | 7.9% | 7.2% | 6.1% | $82,166 | $50,756 | $696,992 | $711,382 | $1,006 | 0.4% | 7.2 | 7.7% | 45.4% |
| 56 | New Westminster CY | B.C. | S | 73,584 | 7.0% | 7.1% | 6.1% | $69,035 | $40,729 | $399,744 | $546,270 | $1,217 | 0.4% | 6.7 | 17.1% | 34.1% |
| 57 | Terrebonne V | Que. | M | 115,632 | 6.0% | 3.9% | 6.7% | $81,512 | $44,159 | $323,545 | $305,038 | $727 | 2.2% | 3.5 | 4.0% | 7.3% |
| 58 | Niagara Falls CY | Ont. | S | 87,938 | 2.6% | 6.4% | 6.9% | $67,159 | $40,459 | $384,963 | $335,520 | $945 | 2.3% | 4.4 | 2.1% | 16.4% |
| 59 | Abbotsford - Mission | B.C. | M | 150,015 | 7.9% | 7.2% | 6.1% | $75,931 | $46,390 | $550,887 | $490,198 | $928 | 0.5% | 5.5 | 1.3% | 31.6% |
| 60 | Medicine Hat | Alta. | S | 64,548 | 3.3% | 8.2% | 6.6% | $81,027 | $55,504 | $497,398 | $335,088 | $825 | 5.4% | 3.4 | 1.8% | 8.9% |
| 61 | Wood Buffalo | Alta. | S | 78,008 | 9.6% | 6.8% | 9.3% | $196,285 | $120,607 | $463,550 | $524,111 | $1,454 | 17.8% | 2.4 | 21.5% | 19.8% |
| 62 | Burnaby CY | B.C. | M | 248,793 | 6.8% | 8.6% | 6.1% | $68,715 | $43,499 | $782,804 | $902,864 | $1,318 | 0.8% | 10.6 | 14.8% | 55.2% |
| 63 | Prince George | B.C. | S | 72,134 | -1.6% | 7.5% | 7.4% | $83,250 | $52,454 | $299,389 | $220,572 | $827 | 4.2% | 2.4 | 2.3% | 9.1% |
| 64 | Oshawa CY | Ont. | M | 166,527 | 6.5% | 8.9% | 6.8% | $77,242 | $43,456 | $393,585 | $411,204 | $1,121 | 2.1% | 4.8 | 5.2% | 10.5% |
| 65 | Windsor | Ont. | M | 219,373 | 1.0% | 8.7% | 7.6% | $58,221 | $36,678 | $281,799 | $226,424 | $840 | 2.9% | 3.3 | 1.8% | 26.5% |
| 66 | Red Deer County | Alta. | M | 106,620 | 10.9% | 7.3% | 8.3% | $94,743 | $88,694 | $1,054,577 | $516,588 | $1,016 | 13.6% | 3.4 | 3.3% | 11.6% |
| 67 | Victoria CY | B.C. | S | 87,387 | 5.1% | 4.4% | 7.5% | $53,288 | $34,255 | $435,509 | $574,166 | $1,224 | 0.5% | 8.3 | 8.8% | 12.9% |
| 68 | Strathcona County SM | Alta. | M | 109,680 | 12.0% | 7.4% | 6.8% | $130,942 | $89,201 | $962,500 | $514,234 | $1,359 | 3.2% | 3.2 | 3.3% | 9.0% |
| 69 | Brantford | Ont. | M | 100,442 | 3.5% | 7.0% | 6.9% | $68,241 | $40,861 | $325,190 | $301,757 | $911 | 2.2% | 3.9 | 2.4% | 9.7% |
| 70 | Fredericton | N.B. | S | 60,805 | 5.4% | 6.6% | 8.9% | $63,285 | $42,270 | $328,704 | $286,656 | $838 | 4.3% | 3.6 | 2.8% | 6.9% |
| 71 | Clarington MU | Ont. | S | 95,594 | 7.9% | 6.2% | 6.8% | $97,472 | $50,970 | $530,597 | $480,444 | $979 | 0.2% | 4.6 | 3.7% | 6.6% |
| 72 | Peterborough | Ont. | S | 83,394 | 2.5% | 8.6% | 4.9% | $67,196 | $38,845 | $408,402 | $321,190 | $982 | 1.0% | 4.1 | 3.1% | 5.5% |
| 73 | Norfolk | Ont. | S | 65,675 | 1.1% | 6.3% | 6.9% | $70,547 | $44,410 | $499,483 | $373,109 | $683 | 2.4% | 4.6 | 0.5% | 11.4% |
| 74 | Welland CY | Ont. | S | 53,368 | 2.2% | 7.6% | 6.9% | $65,058 | $38,271 | $301,554 | $261,341 | $915 | 1.4% | 3.6 | 1.0% | 9.4% |
| 75 | Chilliwack | B.C. | S | 88,645 | 9.3% | 8.1% | 6.1% | $74,846 | $42,826 | $489,978 | $457,237 | $872 | 1.5% | 5.6 | 1.1% | 11.2% |
| 76 | Kelowna | B.C. | M | 134,397 | 9.9% | 5.5% | 9.3% | $71,038 | $47,677 | $705,218 | $510,948 | $1,052 | 0.6% | 5.6 | 3.1% | 11.5% |
| 77 | Sault Ste. Marie | Ont. | S | 74,710 | -2.5% | 6.8% | 7.6% | $69,050 | $44,118 | $330,526 | $247,110 | $873 | 3.1% | 3.1 | 2.1% | 8.1% |
| 78 | Greater Sudbury | Ont. | M | 164,818 | 0.0% | 6.3% | 7.6% | $78,956 | $50,724 | $387,783 | $316,977 | $990 | 5.3% | 3.3 | 3.2% | 5.9% |
| 79 | Sherbrooke | Que. | M | 167,635 | 5.6% | 7.3% | 7.0% | $53,225 | $35,642 | $251,440 | $258,242 | $619 | 6.3% | 3.9 | 3.3% | 5.5% |
| 80 | Chatham-Kent | Ont. | M | 105,467 | -0.5% | 10.2% | 7.6% | $62,715 | $41,065 | $339,129 | $207,192 | $763 | 3.1% | 2.7 | 1.3% | 8.0% |
| 81 | Saint-Jérôme V | Que. | S | 76,911 | 8.9% | 6.3% | 5.8% | $54,179 | $33,611 | $218,256 | $240,657 | $720 | 5.4% | 3.7 | 1.9% | 2.3% |
| 82 | Dollard-Des Ormeaux V | Que. | S | 53,144 | 5.0% | 7.0% | 11.0% | $78,854 | $52,798 | $730,247 | $504,877 | $869 | 2.5% | 4.8 | 9.5% | 37.7% |
| 83 | Montréal V | Que. | L | 1,785,468 | 5.3% | 8.7% | 11.0% | $48,261 | $32,117 | $309,197 | $478,859 | $799 | 4.0% | 7.4 | 19.3% | 32.8% |
| 84 | Kamloops | B.C. | S | 89,574 | 2.0% | 6.9% | 9.3% | $83,004 | $50,107 | $477,399 | $384,328 | $949 | 1.1% | 4 | 2.8% | 8.5% |
| 85 | Halifax | NS | L | 426,537 | 4.9% | 6.1% | 7.0% | $71,162 | $40,824 | $384,647 | $340,296 | $1,063 | 2.6% | 4 | 7.1% | 6.9% |
| 86 | Nanaimo | B.C. | S | 92,357 | 6.6% | 5.6% | 7.5% | $66,710 | $40,497 | $494,534 | $439,399 | $895 | 1.5% | 5.6 | 1.9% | 8.8% |
| 87 | Moncton | N.B. | S | 75,401 | 6.3% | 8.1% | 8.1% | $60,235 | $37,406 | $242,508 | $231,842 | $793 | 6.5% | 3.2 | 2.6% | 3.6% |
| 88 | Sarnia | Ont. | S | 73,758 | -0.6% | 13.8% | 7.6% | $78,754 | $48,955 | $432,698 | $266,098 | $999 | 3.8% | 2.9 | 1.6% | 7.6% |
| 89 | Belleville | Ont. | S | 50,597 | -0.2% | 6.1% | 7.3% | $69,972 | $38,131 | $332,761 | $279,342 | $980 | 3.1% | 3.8 | 2.1% | 5.2% |
| 90 | Mirabel V | Que. | S | 52,054 | 17.8% | 3.8% | 5.8% | $80,564 | $40,913 | $306,461 | $331,100 | $740 | 4.3% | 4 | 2.5% | 1.6% |
| 91 | Saint-Hyacinthe | Que. | S | 55,076 | 2.0% | 6.3% | 6.2% | $55,783 | $33,896 | $290,554 | $256,054 | $640 | 3.7% | 4 | 1.1% | 3.4% |
| 92 | Grande Prairie County No. 1 | Alta. | S | 66,952 | 12.8% | 7.0% | 7.9% | $110,179 | $88,565 | $879,718 | $516,620 | $1,022 | 19.8% | 3.3 | 2.5% | 8.4% |
| 93 | Saint-Jean-sur-Richelieu | Que. | S | 96,695 | 2.9% | 4.9% | 6.2% | $62,998 | $38,526 | $314,968 | $309,440 | $673 | 2.8% | 4.2 | 3.8% | 1.3% |
| 94 | Airdrie | Alta. | S | 55,877 | 20.3% | 7.4% | 8.5% | $113,222 | $61,110 | $428,647 | $402,756 | $1,242 | 12.5% | 3.4 | 2.4% | 8.5% |
| 95 | North Bay | Ont. | S | 55,511 | 0.3% | 7.0% | 7.6% | $62,750 | $43,988 | $320,935 | $297,603 | $918 | 2.9% | 3.6 | 2.8% | 3.7% |
| 96 | Granby | Que. | S | 67,127 | 3.8% | 5.7% | 6.2% | $54,949 | $35,352 | $309,635 | $293,367 | $637 | 3.1% | 4.4 | 0.7% | 3.4% |
| 97 | Drummondville | Que. | S | 76,599 | 4.4% | 4.9% | 6.8% | $51,558 | $35,215 | $232,239 | $191,182 | $582 | 2.8% | 3 | 0.8% | 1.8% |
| 98 | Trois-Rivières | Que. | M | 136,511 | 2.3% | 5.6% | 11.3% | $51,769 | $35,216 | $247,482 | $202,139 | $587 | 6.2% | 3.1 | 2.3% | 1.8% |
| 99 | Saint John | N.B. | S | 69,279 | -1.7% | 10.0% | 9.0% | $58,273 | $35,063 | $212,425 | $221,332 | $730 | 8.6% | 3.3 | 3.8% | 3.8% |
| 100 | Kawartha Lakes | Ont. | S | 76,609 | 2.0% | 6.2% | 4.9% | $71,723 | $43,832 | $525,500 | $398,367 | $1,101 | 0.3% | 4.7 | 0.8% | 3.9% |