What is to blame for rising food prices?
In part two of our series, Andrew Hepburn considers wheat stocks
Barley ripens in a field owned by the “Solgonskoye” joint-stock company, inspects wheat in a field near the village of Solgon, 308 km (191 miles) southwest of Russian Siberian city of Krasnoyarsk, August 7, 2010. Russia plans to discuss after October 1 a possible extension or a scrappage of the grain export ban which will go in place from August 15 until the end of the year, a government source told Reuters on Friday. REUTERS/Ilya Naymushin (RUSSIA – Tags: ENVIRONMENT BUSINESS POLITICS AGRICULTURE)
Share

This is part two of a series. In part one, Andrew Hepburn looked at whether rising demand from China and India can be blamed for food price hikes. In the next and last article, Hepburn will examine the role played by financial speculators, as well as U.S. subsidies for biofuel.
In our first post on the food crisis, we concluded China and India are not to blame for soaring food prices in recent years. But with those countries exonerated, just what is responsible for costlier groceries?
One straightforward hypothesis is that high prices are simply the result of very low food inventories. As stocks of crops and other agricultural commodities decline, prices tend to rise. And when stocks get critically low, the cost of food can rise sky-high. This is especially true of staples like grains for which, at least in the short term, consumption demand tends to be very unresponsive to price (i.e. even runaway prices will not reduce demand significantly because grains are such a necessity).
Agricultural markets focus intently on the level of stocks for things like wheat and corn, because such data provides a sense of how much of a buffer exists against supply shortfalls or sharp increases in demand. In particular, the key figure market participants watch is something called the stocks-to-use ratio, the level of stocks relative to demand. A high ratio means inventories are plentiful and prices likely low, and vice versa.
Wheat and the first food crisis
For the sake of simplicity, I’m going to focus here on the food price spike that peaked in 2008. That rise was the culmination of what might be termed “the first major world food crisis of recent years.” And rather than examine every grain, I’ll take a look at one in some detail, wheat. Wheat is a good example because it’s widely consumed and produced, a necessity if there ever was one, and saw a massive run-up in late 2007/early 2008.
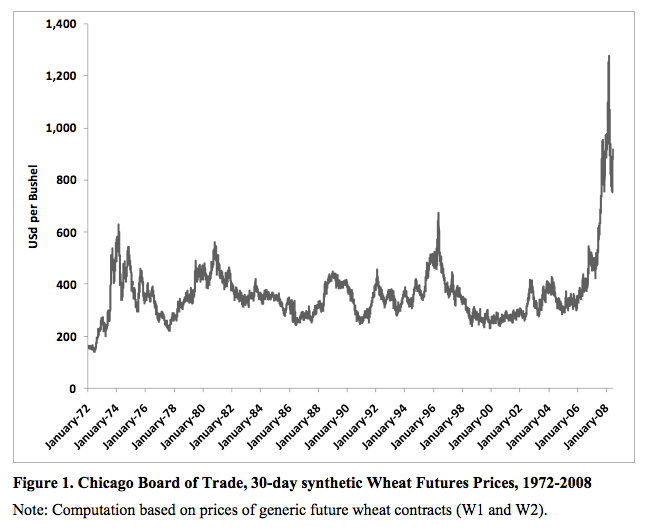
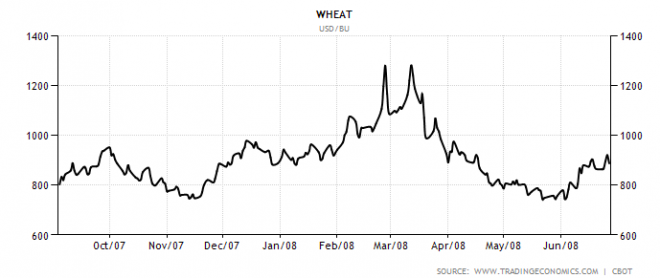
Below are wheat prices leading up to that. Note the dramatic rise at the end, when prices reached $13 per bushel in February 2008.

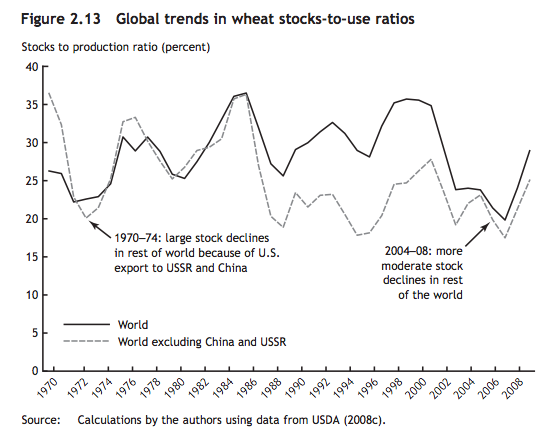
Now, the following chart from the International Food Policy Research Institute shows two stock-to-use ratios for wheat, one that includes China and one that excludes it:
Why take out China? Because, as FAO economist David Dawe argues, China’s stocks of grains aren’t particularly important to world markets because the country is mostly self-sufficient in key staples anyway, and did not increase its imports even after greatly reducing inventories in 1999/2000. Most importantly, these stocks aren’t really “available” for global use—China considers wheat stocks to be a strategic reserve (think “food security”) and hasn’t been willing to sell on the global market even when prices were very high. So China’s share of wheat is virtually irrelevant when trying to assess what moves international prices.
This detail is crucial. As the chart above shows, the world’s total wheat stock declined dramatically between 2004 and 2008. Most of the dip, though, was driven by a reduction in the Chinese stock. Once China is taken out of the equation, the situation in 2008 starts to look much less dire. Yes, stocks were low, but the decline was not nearly as precipitous as the global stocks-to-use ratio would indicate when China is included. Prices, according to this reasoning, had no reason to spike as they did, since China’s stock wasn’t available for international trade and its decline did not result in additional Chinese demand for wheat imports.
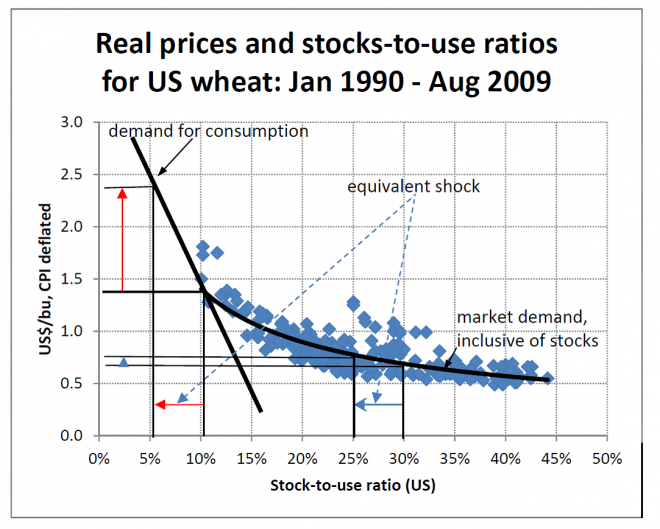
Case closed then? Not quite. In the course of conversations with an FAO official, who asked to remain anonymous, I was provided with another graph showing U.S. wheat stocks relative to consumption. It plots inflation-adjusted wheat prices against the U.S. stocks-to-use ratio. (U.S. wheat stocks are closely watched because they tend to hold much of the inventory that is responsive to price—i.e. unlike China which doesn’t really doesn’t trade. If there’s a huge spike in price, the world looks to the U.S. to provide the bulk of the buffer.)
 The chart suggests that when stocks become very low, prices can rise to stratospheric levels. At normal levels of inventory, stockholders are usually willing to sell their grain if prices rise, expecting the increase to be temporary. So the demand for inventory by stockholders tends to be very “elastic”: when prices go up, their demand falls considerably. This behaviour acts to dampen the surge in prices.
But when there is very little stock in the pipeline, the only possible response on the demand side is from the consumer. Because grain is a basic necessity, consumption demand tends to be very unresponsive to price. It takes very high prices to “destroy” demand. So any adverse shock to the market, such as a drought, sends prices to the moon.
There can also be a self-reinforcing cycle when stocks are critically low: consumers hoard grain, fearing shortages. This sends inventories even lower and adds to the panic.
The data provided by the FAO official and displayed in the graph above indicates that by February 2008, U.S. wheat stocks had plunged to 11.6 per cent of total U.S. consumption. February 2008 was the month when prices surged over $13 per bushel ($1.75 using the FAO’s CPI-adjusted wheat price).
U.S. wheat stocks had dropped to similarly low levels before but never quite that low—and prices had never risen that high. In 1996, for example, wheat stocks dipped to 12.43 per cent as a share of consumption, but the inflation-adjusted price of a bushel of wheat didn’t rise past $1.35, substantially below the 2008 peak.
It’s tempting to conclude that even though U.S. wheat stocks didn’t drop much lower than previous historical lows, they dipped just low enough to cross the critical threshold that would send prices flying.
Still, analysts are still debating the threshold hypothesis and there’s no consensus on whether the U.S. stocks-to-use ratio is truly the best gauge of available inventory.
The most convincing argument against that theory is that low stocks, in and of themselves aren’t enough for a price spike. Suppose stocks are low but the market expects a good harvest. In this event, there would be no cause for panic as expectations would be for a future rise in supplies.
As the FAO official set out last year in a presentation:
- A large adverse supply shock is neither a necessary nor sufficient condition for a price hike.
- Low stocks are a necessary but not a sufficient condition for a price hike.
- Low stocks and a large adverse supply shock are a sufficient condition for a price hike (perhaps no more necessary in the presence of demand shocks).
Obviously there were very low wheat stocks in early 2008. But was there actually a large supply shock, i.e. an unexpected drop in supply? That’s debatable. The most common explanation for low wheat stocks in 2008 was a drought in Australia. Yet according to USDA data, the market was fully aware of that crop disappointment by October 2007, when production estimates for Australian wheat were slashed from 21 million tonnes to 13.5 million tonnes. Prices responded to the shortfall Down Under, nearing $10 per bushel before falling below $8. The final spike, though, happened afterwards, but during a period in which global production and consumption forecasts remained quite stable.
 What can we conclude from all this? Global inventories of wheat in early 2008 were very low. Of that there is little doubt. What is an open question is whether the drought in Australia, among other supply disruptions, was the real cause of the final massive rally in prices, or whether other factors were at work.
In our final installment, we’ll meet a researcher who thinks the rising food prices of recent years are almost entirely due to two other causes, both of which he believes can be eliminated by correcting past policy mistakes. Not everyone agrees, but it’s certainly, so to say, food for thought.
—
Andrew Hepburn is a former hedge fund analyst. He’s a commodities bear and a keen observer of financial speculators. For Maclean’s he blogs about the economy and financial markets.
