A cocktail party guide to quoting from the National Household Survey
You shall not talk about trends
An employee make his way to work at Statistics Canada in Ottawa on July 21, 2010. The Canadian Centre for Policy Alternatives says public service spending cuts have mostly focused on service delivery, contradicting the Harper government’s assurances that cuts would spare front-line resources. Statistics Canada will take the largest proportional loss, losing a third of its staff according to the study. THE CANADIAN PRESS/Sean Kilpatrick
Share

There is lots of interesting information in the latest National Household Survey data tranche, on income and housing, which Statistics Canada published this morning. Did you know Canadians in the top one per cent of the income distribution are mostly educated older white men? Or that fully a quarter of Canadians spend 30 per cent or more of their total — not disposable — income on things like rent and mortgage? OK, fine, if you every read the news you probably suspected as much. Still, now you can quote the exact numbers at cocktail parties with the confidence that comes from StatsCan’s quality guarantee.
If you care about accuracy, though, you might wish to avoid drawing conclusions about what today’s NHS numbers tells us about income and housing trends. How much has income inequality widened — or shrunk? Are the poor struggling more or less? And what percentage of Canadians used to spend a third or more of their income on shelter five years ago? If you don’t have a Ph.D. in statistics or economics, StatsCan’s friendly advice is: Don’t try to answer those questions on your own. Simple math is enough if you want to use NHS data to, say, see the distribution of low-income people across provinces or ethnic and age groups. But extrapolating trends across the years now requires field-specific expertise. And even the pros must tread carefully, judging from StatsCan’s lengthy guide to the pitfalls of comparing the NHS, a voluntary survey, to the old, mandatory long-form census.
As my Econowatch colleague Kevin Milligan explained some time ago, the problem with terminating the long-form census is that you never know why people might decide not to respond to a voluntary questionnaire. If they do so at random, you’re fine: The new, voluntary data sample is comparable with the old, mandatory, randomized samples. But if, for example, poorer people are more likely not to answer, then you have a problem. At least a couple of Canadian studies based on both voluntary and mandatory income surveys have found precisely this issue with low-income respondents.
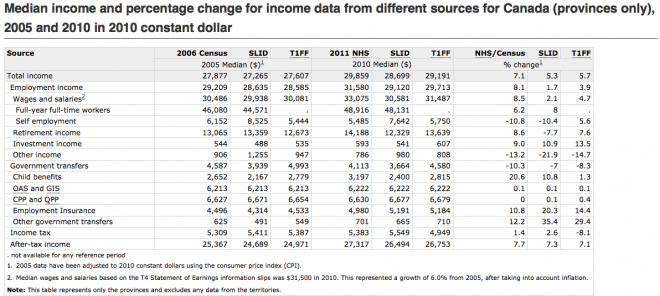
When I asked Alison Hale, director of income statistics at StatsCan, about comparability problems between NHS and the census, she pointed me to the table below (click here to see a larger image):
The key columns are the one on the right, which show the percentage change between 2005 and 2010 data for various income measures as captured by three different sources: The NHS/census, the Survey of Labour and Income Dynamics and the T1 Family File. As you can see, trends derived from the an NHS-census comparison generally do not line up with either of continuous series.
This holds true for housing trends as well, said Hale, with one exception: The home-ownership rate. There, the NHS/Census tells exactly the same story as other surveys of home-ownership: The share of Canadians who own their home has climbed to 69 per cent, up from 68.4 per cent.
Somehow, though, I don’t think that’s the kind of insight that’s going to wow a cocktail party audience.
