What’s happening to middle class incomes?
The news isn’t bad. The real issue is men’s wages.
Share
It’s almost a cliché to note that the interests of the middle classes play a disproportionate role in politics. There are many obvious reasons for this: to the extent that income is an important factor in determining political preferences, the Median Voter Theorem predicts that voters in the middle of the income distribution will determine who wins elections. Moreover, many people are inclined to believe that they are members of the middle class, even when they’re not.
There are reports that the Department of Finance has put together some research documenting the problems of the middle class. One of its conclusions is apparently that income growth in the middle fifth (or quintile) of the income distribution has lagged growth in the quintiles above and below it. The report has not yet been made public, but it should be possible to check these results against publicly-available data. Much of what follows is taken from Cansim Table 202-0701.
Many – if not most – people appear to have difficulty placing themselves in the income distribution, so here are the 2011 thresholds of the five income quintiles according to Table 202-0405:
Income quintile thresholds: 2011 Quintile Lower threshold Upper threshold Lowest $25,900 Second $25,900 $46,100 Middle $46,100 $70,800 Fourth $70,800 $110,500 Highest $110,500
The Cansim data start in 1976, and here’s how average incomes in these quintiles (all incomes are in inflation-adjusted 2011 dollars) have evolved since then:
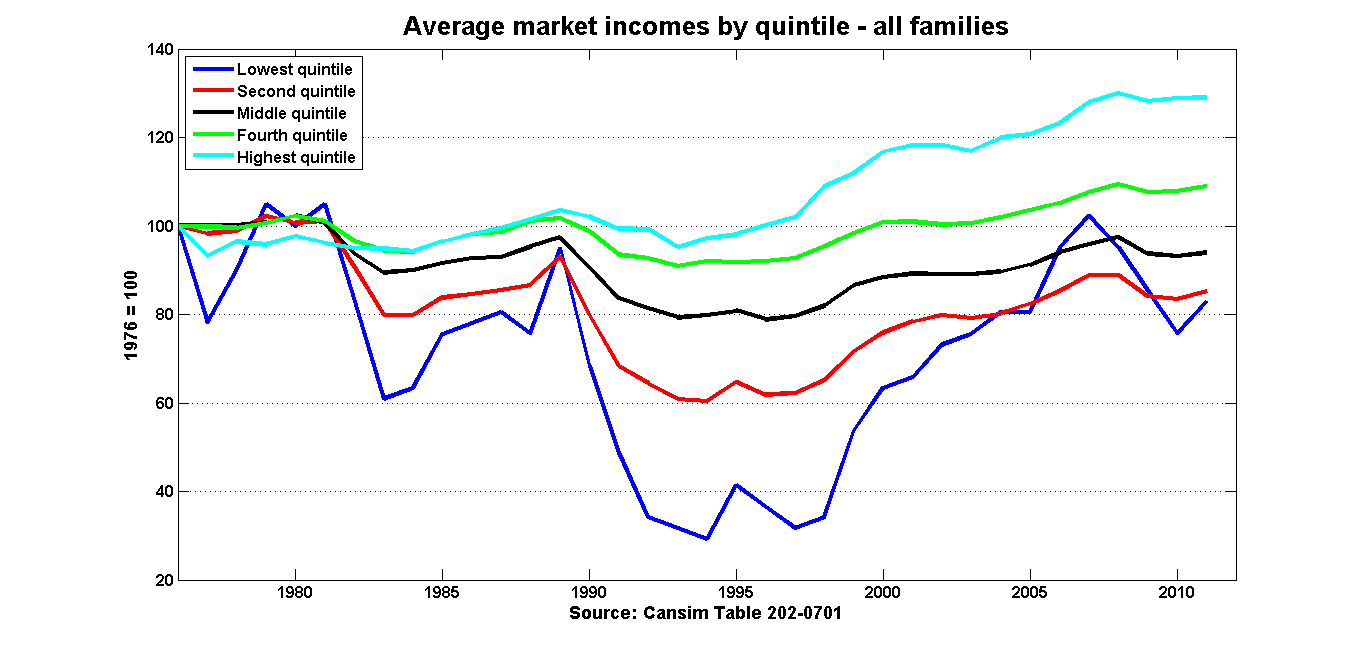
Average real middle quintile incomes were lower in 2011 than they were in 1976, so concerns about income trends cannot be dismissed. What does jump out of the graph is the U-shaped profile for all income groups, and especially for the three lowest quintiles: there is no sustained trend. The 1980s and the first half of the 1990s were terrible, but much of those losses have been recovered over the last 15 years (this is Brian Lee Crowley’s point). I suppose it’s a good thing to be concerned with incomes in the lower- and middle-income groups, but the time to be really concerned about turning around a worrisome trend was twenty years ago. The past 15 years or so has seen significant broad-based improvements in wages and incomes.
Another thing to consider is that the above chart is for market income: wages and investment income. However, purchasing power is defined by income after taxes paid and transfer payments received from the government. (These transfers are especially important for the lowest income quintile.) Here is how after-tax incomes have evolved:
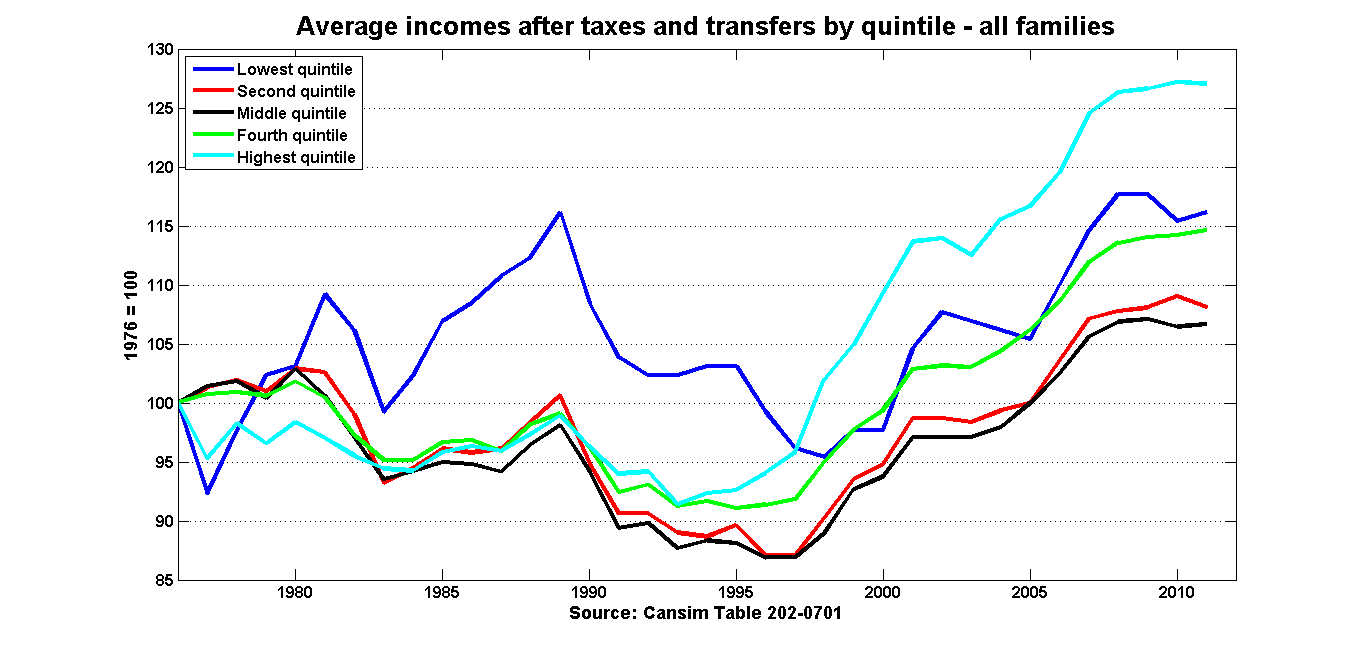
This graph reproduces what we’ve heard about the Department of Finance study, but of course we’ll have to wait until it’s made publicly available before we know for sure where their numbers came from. But the existing publicly-available data do show that real, after-tax income growth in the middle income group has lagged behind the quintiles above and below it in the income distribution. It should also be noted that this summary masks the U-shaped pattern: income growth over the past 15 years has been reasonably robust.
It’s worth taking a closer look at the relationship between market and after-tax income, because this difference is a measure of how governments redistribute income:
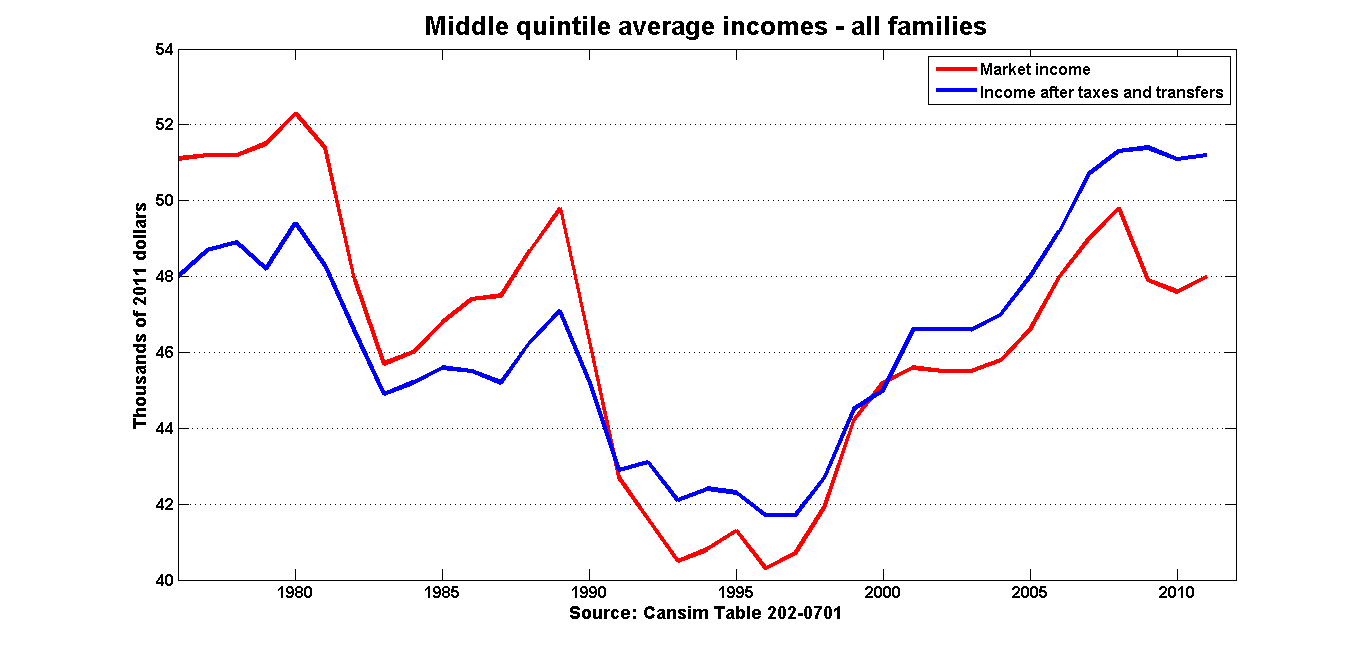
The first years of the sample were unhappy ones for the middle quintile. Real market incomes were falling, and this reduction was not offset by a favourable income distribution regime . But both trends reversed themselves in the mid-1990s: market incomes increased, and the middle class benefited more from income redistribution.
This chart shows the net redistribution received by each quintile, expressed as share of total income:
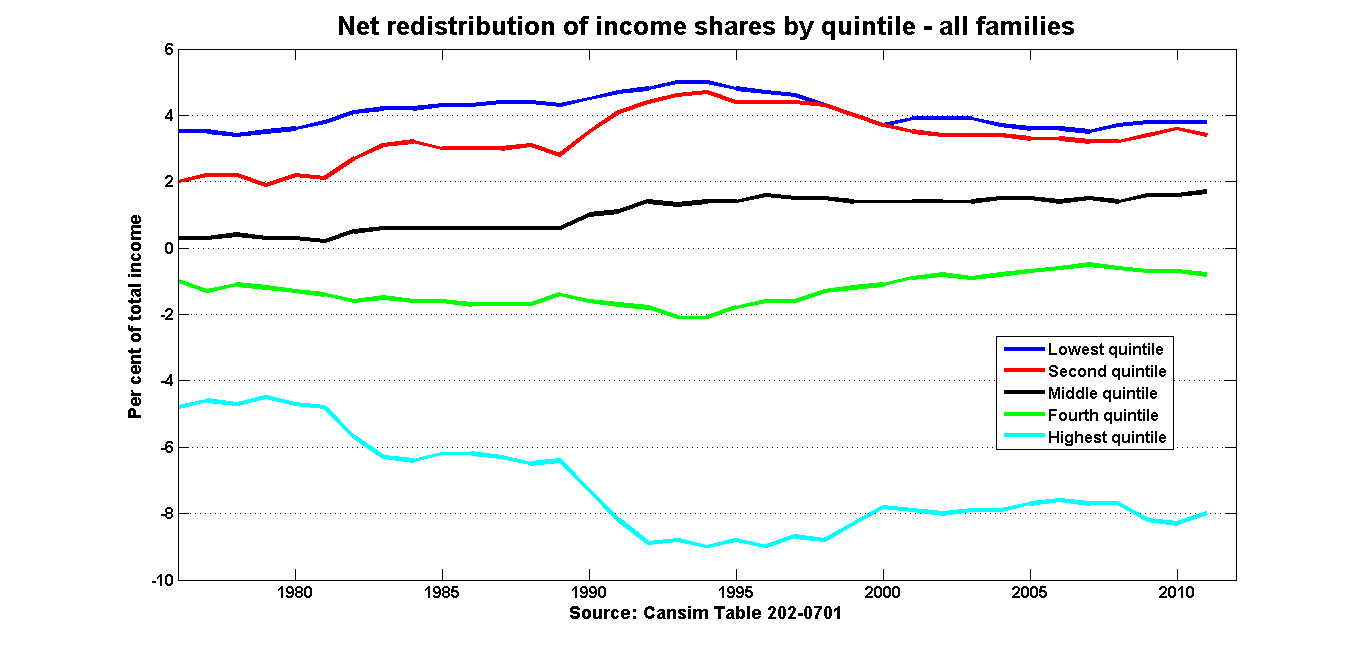
Some – but not all – of the gains at the top of the income distribution were offset by a tax and transfer system that took an extra three per cent of total income and redistributed it further down. But not, at you might think, to the lowest income quintile: the middle quintiles have gained most. Governments seem to have modified Robin Hood’s motto to “Take from the rich, give to the median.”
Another important issue is what is going on with men’s wages. Much of the gains over the past decades can be attributed to gains made by women in the labour force: more women are working, and they are earning more.
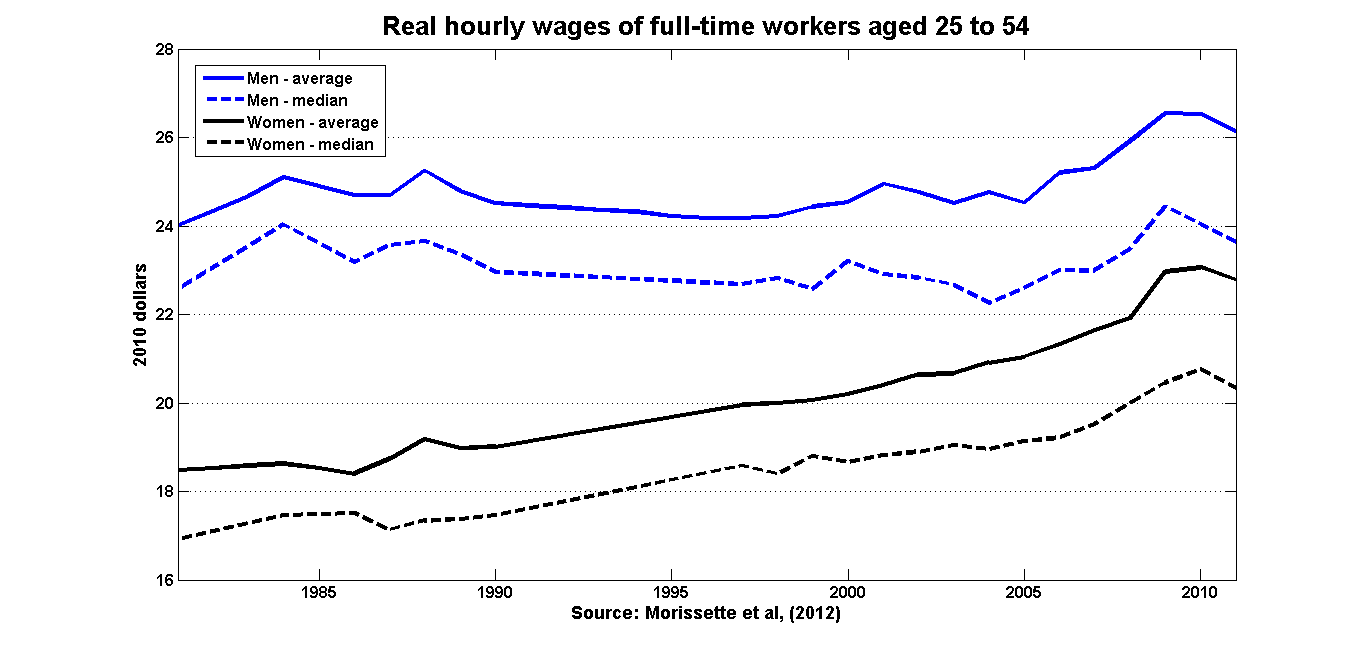
(Source) The slight uptick in men’s wages just before the recession was the first noticeable increase in decades, and much of those gains were lost in the recession.
The stagnation of middle-class incomes may no longer be a problem that needs solving. The stagnation of male wages is still a major challenge for policy-makers.