Canada’s Best Places for Arts & Community 2017
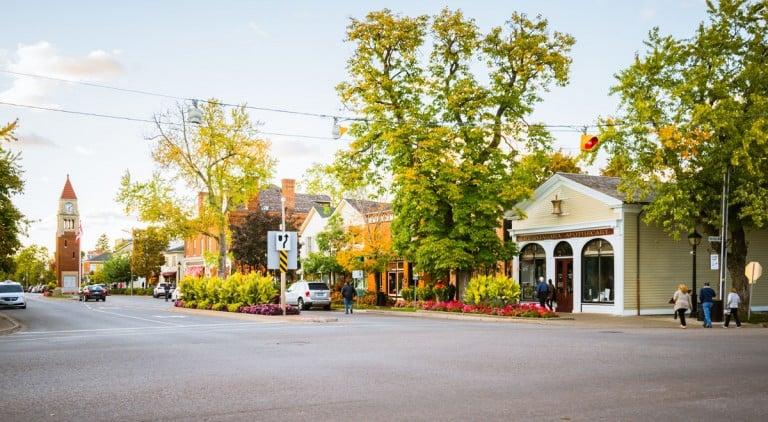
A scenic little city gets the top spot
Share
[widgets_on_pages id=”2017 – BPTL – NAV”]
Canada is said to be a friendly nation, but some communities are a little more open than others.
To get a sense of what life is like in a community we look to two key metrics. First, we rely on the percentage of the population who work in the arts, sports and recreation sector as a proxy for how focused a community is on cultural activities. The higher the percentage, the richer the cultural offerings.
Photo gallery: Top 25 Best Places to Live in Canada »
This year, we also consider the community involvement index provided to us by Environics Analytics. To build this index, a sister firm of Environics conducts a wide ranging survey of residents. Their answers help determine how engaged residents are in their community. The base value is 100. If the index is above 100, it indicates a more active community. An index of 110 indicates that the people of the community are thought to be 10% more active in their community than what you’d find in the average Canadian city.
[widgets_on_pages id=”2017 – BPTL – SUBNAV”]
| Rank | Name | Province | % of Pop. Working in Arts | Community Index |
|---|---|---|---|---|
| 1 | Niagara-on-the-Lake | Ont. | 4.0% | 127 |
| 2 | Westmount | Que. | 3.5% | 122.1 |
| 3 | Chester | NS | 2.8% | 121.3 |
| 4 | Whistler | B.C. | 5.5% | 115.6 |
| 5 | Oak Bay | B.C. | 2.6% | 119.6 |
| 6 | Tiny | Ont. | 2.5% | 121.2 |
| 7 | Stratford | Ont. | 3.0% | 116.6 |
| 8 | Brock | Ont. | 2.2% | 123.4 |
| 9 | Prince Edward County | Ont. | 3.1% | 115.5 |
| 10 | Centre Wellington | Ont. | 2.3% | 119.9 |
| 11 | North Vancouver DM | B.C. | 4.3% | 113.4 |
| 12 | Brant | Ont. | 2.0% | 121.9 |
| 13 | West Vancouver DM | B.C. | 4.1% | 112.9 |
| 14 | Wilmot | Ont. | 2.5% | 116.7 |
| 15 | Squamish | B.C. | 2.8% | 114.2 |
| 16 | Orillia | Ont. | 2.3% | 115.6 |
| 17 | Owen Sound | Ont. | 2.2% | 116.1 |
| 18 | Delta DM | B.C. | 2.7% | 112.9 |
| 19 | St. Catharines | Ont. | 2.0% | 117.9 |
| 20 | Midland | Ont. | 1.9% | 120.2 |
| 21 | Fort Erie | Ont. | 2.0% | 117.4 |
| 22 | Lincoln | Ont. | 1.9% | 120.7 |
| 23 | Guelph TP | Ont. | 3.0% | 110.9 |
| 24 | Meaford | Ont. | 2.6% | 111.1 |
| 25 | Mississippi Mills | Ont. | 2.0% | 115.2 |
| 26 | Erin | Ont. | 2.3% | 112.7 |
| 27 | Norfolk | Ont. | 1.6% | 131 |
| 28 | North Saanich | B.C. | 1.9% | 116.5 |
| 29 | Belleville | Ont. | 2.1% | 114 |
| 30 | Victoria | B.C. | 3.4% | 109.2 |
| 31 | Niagara Falls | Ont. | 2.0% | 114.9 |
| 32 | Peterborough | Ont. | 1.8% | 116.7 |
| 33 | Capital F (BC), RDA | B.C. | 4.9% | 107.9 |
| 34 | Trent Hills | Ont. | 1.5% | 133.7 |
| 35 | Scugog | Ont. | 2.1% | 112.6 |
| 36 | Wasaga Beach | Ont. | 1.6% | 123 |
| 37 | Collingwood | Ont. | 2.5% | 110.1 |
| 38 | Wellesley | Ont. | 1.5% | 129.4 |
| 39 | Welland | Ont. | 1.6% | 119.9 |
| 40 | King | Ont. | 2.6% | 109.1 |
| 41 | North Perth | Ont. | 1.5% | 127.8 |
| 42 | Kingston | Ont. | 3.0% | 108.1 |
| 43 | Grimsby | Ont. | 2.3% | 110.4 |
| 44 | Mont-Royal | Que. | 1.9% | 113.8 |
| 45 | Abbotsford - Mission | B.C. | 1.9% | 113.4 |
| 46 | Quinte West | Ont. | 1.5% | 119.7 |
| 47 | Saanich DM | B.C. | 1.9% | 112.7 |
| 48 | Greater Napanee | Ont. | 1.8% | 113.5 |
| 49 | Lethbridge County | Alta. | 1.4% | 137.4 |
| 50 | Salmon Arm | B.C. | 1.8% | 114.9 |
| 51 | Mission | B.C. | 1.8% | 114.7 |
| 52 | Port Colborne | Ont. | 1.5% | 122.4 |
| 53 | Port Moody | B.C. | 4.3% | 105.9 |
| 54 | Huntsville | Ont. | 1.7% | 115.3 |
| 55 | Nelson | B.C. | 3.3% | 106.5 |
| 56 | Whitehorse | YT | 2.4% | 108.5 |
| 57 | Haldimand County | Ont. | 1.4% | 122.7 |
| 58 | Charlottetown | PEI | 1.9% | 111.5 |
| 59 | Wetaskiwin County No. 10 | Alta. | 1.3% | 138.7 |
| 60 | Fredericton | NB | 2.8% | 106.8 |
| 61 | Severn | Ont. | 1.7% | 114.3 |
| 62 | Pelham | Ont. | 2.5% | 107.7 |
| 63 | Saugeen Shores | Ont. | 1.4% | 121.1 |
| 64 | St. John's | NL | 2.6% | 107.2 |
| 65 | New Glasgow | NS | 1.5% | 117.4 |
| 66 | LaSalle | Ont. | 1.8% | 112.2 |
| 67 | Woolwich | Ont. | 1.7% | 113.5 |
| 68 | Vancouver | B.C. | 5.2% | 102.7 |
| 69 | White Rock | B.C. | 4.0% | 103.7 |
| 70 | Hamilton | Ont. | 1.8% | 111 |
| 71 | Brantford | Ont. | 1.7% | 113.2 |
| 72 | Langley DM | B.C. | 2.0% | 109.2 |
| 73 | Portage la Prairie | Man. | 1.4% | 119 |
| 74 | Tay | Ont. | 1.5% | 115.8 |
| 75 | Port Hope | Ont. | 1.5% | 115.4 |
| 76 | Oro-Medonte | Ont. | 2.0% | 108.6 |
| 77 | Adjala-Tosorontio | Ont. | 1.8% | 111.5 |
| 78 | Maple Ridge DM | B.C. | 1.9% | 109.7 |
| 79 | Mount Pearl | NL | 2.0% | 108.6 |
| 80 | Pitt Meadows | B.C. | 1.8% | 110.9 |
| 81 | Mapleton | Ont. | 1.2% | 137.6 |
| 82 | Cobourg | Ont. | 1.7% | 111.8 |
| 83 | Port Alberni | B.C. | 1.4% | 118.2 |
| 84 | Foothills No. 31 | Alta. | 1.9% | 108.7 |
| 85 | West Grey | Ont. | 1.2% | 124.8 |
| 86 | Waterloo | Ont. | 2.5% | 105.4 |
| 87 | Pickering | Ont. | 2.6% | 104.9 |
| 88 | Winnipeg | Man. | 1.8% | 110.2 |
| 89 | Mountain View County | Alta. | 2.0% | 106.8 |
| 90 | Toronto | Ont. | 3.4% | 99.2 |
| 91 | Surrey | B.C. | 1.7% | 109.9 |
| 92 | Steinbach, | Man. | 1.1% | 124.1 |
| 93 | Beaconsfield | Que. | 1.7% | 110.3 |
| 94 | Norwich | Ont. | 1.1% | 142.6 |
| 95 | Yellowknife | NWT | 2.3% | 104.8 |
| 96 | Clearwater County | Alta. | 1.1% | 131.6 |
| 97 | Thunder Bay | Ont. | 1.3% | 116.9 |
| 98 | Canmore | Alta. | 3.0% | 99 |
| 99 | Kelowna | B.C. | 2.1% | 105.7 |
| 100 | West Kelowna | B.C. | 1.6% | 110.8 |