![IMPORTANT CHARTS_TILE_2[1]](/_next/image/?url=https%3A%2F%2Fmacleans.mblycdn.com%2Fuploads%2Fmac%2F2014%2F12%2FIMPORTANT-CHARTS_TILE_21.jpg&w=640&q=80)
75 charts every Canadian should watch in 2017
For the third year in a row Maclean’s asked economists, investors, analysts and financial commentators to submit what they think will be an important chart Canadians should watch in the year ahead—and they delivered, in spades. From the state of Canada’s housing market and the energy sector to government finances and how Canada will fare under Donald Trump, these 75 charts, accompanied by explanations from each contributor, will help prepare Canadians for understanding the economy in the year ahead. Here they are, in no particular order.
Enjoy!
Where’s the export recovery?
David Watt, HSBC Bank Canada.
"Export recovery! Wherefore art thou? Canadian exports are stuck in their weakest cyclical recovery in 50 years. By this stage of a recovery—eight years on from the prior cycle peak—exports are usually almost 60 per cent above the prior cycle peak. Even in weak recoveries, exports are usually up by about 30 per cent. In the current recovery, exports are just 11 per cent above the prior cycle peak. The Bank of Canada recently lowered its trajectory for export growth as it recognized that structural factors might be playing a significant role in the lacklustre recovery. Policy-makers need to give serious thought, and take significant measures to improve Canada’s export performance."
Part-time employment driving job growth
Beata Caranci, chief economist, TD Economics
"When it came to job creation, 2016 reflected quantity over quality. From a bird’s eye view, 160,000 new jobs landed on the Canadian landscape between January and November, which was more than each of the prior three years. But, from the ground, these jobs were in part-time positions. The degree of unfavourable composition between full-time and part-time typically has not occurred outside of a recession period. The labour market embodies the growth-challenge confronting Canada, as an overweight of part-time employment will depress growth in earnings and hours worked. This is a foreboding start to 2017 if demand for full-time positions doesn’t shake out of its funk."
Higher rates delayed
Scott Cameron, formerly of the Parliamentary Budget Officer, now with the Mediterranean Growth Initiative and Alma Economics. Twitter: @twitscotty
“This isn’t a charge against forecasters, who have little choice but to assume that the future will behave like the past (following a shock like the global financial crisis, forecasters typically return their interest rate outlooks to an estimate based on the ‘neutral rate’ that should prevail in calmer periods). And this pattern isn’t limited to Canada. Trying—and failing—to predict the path of rates has been a defining mark of the post-financial crisis experience in economies across the world.
But Canadian forecasters may soon be left alone to turn the lights off at the pity party. The U.S. Federal Open Market Committee, seeing much stronger fundamentals in America’s economic prospects, is likely to begin raising rates as early as its Dec. 13-14 meeting. As we conclude a ninth year of relentless revisions, it’s easy to question whether interest rates in Canada will ever lift off and fulfil expectations.”
Destined for slower growth
Doug Porter, Chief Economist, BMO Financial Group
"Somewhat overshadowed by the trauma of the global financial crisis and its aftermath, there was a critical demographic development unfolding across much of the industrialized world in recent years—including Canada. There was a sharp and pronounced slowdown in the growth of the core working age population. For instance, in the past five years in Canada, the population of those aged 15 to 64 years old has risen at a modest 0.5 per cent annual rate (and even a bit slower in the past year at 0.4 per cent). This compares with an annual growth rate that was incredibly stable and consistently above 1.1 per cent for the 25 years up to 2010. This marked slowdown in a key building block of the economy’s growth potential is sometimes overlooked because of a focus on the growth in the labour force population. While that measure is still rising a bit faster than one per cent per year, the gains are increasingly driven by those above the age 65 (i.e. the wave of the early Baby Boomers). If anything, this force will gather momentum over the next decade as the peak of the baby boom was hit in 1959-61, and those folks start retiring in massive numbers in the middle of the 2020s. Even a dramatic increase in immigration, as proposed in some quarters, is not going to turn this relentless tide."
Canada’s economy is out of balance
David Wolf, portfolio manager at Fidelity Investments
"In recent years, the Canadian economy has consisted more and more of building houses and buying stuff on credit and less and less of doing things that allow us to compete now and in the future. This chart reinforces the view that rectifying the imbalance could require material further depreciation of the Canadian dollar."
Will Alberta’s job market heal?
Trevor Tombe, assistant professor of economics, University of Calgary. Twitter:@trevortombe
"Collapsing oil prices hit Alberta hard. The past year-and-a-half has seen falling employment, rising unemployment (especially long-term), record-low consumer confidence, and a ballooning provincial deficit. Many wonder when it will end; 2017 could be the year. Various forecasts, from the Bank of Canada, the Conference Board, and more recently ATB Financial, all suggest Alberta’s recession may be over and we’ve started down the long road to recovery. The chart to watch in 2017 is of Alberta’s hopefully healing labour market."
Canada’s tax competitiveness is in trouble
Jack Mintz, Palmer Chair of Public Policy at University of Calgary. Twitter: @jackmintz
"Canada’s effective tax rate on new investment (the Marginal Effective Tax Rate) reached its lowest point at 17.5 per cent in 2012, below the average rate in the OECD and lowest in the G7. Since 2012, Canada has been increasing its taxes on investment, reaching 20 per cent in 2015 (and 20.1 per cent in 2016), which is now higher the OECD average (it is second-lowest in the G7 after Italy). With the OECD average effective tax rate continuing to decline, the U.K. reducing its corporate income tax rate from 20 to 17 per cent in the next two years, a potential major reduction in corporate taxes in United States in the coming year, the trend in Canada is starkly opposite with potential tax hikes including the carbon tax. Tax competitiveness will likely be a significant issue in the coming year."
Extreme housing, Canada style
David Doyle, Canadian Strategist at Macquarie Group
"Peak housing is here. The Canadian economy’s dependence on housing investment is equally as stretched relative to total output as it was in the U.S. at its peak in late 2005. Alarmingly, the breakdown of the contribution from subcomponents has also followed a similar path. Our chart shows the deviation that brokers’ commissions and other transfer costs (a subcomponent of residential investment) as a share of gross domestic product is from its long-run average. In Canada, this is now 3.25 standard deviations elevated, illustrating an even greater imbalance than existed in the United States in late 2005. The combination of i) the B.C. provincial government’s foreign buyers’ tax, ii) new regulatory tightening measures of the mortgage market, and iii) a recent rise in Canadian mortgage rates are likely to create headwinds for this measure in 2017 with potential significant negative ramifications for housing and the broader economic outlook."
Canada needs business investment to rebound
Pierre Cléroux, chief economist, Business Development Bank of Canada. Twitter: @PierreCleroux
"The fall in oil prices has caused a notable decline in business investment over the past two years, causing a significant slowdown in the growth of Canada’s economy. Business investment must rebound if economic growth is to accelerate. In addition, businesses must invest to improve their productivity. Doing so will help them remain competitive, domestically and internationally. Improving productivity is also essential to helping Canadians maintain our standard of living, despite the slowing growth of the labour pool caused by the aging of the population. Finally, business investment is also crucial for business growth. For all these reasons, business investment should be monitored closely in 2017."
Canada losing its edge in trade with U.S.Jock Finlayson, executive vice-president, Business Council of B.C. Twitter: @jockfinlayson
"Canada long enjoyed the status of being the No. 1 source of American imports. No more. We were overtaken by China a decade ago, and more recently by Mexico. Since 2000, Canada has lost 5.5 points of U.S. market share. In some ways the picture is even darker, for the following reason: since 2000, Canadian oil exports to the U.S. have increased sharply. Absent oil, our share of the U.S. import market would be several percentage points lower than depicted in the chart. This highlights the worrisome erosion of Canada’s competitiveness on a North American basis, with manufacturing production and capital investment, in particular, having drained out of Canada into the southern United States and Mexico over the last 15 years. It remains to be seen whether the protectionist impulses of the new American president will alter the competitive landscape for Canada and other U.S. trading partners over the balance of the decade."
Capital-intensive industries are underperforming
Benjamin Tal, deputy chief economist, CIBC World Markets
"While output for both labour and capital-intensive sectors in Canadian manufacturing fell dramatically during the recession, the damage to capital-intensive industries was notably larger. Those sectors recovered nicely since then, but production is still more than 10 per cent below pre-recession levels, and it is still lagging the performance of labour-intensive sectors. But by far, the largest underperformance of capital-intensive Canadian manufacturers was relative to their U.S. counterparts. For those capital-intensive American manufacturers, the mother of all recessions was nothing more than a blip. In fact, their production today is 12 per cent above pre-recession levels.
With capital-intensive manufacturing producers south of the border outperforming, and labour-intensive production roughly in line with what we have seen in Canada, U.S. labour productivity has gained relative ground over the cycle (despite recent softening)—rising by an annual average of 2.6 per cent since 2006—more than double the productivity gain seen in Canadian manufacturing. That productivity gap clearly worked to erode some of the benefits of a weaker dollar on relative Canadian unit labour costs."
The ambition gap in Canada’s GHG emissions
David Macdonald and Hadrian Mertins-Kirkwood, Canadian Centre for Policy Alternatives. Twitter: @DavidMacCdn and @hadrianmk
"Alberta, British Columbia and Ontario showed climate leadership in 2016 with new provincial plans to reduce greenhouse gas emissions. Alberta’s commitment to phase out coal-fired electricity generation in favour of renewables is especially important. But at risk of pooh-poohing progress, we have to point out the new measures announced in these three provinces (which critics say “go too fast”) will at best flatten our GHG emission growth , not lead to an overall reduction in Canada’s GHG emissions. That’s no small feat, given expected economic and population growth through 2030, but it also isn’t enough. As this chart shows, there is a huge gap—an ambition gap—between where we are and where we need to be to meet even our modest international commitments. With the risk of catastrophic climate change on our doorstep, this is no time to go slow on deep emissions reductions. Hopefully, new federal and provincial policies in 2017 will drive down our projected GHG emissions as governments face up to the substantial changes necessary to meet our targets."
Government net debt will continue to constrain
Michael Veall, professor, department of economics, McMaster University
"Net debt per capita of the provincial governments east of Saskatchewan is comparable to that of the federal government, as this chart by John Kealey shows. Especially in those provinces, the pressure will continue to contain expenditures on health care and education."
Will rising bond yields trigger a hard landing in housing?David Madani, senior Canadian economist, Capital Economics
"With the U.S. economy already operating close to full employment, Donald Trump’s fiscal stimulus plan might generate higher inflation rather than materially higher U.S. real economic growth. If this happens, inflation expectations would continue to rise sharply, reinforcing the upward trend in U.S. Treasury yields. Under these circumstances, Government of Canada bond yields would also climb higher, forcing domestic banks in Canada to pass on higher borrowing costs to the heavily indebted household sector. That would restrain household consumption growth and trigger, as we have long feared, a hard landing in the overvalued housing market."
Housing affordability is deterioratingLarry MacDonald, financial author. Twitter: @Larry_MacDonald
"The Bank of Canada’s Housing Affordability Index remains the indicator to watch in 2017 because if Canadians can no longer afford to own a house, it would dampen residential construction and undermine a key prop holding up the economy—not to mention possibly even endanger the financial system through rising mortgage defaults. The index, which tracks the proportion of disposable income that a representative Canadian family spends on carrying a mortgage and utilities, has indeed trended upward in recent quarters. But it remains below its long-term average, suggesting a downturn in the housing market is not imminent at the national level. Should the upward trend continue and approach the index’s peaks reached in the early 1980s and 1990s, a tumble in the housing market would be a distinct risk given how house prices cratered after those peaks occurred. "
Canada’s venture capital gap with the U.S. has widened
Mark McQueen, president and CEO, Wellington Financial. Twitter: @markrmcqueen
"If the Canadian economy is going to succeed, our country requires more early-stage risk capital. As the chart shows, Canadian entrepreneurs attract a woeful amount of venture capital as compared to their American counterparts. Despite the 2013 launch of Stephen Harper’s Venture Capital Action Plan, the per capita ratio of U.S. investment has raced ahead of our own. I’m hopeful that might start to turn around in 2017."
Watch the U.S. dollar
Mike Newton, portfolio manager, Scotia Wealth Management. Twitter: @NewtonGroupSM
“I believe we are in the early stages of a secular bull market in the U.S. dollar which began sometime in 2014-15. I am not just talking about the oft-cited benefitting factors such the ’fear-trade’ nor the political manoeuvres by Trump such as corporate repatriation and his fiscal stimulus policy. Beyond the justification of the interest-rate differentials, a real thematic rationale for current and future dollar strength is in play. Technically, the U.S. dollar could be setting up for a longer-term ’breakout’ versus a basket of global currencies including the Canadian dollar. Rising rate expectations in the U.S. have caused the greenback to rally to levels not seen since the beginning of 2015. Simply put, changing the trajectory of the policy mix in the United States toward looser fiscal and tighter monetary policy is a classic setup for an appreciating currency and especially in a global sense where the rest of the world is not on that same trajectory. This strength will have a host of knock-on effects, from making oil (priced in dollars) more expensive to the rest of the world to pressuring emerging economies that have dollar-denominated debt. All of this could, over time, act as a braking mechanism on global growth, which isn’t exactly robust at the moment. As usual, the actual outcome will fall somewhere between, but investors need to keep an eye on these developments.”
Ottawa’s share of health spending
Brian Lee Crowley, managing director, Macdonald-Laurier Institute. Twitter: @brianleecrowley
"The provinces and territories claim that Ottawa’s so-called cuts to health-care transfers will force them to ’do more with less.’ Not so. Not only have federal health-care transfers grown by half over the past decade, the current trends will see Ottawa covering nearly 40 cents of every new dollar that provincial and territorial governments put into heath care. Ottawa is doing more than its share—unless of course the provinces plan to let spending rip and want Ottawa to pick up the growing tab. What to watch for in 2017: if provinces lose control of health spending, or if Ottawa caves on unjustified provincial demands to increase federal transfers."
Fewer oil patch workers, but at the same wagesTodd Hirsch, chief economist, ATB Financial. Twitter: @ABeconomist
"Canada’s energy sector—the previous powerhouse of the national economy—has suffered tumbling prices over the last two years. Oil companies have been scrambling to get their costs down and efficiencies up, but they’re doing this not by cutting wages, but by cutting headcount. Over the last two years, total employment in resource extraction is down almost 21 per cent (most of that in Alberta). But average weekly earnings—which are the highest in the country—continue to rise. Since 2011 they’re up an astounding 17 per cent.
This tells us two things. The first is that Canada has lost a lot of very high paying jobs. That is taking a toll on the macro-economy, especially in the west. The second thing we learn is that energy companies are opting to cut staff, not wages. If you’re still employed by a Canadian oil company, you still enjoy the highest average earnings in the country."
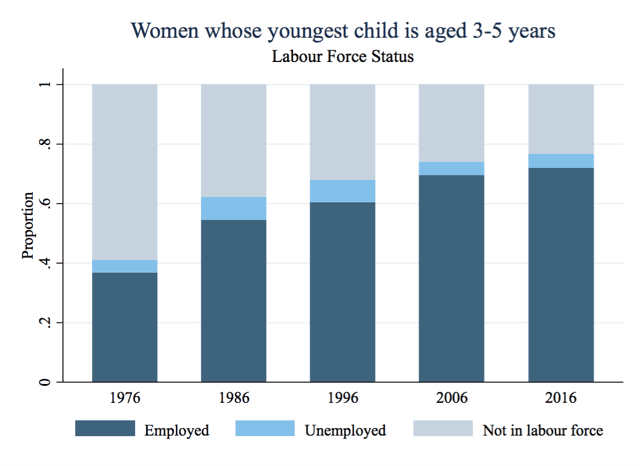
Women with young children in the labour force
Tammy Schirle, Associate Professor, Wilfrid Laurier University. Twitter: @tammyschirle
"It is difficult to describe the diverse work experience of mothers today. But it’s easy to see their experience has changed dramatically over the past 40 years. I’m thinking about how mother’s paid and unpaid work might change over the next 40 years, and what that means for policy.
Large parts of our policy framework were designed in the 1960s and ’70s, when the majority of moms with young kids stayed away from paid work. Policies like CPP were designed to support that. But today, only 23 per cent of moms with kids age 3 to 5 are out of the labour force. Many choose to stay at home in unpaid work despite good job opportunities (29 per cent have a university degree); some would have difficulty covering child care costs; others will remain out of the labour force after their children are grown. All moms want others to recognize their work is important. But when should we require transfers—as taxes or benefits—from some mothers to others?"
Housing driven by the job marketSherry Cooper, chief economist, Dominion Lending Centres. Twitter: @DrSherryCooper
"This chart shows job creation in Canada’s major cities and explains why the housing markets have been the strongest in Vancouver and Toronto and their neighbouring exurbs and cities such as Victoria and Hamilton. In addition, foreign money pouring out of China, Russia and the hard-hit cities of Europe is buying homes in these two very attractive cities. I believe housing markets in both cities will slow in 2017 owing to government restrictions and regulatory changes in the mortgage markets, which are already under upward interest rate pressure."
The burden of federal debt
Aaron Wudrick, federal director, Canadian Taxpayers Federation. Twitter: @awudrick
"We think this chart is important because it reflects the burden we are placing on future Canadian taxpayers. Even at record low interest rates, last year interest payments on our federal debt cost $26 billion—well more than we spent on national defence. Should interest rates rise, it could lead to billions more being spent on interest rather than programs and services."
Divergence in the housing market
Brendan LaCerda, economist, Moody’s Analytics
"All eyes are on house prices going into 2017. New regulations on the mortgage market are coming into effect and their potency has been the subject of much speculation. Regulators appear committed to improving affordability while also avoiding a painful correction, but significant disparities in regional house price growth complicate federal-level policy-making. To see which metro areas are speeding up and which are slowing down, this chart compares the very recent performance against a longer measure, and use the 45-degree line as a cutoff. Ontario leads the way, Quebec and the Atlantic provinces lay in the middle, while the Prairies lag the rest of the nation. Weak energy and agricultural commodities prices have taken a toll on the Alberta and Saskatchewan economies and mortgage delinquencies are on the rise. A slower than expected recovery in commodity prices also heightens the risk of out-migration, putting additional downward pressure on real estate. Also attracting notice, Vancouver has broken from the pack. Up about 24 per cent year over year, prices have now stalled. A newly imposed tax on foreign purchases diminishes the international inflows that contributed to the city’s spiralling prices. While sharp declines will be avoided, we expect the boom times are over.”
Postponing golden years
David Rosenberg, Gluskin Sheff and Associates
"If there is no retirement savings crisis in Canada, why is employment growth for the aging but not aged Boomers running at 6.5 per cent at a time when it is zero for everyone else? Answer: these folks have altered their calculations on when they can afford to leave the workforce because they need something they can’t get on their Greek cruise. In two words or less: cash flows."
Shifting gears in the housing market
Dawn Desjardins, deputy chief economist, RBC
"Canada’s housing market is going to shift gears in 2017 after four years of strong gains that pushed sales in 2016 to a record level on the back of regulatory changes enacted by both the federal and some provincial governments. One change we expect to be influential is the federal government’s decision to tighten the mortgage-insurance qualifying requirement in October. In and of itself, we expect this will cut home resales by close to eight per cent relative to our previous forecast and slow the pace of price increase by approximately 0.5 percentage points in 2017. We now expect home resales to fall by 11.5 per cent and the pace of price increase to slow to 1.6 per cent, a fraction of the 9.5 per cent jump in prices recorded in 2016. The impact will vary across the country—with the more significant effect on home resales being felt in high-priced markets in Ontario and British Columbia. There are risks that activity will be even weaker if interest rates continue to rise aggressively should the introduction of fiscal stimulus south of the border drive inflation expectations and U.S. rates up—Canadian rates may go along for the ride."
Comparing housing markets to other G8 citiesJames Price, director of capital markets products, Richardson GMP. Twitter: @JP_RGMP
"For all the talk of a housing bubble in Canada (Vancouver and Toronto, at least), it is important to note that living in any major G8 city—particularly its primary or secondary financial centre—is an expensive undertaking. We chose to add Australia to the G8 to highlight our similar resource-driven export economies, both of whom face the problem of “exporting” secondary homes to foreign buyers. While we don’t dismiss the possibility that over-leveraged households (a product of low rates) and rapid price expansion has led to overheated markets that would suffer in the face of higher rates or unemployment, the calls for crashes in housing because they are no longer affordable to the locals simply doesn’t hold. "
Will real wages keep rising? Stephen Gordon, Laval University. Twitter: @stephenfgordon
"After decades of stagnation, workers saw healthy increases in real earnings during the resource boom of the early 2000s. Wage growth has slowed since the global financial crisis, but has remained positive. If Canada has been an oasis of political stability over the past few years, this trend of broad-based increases in workers’ purchasing power is at least partially responsible. The concern is what happens next, in a world with low commodity prices, a weak Canadian dollar and heightened worries about international trade. Will real wages in Canada keep rising? And if they don’t, what will be the political fallout?"
Hidden risks for Canadian investors
Alexander MacDonald, investment analyst, Cowan Asset Management. Twitter: @alex_macdonald
"Much attention has been paid to the risks facing indebted Canadian households and their booming home prices. Some attention has been paid to the risks facing Canadian banks if these loans aren’t repaid. What’s receiving less attention, however, is how these risks could affect Canadian investors—including investors who may not be indebted, nor own a home, nor own bank shares directly in their portfolios. The S&P/TSX Composite Index, which many Canadian investment funds track, offers little diversification: the financials, energy, and materials sectors represent the majority of its companies. The weighting of these sectors within the index fluctuates with the underlying industries’ boom-and-bust cycles of profitability. Historically, when one of these sectors’ weightings set new highs, it signalled that industry’s peak profitability. As the chart illustrates, this happened with oil in 2008 and gold in 2011. Earlier this year, growth in household debt helped drive financials’ weighting to new highs. For more evidence of how reliant the average investor has become on the Canadian lenders, 55 per cent of the index’s trailing earnings are now contributed by the banks; this is just shy of the all-time high of 57 per cent."
Where Canada’s exports goPaul Boothe, managing director, Trillium Network for Advanced Manufacturing. Twitter: @pmboothe
"We are watching the level and destination of real manufacturing exports for two reasons: First, with depressed energy prices, manufacturing now has a critical role to play in supporting Canadian growth. Second, foreign markets, especially in emerging economies, are where potential sales can really grow. With heightened uncertainty around U.S. trade policy, now is the time for Canada to diversify its sales and capture a growing share of emerging market customers."
The competitive threat of higher carbon pricesLaura Dawson, director of the Canada Institute at the Wilson Center. Twitter: @DawsonCanada
"The coverage-weighted carbon price takes the carbon price set by provinces or states through carbon taxes or cap-and-trade systems and then factors in the share of total provincial/state emissions to which the marginal carbon price applies. If a province/state has a high carbon price and a broad coverage, the price tag will be higher across the board. By 2030, Alberta will have the highest carbon costs in North America. (Note: While there are many unknowns regarding implementation and the effects of new policies, the general trend is clear.)
The Canadian provinces of Alberta, B.C., Ontario, and Quebec have been early leaders in carbon pricing. Only California has similarly stringent policies. The RGGI states of Connecticut, Delaware, Maine, Maryland, Massachusetts, New Hampshire, New York, Rhode Island, and Vermont have made much more modest commitments. Out of 50 U.S. states, only the nine RGGI states plus California have instituted a carbon pricing mechanism that will have an impact similar to Canada’s on industrial production. While some industries may be able to offset the costs through investment in low-carbon technologies and offsets from governments, emissions intensive industries such as glass, steel, metals, pulp and paper and chemicals will find it more difficult to adjust. Unless carbon prices can be equalized across borders, we can expect production and investment to move from higher-priced to lower priced carbon jurisdictions."
U.S. stocks now outperforming Canadian stocks
JP Koning, Moneyness. Twitter: @jp_koning
"After a decade of underperformance, U.S. 10-year stock market returns (in Canadian dollar terms) overtook Canadian returns in 2015, a trend that continued in 2016.
Looking at the chart above, it’s worth keeping in mind that return differentials between U.S. and Canadian stocks have been quite persistent going back to the ’70s. Long-term Canadian equity returns beat U.S. returns from 1970 to the early 1980s, came short between 1982 and 2005, began to outperform in 2005, and reversed again 10 years later.
Comparative returns are affected by changes in nominal stock prices as well as fluctuations in the U.S.-Canadian exchange rate. For instance, long-term stock performance between 2005 and 2015 favoured Canadian stocks thanks to the combination of a weak U.S. dollar, which depressed the returns of U.S stocks in Canadian portfolios, and strong commodity prices, which buoyed the resource-heavy Canadian equity market. Weakness in commodity prices and a strong U.S. dollar have now led to a reversal."
Canada can’t shake off the slowth
Armine Yalnizyan, senior economist, Canadian Centre for Policy Alternatives. Twitter: @ArmineYalnizyan
"What makes an economy grow? Rising purchasing power. If people can’t buy more, businesses can’t sell more.
Historically, central banks, politicians and economists looked to rises and falls in unemployment and inflation rates to gauge the health of an economy. Now, though the United States and the United Kingdom are at “full employment” and inflation hasn’t been seen for years (except for the costs of housing and post-secondary education), the economy is far from firing on all cylinders. This phenomenon is not limited to the U.S. and the U.K. The global economy is gripped in an era of slowth (slow and slowing growth). Concern everywhere has shifted to stubbornly low, or even negative, wage growth, even though economies are not in recession. Canada is not immune to these trends.
My chart to watch for 2017 is the progression of wage growth. This chart shows growth in average hourly earnings for salaried and hourly employees, which over time has become more representative of trends in higher-earning occupations. Average growth also tends to mask important distinctions in trends for employees of different age groups. Finally, over the past decade or so, the national average has also been bolstered by strong wage growth from Alberta, a result of the rapid expansion of the energy sector. Absent this growth, we see a troubling trend.
In nominal terms, average hourly wages have grown since the recession, but flatlined for hourly employees since 2013. Adjusted for inflation, they are losing ground. Salaried employees look poised to join them.
While innovation and technology play an important role in advancing economic potential, it is difficult to achieve economic growth without growing purchasing power, given that most economies are primarily fuelled by domestic consumption. If wage-led growth becomes difficult to achieve, it will be hard to shake off slowth. "
Supply and demand drive Canada’s housing market
Will Dunning, chief economist, Mortgage Professionals Canada. Twitter: @LooseCannonEcon
"Basic economic theory tells us that prices are determined by the balance between supply and demand. This is demonstrated time after time for Canada, and its regions, by the resale housing market. Changes in the sales-to-new-listings ratio ("SNLR") do a good job of explaining variations in house price growth. For Canada as a whole, a high ratio is resulting in rapid price rises. But conditions vary across the country. A few major cities have high ratios and rapid growth of house prices. Many communities have lower ratios and slower price growth."
What Trump means for Canadian trade
George Pearkes, macro strategist, Bespoke Investment Group. Twitter: @pearkes
"With the newly elected Trump administration likely to focus acutely on trade given the available executive powers it will have without new legislation, the enormous bilateral trade relationship between the U.S. and Canada could be a source of great concern for Canadians. However, it’s important to realize that unlike many U.S. trading partners, Canada is an important export market for the United States. While the third-largest source of imports for the U.S. (12.7 per cent of total imports), over 18 per cent of U.S. exports go to Canada. While Mexico holds similar rankings, the U.S. goods trade balance with Canada is only US$5.8 billion year-to-date per the U.S. Census. That makes Canada a much lower priority for the neo-mercantilist rhetoric of the new administration. It’s also worth noting that while NAFTA has received all of the trade rhetoric within North America, Canada and the United States have an older free trade agreement (Canada-US Free Trade Agreement, 1987) that would require repeal independent of NAFTA. Therefore while countries who enjoy large trade surpluses with the U.S. have much to fear, Canada is in a relatively strong position versus other nations when it comes to potential crackups in U.S. trade relationships."
Strong evidence of problematic housing market condition
Bob Dugan, chief economist, Canada Mortgage and Housing Corp.
"There are imbalances in a number of housing markets across the country. We detect overvaluation in many markets, most notably in Toronto and Vancouver, where we also detect price acceleration. Furthermore, the upward pressure on house prices is spreading to neighbouring communities around these two centres. The vulnerabilities in the housing markets are important to monitor because they have the potential to amplify the impacts of a downturn in the economy should one occur."
Can Canada meet its emissions targets?
Andrew Leach, associate professor at the University of Alberta’s School of Business. Twitter: @andrew_leach
I’m going to pick this graph from Dave Sawyer and Chris Bataille. This chart shows that, even with present policies including the Alberta Climate Leadership Plan, the federal government still has a long way to go to meet Canada’s targets. It’s possible to meet them, as analysis by Mark Jaccard and others recently has shown, but it will require much more stringent policies than we have in place today. 2017 should be the year we see whether the government of Prime Minister Trudeau can enact the policies to bend our emissions curve and allow us to meet our targets.
The trouble with new vehicle financing
Preet Banerjee, author. Twitter: @preetbanerjee
"New vehicle loans with amortizations of five years and under are declining while extended-term loans (six years and longer) are becoming the norm. For those who are upside-down on their existing auto loans, they’ve been averaging 35 per cent negative equity for the last three years at time of trade in, which is scary in and of itself. But perhaps even more interesting, according to Robert Karwel, senior manager of automotive practice in Canada at J.D. Power, is the declining positive equity at trade-in (red dashed line in chart). This is despite the trend of consumers trading in cars with lower mileage and higher market values. This means consumers are returning to market with ever decreasing buying power and it can pretty much be completely explained by the shift to super-amortized car loans. Watch this space."
Inflation could rear its head in 2017
Barry Schwartz, Baskin Financial. Twitter: @BarrySchwartzBW
"Unlike the U.S. Federal Reserve, which has a dual mandate of maximizing employment and stabilizing prices, the Bank of Canada core focus is on controlling inflation. Inflation in Canada could start to rear its ugly head in 2017. Commodity prices have stabilized and could start to rise thanks to improving worldwide economies and cuts in global oil production. With a low Canadian dollar, Canadian importers are faced with rising prices to bring goods into Canada. Importers may have no choice but to pass on these price increase to consumers. While Canada’s inflation rate has been tame staying under two per cent for many quarters, the Bank of Canada may be forced to take action in 2017 to combat inflation risks."
Risk is building in the housing market
Kevin Page, president of the Institute of Fiscal Studies and Democracy, University of Ottawa
"Most Canadians understand from experience how important the cost of housing is to their financial well-being. Notwithstanding low mortgage rates, high and increasing housing prices in some of Canada’s major cities have received due attention. Young Canadians worry about their ability to buy into the housing market. Faced with high mortgage payments, families worry about their ability to stretch their budgets to cover essentials. Mayors are concerned about the viability and attractiveness of their cities. Policy-makers and bankers worry about the risks to the financial system and economy from abrupt changes to the housing market.
The housing affordability index is the ratio of the average quarterly mortgage payment to the average quarterly income. The higher the level of index, the more difficult it is to afford a home. The chart above shows that sharp and sustained increases in this index preceded significant economic recessions in the 1980s, 1990s and the 2008 global financial crisis (recession periods are marked). The index has been trending up over the past three years.
Risk is building. Household budgets are stretched and vulnerable to unexpected interest rate increases."
Services will lead Canada’s economy
Ian Lee, associate professor, Sprott School of Business, Carleton University
"While the Government of Canada and the Government of Ontario twist themselves into gordian knots of policy impossibility trying to ’save’ manufacturing from itself, automation and a lack of competitiveness in unit labour costs relative to the U.S. and Mexico, the Canadian economy reveals the answer is in front of our nose. The service sector has grown steadily for over 70 years since the end of the Second World War and is now becoming the engine of growth and exports for Canada."
The fear of runaway deficits and electricity prices in Ontario
Allan Gregory, professor of economics, Queen’s University. Twitter: @awg_allan
"In this chart ’Deficit’ is measured in billions of dollars and reflects the projections contained in the April 2016 Ontario Budget document. Meanwhile ’On Peak Hydro’ is a forecast of Ontario electricity prices (HOEP which includes the hours ending at 8 a.m. through 11 p.m.) in dollars per Mwh and done on behalf of Ontario Energy Board (OEB) by Navigant (April 2016). These two items are highlighted as concerns by many Ontarians who fear runaway deficits and higher electric bills. The two have a direct connection with the partial sale of Hydro One to the private sector providing additional government revenue. Attaining both of these forecasts in 2017 might require some divine intervention which can loosely be associated with miracles."
What higher bond yields mean for housing
Martin Pelletier, managing director, TriVest Wealth Counsel Ltd. Twitter: @TriVestWealth
"In our opinion, the Government of Canada bond yield is the chart that investors should keep a very close eye on in 2017. As you can see, there has been a strong correlation between the direction of bond rates and Canadian housing prices, which makes sense given the Canadian banks base their mortgage rates primarily on the bond market taking a spread between their lending and borrowing rates.
The problem is that the U.S. bond market collapsed immediately following Trump’s presidential win, and Canadian bonds followed suit with the five-year government of Canada bond yield nearly doubling from its June lows. Canadian banks quickly reacted with the Royal Bank of Canada and the TD Bank immediately raising some of their mortgage rates.
Overall, this is not a favourable development for the Canadian economy, which is heavily reliant on the debt-heavy, spending-friendly consumer and a robust housing market that combined has more than offset the impact from falling oil prices. In particular, Canadian household debt has now exceeded the size of its economy for the first time in history and according to TD Bank, the real estate market represents over half of the country’s GDP growth.
Therefore, higher borrowing costs is the last thing the economy needs at the moment."
The lag in infrastructure spending
Randall Bartlett, chief economist, Institute of Fiscal Studies and Democracy, University of Ottawa. Twitter: @Randall_Bartlet
"According to Infrastructure Canada, since the Budget Implementation Act 2016, No. 1, was passed on June 13, 2016, the Government of Canada has approved nearly $4.3 billion in infrastructure spending. This is a hefty sum by any measure, already outpacing the amount of infrastructure spending approved by the federal government over the same period in 2009—when the Canadian economy was in much more dire straits than it is today. However, very little of this money looks to have made its way into actual construction activity. But this should come as no surprise. In 2009, it took roughly half a year for construction on federally supported projects to begin after the funds were approved, and there is no reason to think that this time would be different. History suggests that much of the near-term impact will be concentrated in 2017 and 2018, with 2016 seeing little boost. This spells trouble for the messaging of both the federal government and Bank of Canada, the latter institution having adopted the Department of Finance’s economic impact forecasts without caveat. Does the resulting weaker-than-expected growth therefore mean a rate cut is likely in the not-too-distant future? Probably not. Instead, one should anticipate more mixed messages, and metaphors, from the Bank of Canada to explain the result."
New leaders address slow growth in the G7
Philip Cross, former chief economic analyst at Statistics Canada, senior fellow at the Macdonald-Laurier Institute
"A wave of new G7 leaders took power as the global recession began in 2007, promising to fix what ailed the economy. Instead, average annual real GDP growth in the G7 has languished at 0.9 per cent over the past decade, compared with 2.4 per cent before the crisis (which is the straight line in the graph). Not surprisingly, most of these leaders (Barack Obama, David Cameron, Stephen Harper, Silvio Berlusconi, inevitably François Hollande, and possibly even Angela Merkel) or their parties are being replaced by a new generation of leaders who promise to reignite growth. Time will tell if the new crop have found the elixir for faster growth in policies ranging from larger budget deficits to trade restrictions and less regulation, especially since some will be doing the opposite of what others are trying to achieve."
Rising mortgage rates will squeeze some households
Brett House, deputy chief economist, Scotiabank. Twitter: @BrettEHouse
"The ratio of Canadian household debt stocks to personal disposable income, now at about 168 per cent, has set a new record nearly every quarter in recent years. Concern about Canadians’ stretched balance sheets has been muted, however, by the dampening effect of low interest rates on the cost of servicing this debt. Low rates have mainly reduced interest payments on relatively long-term mortgage debt, but they haven’t had much impact on the burden of staying current on shorter-term borrowing, such as credit cards and auto loans, which has generated more than half of Canadians’ debt-service payments since the 1990s. Total debt-service payments are already near historically high levels compared with personal disposable income, as shown in the chart above. With mortgage rates on the rise, households will find it tougher to stay up to date on their borrowing obligations without dipping into their savings. Fortunately, this cushion has been boosted a bit by robust financial markets, the rise in the value of foreign holdings provided by the weaker loonie, and strong home prices, which have together contained the ratios of household debt both to total assets and to total net worth. Taken as a whole, Canadians can manage an increase in interest rates, but individual households that lack liquid savings may find themselves increasingly squeezed."
M&A and the collapse of business investment
Jordan Brennan, Unifor Economist. Twitter: @JordanPWBrennan
"On account of its close association with job creation and productivity improvement, fixed asset investment is perhaps the key determinant of economic growth. Economists have been puzzled why the investment share of national income (broken line) has contracted in recent decades despite ostensibly pro-business policies such as corporate income tax cuts and trade liberalization. It turns out that Canada does not suffer from a shortage of investment; instead, resources have been diverted from job-creating industrial expansion in favour of mergers and acquisitions (solid line), and the latter is wholly redistributive in its implications. The explosion of M&A since 1990 has indirectly depressed GDP growth, but it has also fuelled income inequality. Sustained periods of M&A lead to concentrated market structures, enhanced market power and enlarged earnings. The historically unprecedented concentration of income among large firms has translated into soaring payouts to executives (salaries and stock options) and to shareholders (dividends and stock repurchase). In this manner, elevated M&A simultaneously slows growth and exacerbates inequality. Furthermore, major merger waves have always ended in a great crash, which is why the relative scale of merger activity in 2015 should concern us. Comparable levels were seen in 1928, 1999 and 2007; dates which are infamous for preceding the Great Depression, the Tech Wreck and the Great Recession, respectively. Let’s hope the current merger wave has a more cheerful ending."
New U.S. tariffs would hurt Canadian and American workers
Danielle Goldfarb, director of the Conference Board of Canada’s Global Commerce Centre. Twitter: @DIGoldfarb
"With Donald Trump’s election, Canada’s longstanding and hard-earned access to the world’s largest market is under serious threat. New tariffs, increased U.S. requirements to buy only American products and services, and the possible pull back of NAFTA are just some of the measures that could negatively impact Canadian living standards and global economic stability. But the impact on U.S. economic interests would also be devastating. This graphic from Washington’s Peterson Institute shows the impact president-elect Trump’s trade policies could have on American workers and U.S. economic interests. Since Canadians and Americans essentially make things together in a shared supply chain, imposing trade barriers on Canada in particular would also lead to U.S. job loss. Trump’s priority is American jobs, so Canada’s best chance to defend its interests will be to ensure that American businesses and workers aggressively lobby their representatives to ensure these measures do not come to pass."
The danger in non-G.A.A.P. financial reporting
Anthony Scilipoti, CEO, Veritas Investment Research
"The number of companies reporting non-GAAP (generally accepted accounting principles) earnings is on the rise. It is wreaking havoc on analyst’s investment models, and investors’ confidence in financial reporting. A number of class actions are under way that allege the problems with non-GAAP measures. Canada is getting worse than the U.S. "
Protectionism on the rise
Paul Kedrosky, venture capitalist, financial commentator. Twitter: @pkedrosky
"I am expecting a wave of trade protectionism worldwide in 2016, and I’m expecting the U.S. to reappear on this graph after decades of broad tariff reduction. As a technology investor, I am particularly focused on what happens to the fraught relationship between China and the U.S., with new tariffs on U.S. imports from China likely to be hit by countervailing ones. Canada, as a largely open economy, could easily become a drive-by victim of retaliatory tariffs, much like the U.S. technology sector. Both Canada and U.S. tech getting waxed because of a Trump administration fondness for protecting, say, U.S. furniture manufacturers against their Chinese counterparts, would be true 2017 economic ignominy. "
Will sole-business owners start to hire?
Ted Mallett, chief economist, Canadian Federation of Independent Business. Twitter: @cfibeconomics
"Tomorrow’s jobs will come from tomorrow’s employers. Growth in the number of incorporated self-employed employers has only been modest, averaging only 1.3 per cent per year since 2000. Half of that came from only two sectors: construction and health care. During the same period, the numbers of self-employed on their own have grown 4.3 per cent per year, almost doubling their numbers. For 2017, we wonder if the economic and policy environment will be more encouraging for sole business owners to hire help for the first time."
Canada needs Alberta business investment to recover
Mark Milke, Calgary author, columnist and keynote speaker. Twitter: @MilkeMark
"This chart tracks private sector investment in non-residential structures, machinery and equipment—in essence, business investment in the ’stuff’ needed to operate. It includes everything from investments in Alberta’s oil sands to an automotive factory in Ontario or a mine or warehousing facility in Quebec.
The chart shows a dramatic drop-off in private sector investment in Alberta between 2014 and 2015, a drop of 25 per cent or $20 billion. It came in response to the steep decline in oil prices between those two years. Forecasts for Alberta for 2016 estimate a continuing decline.
The Alberta numbers matter because for years, private sector business investment in Alberta helped drive the Canadian economy ahead, more so than any other province. Relative to its population, Alberta in most years provided an outsized share of Canada’s new jobs and thus recorded the lowest annual average unemployment rate and despite the highest participation rate. Alberta was the only province where workers without a high school education faced unemployment rates in the single digits. Alberta recorded all such numbers despite massive in-migration. Alberta’s recovery of such business investment thus matters to the Canadian economy at large and to job-seekers across the country."
Canada’s gig workers
Linda Nazareth, RelentlessEconomics.com. Twitter:@relentlesseco
"Here is the graph I would like to show you: the number of gig workers in Canada. I know they are there. More and more, Canadians do not have long-term, single-employer jobs but rather move from gig to gig, sometimes juggling several at the same time. The trouble is, gig work as a reality is pretty new to all of us, so neither Statistics Canada nor anyone else tracks how many gig workers there are out there. So since there is some overlap between gig workers and the self-employed, I have settled for showing a graph of the self-employed. Interestingly, the percentage of Canadians in this category has really not changed much over the past few years, although it did get a bump during the downturn in 2008-09, although not as big as it did during the recession of 2000.
There are other gig workers. Some pick up one contract after another with maybe some involuntary unemployment in-between, others are contract workers who drive for Uber on the side or fiftysomethings who take on work at their old employers occasionally, but who are not employees. All may be simply counted as ‘working’ when they have a job, and ‘unemployed’ when they are looking for one. We do not have a good count of how many there are but we should: gig work is the way of the future and will affect everything from government policy to how banks lend money. The first step in dealing with this new reality means knowing how many people are already immersed in it."
Will the OPEC oil deal hold?
Mike Moffatt, assistant professor, Ivey Business School. Twitter: @MikePMoffatt
"Now that OPEC has reached a deal to cut oil production, the real test begins: Can the various players abide by it? Will OPEC respond to president-elect Trump’s vows to achieve energy independence by keeping supply levels high, and prices low, in order to deter the U.S. from increasing production? Should OPEC keep the taps turned on, expect WTI to plunge well under $40. Given Canada’s reliance on oil exports, and the relationship between oil prices and the loonie, we need to keep our attention focused on OPEC."
A low dollar may not help Canadian manufacturing
Livio Di Matteo, professor of economics, Lakehead University
"A high Canadian dollar is often blamed for Canada’s manufacturing malaise and with its recent depreciation there is hope that a renaissance will be sparked in Canadian manufacturing. The long-term evidence suggests otherwise. While Canada’s manufacturing output per capita has grown in the long term, manufacturing’s share of national output has fallen quite steadily from 27 per cent in 1950 to 11 per cent today. Our dollar in terms of its exchange rate with the U.S. dollar (our major trading partner) was relatively stable from 1950 to the late 1970s, and then began depreciating from the mid 1970s to the early 2000s. It then appreciated again during the commodity boom of the 21st century and has been depreciating recently. Fluctuations in our currency’s value (relative to the U.S. dollar) may have some short-term effects on manufacturing production. The period from the late 1970s to the early 1990s does seem to have seen some stabilization of the share of manufacturing in our GDP. However, Canada’s manufacturing decline is rooted in long-term economic factors such as productivity growth—which slowed substantially after 2000—and the trend of developed economies around the world toward service production."
The interest rate gap between Canada and the U.S.
Craig Wright, chief economist, RBC
"The great monetary experiment continues in 2017, posing risks for Canadian financial markets. We have never seen so many central banks so accommodative for such a long period of time. Currently economies representing 25 per cent of the global economy are operating with negative overnight interest rates. The U.S. Fed is poised to move more aggressively against this trend of central bank accommodation with at least a couple of rate hikes expected in 2017 and risks to the upside if the new administration moves significantly down the tax cut path. In contrast the Bank of Canada is expected to keep overnight interest rates unchanged this year, leading to a widening in the gap between overnight interest rates in the two economies and posing some risks for the Canadian dollar and longer-term interest rates. This divergence in monetary policy will grab the attention of the media and markets alike as they assess how desirable and sustainable such a gap is between these two large trading partners."
Could we see a national housing market correction?
Hilliard MacBeth, author of "When the Bubble Bursts: Surviving the Canadian Real Estate Crash". Twitter: @hmacbe
"2017 may see house prices correcting on a national basis due to a potential increase in interest rates and regulatory moves tightening available credit. After-tax household income lags well behind the rapid pace of growth in household debt and house prices, stretching affordability to the breaking point."
An increasingly weak loonie
François Dupuis, chief economist, Desjardins
"The U.S. economy should accelerate in 2017, encouraging the Federal Reserve to go ahead with monetary firming. Widening interest rate spreads between Canada and the United States will hurt the Canadian dollar, however. Higher oil prices could partially compensate for and limit the loonie’s depreciation. That being said, the persisting surplus in oil production means we cannot look for a strong rise there. Lastly, further divergence between the U.S. and Canadian economies in favour of the U.S. in 2017 should have a hand in taking the Canadian dollar down toward US$0.70."
Canada will require strong trade diplomacy
Derek Holt, vice-president of economics, Scotiabank
"What matters most to Canada is how U.S. trade policy will evolve over time and we’re in the very early innings. The potential rise of U.S. protectionism would occur in the years well beyond just the first 100 days of a new Trump administration due to forces that have already been put in motion by markets. Indeed, the U.S. trade deficit may soon grow to a record due to the strong U.S. dollar, given a three- to four-year lag from when the dollar’s appreciation—that began a couple of years ago—begins to have maximum negative impact. This could well unfold in the run-up to the next U.S. mid-term and presidential elections and risk an increasingly protectionist Republican-controlled U.S. Congress as the greenback approaches a 15-year high. Canada is better positioned than other countries to manage this risk, but it is unlikely to be immune and will need every ounce of its negotiating and diplomatic skills in order to contain the risks."
The cost of cleaning up the oil sands
Frances Woolley, professor of economics, Carleton University. Twitter: @franceswoolley
"Resource extraction is profitable. Cleaning up the mess it makes is not. In the past, owners have often walked away from their operations, leaving others to pay the clean-up bill. The Sydney Tar Ponds show how expensive that clean-up can be. Although the Sydney site totalled just over 100 hectares, the 2004-14 clean-up operations cost federal and Nova Scotia taxpayers $400 million—about $4 million per hectare.
Alberta’s oil sands are hundreds of times bigger than the Sydney Tar Ponds. To pre-commit companies to paying for the eventual costs of reclaiming oil sands sites, the Alberta government has created a “Mine Financial Security Program.” Companies wishing to mine the oil sands must post a base amount of security for each project. In theory, they could be required to post additional securities. In practice that never happens.
Right now there is $939 million deposited into the Mine Financial Security Program. That’s about $43,000 for each hectare of tailing ponds in the oil sands. The total deposits in the Mine Financial Security program would fund two Sydney Tar Pond-size clean-ups. Unsurprisingly, the auditor general of Alberta is concerned this amount is inadequate. Suncor is the largest operator in the oil sands. In the first three quarters of 2016, it produced 1.4 million barrels from its oil sands operations. Its total cash flow was $3.6 billion. Its net new contributions to the Mine Financial Security Program? Zero."
The income tax system and low-income households
Jennifer Robson, assistant professor of political management, Carleton University. Twitter: @JenniferRobson8
"Last year, my graph was an illustration of the precariousness of household balance sheets for low and modest-income households. This year, I want to flag the importance of the income tax system for those same households because it’s an important part of their financial lives. Filing a return (in a tax system that is far too complicated, by the way) is an essential step before governments will pay out many income-tested benefits. The federal government has promised to expand community tax-clinics and make access to benefits easier. There are also several community organizations who are doing terrific work in this area. But there’s much more to do to make sure that Canadians are actually getting the statutory benefits that are meant to make lives better."
The size of government in Canada on the rise
Charles Lammam, director of fiscal studies, Fraser Institute. Twitter: @CharlesLammam
"The size of government in Canada, measured by total spending as a percentage of gross domestic product (GDP), is on the rise—a worrying trend because the evidence shows it may lead to lower levels of economic growth and social progress. We need government to provide important public services, critical to a well-functioning economy. But there’s a point when a larger, more interventionist government, combined with a heavier tax burden, can stunt economic growth and social outcomes (better health, improved education, lower crime, etc.), or achieve those outcomes only at great additional cost. For instance, government spending becomes unproductive for the average Canadian when it goes to special subsidies for businesses, otherwise known as “corporate welfare.” So what’s the right size of government? Research shows that economic growth and social outcomes generally improve as government spending increases to between 26 per cent and 30 per cent of GDP. Once spending surpasses 30 per cent of GDP, economic growth declines. In Canada, total government spending is now much higher than what empirical evidence shows to be optimal—more than 40 per cent of GDP and growing."
The federal government’s effective interest rate and GDP growth
Stephen Tapp, research director, Institute for Research on Public Policy. Twitter: @stephen_tapp
"In 2017 and beyond, keep an eye on economic growth (g), the effective interest rate (r), and the difference between the two. Both series have fallen steadily in recent decades reflecting factors such as population aging and weaker productivity. The fact that r has fallen more than g since the 1990s helps government finances and alters the preferred macroeconomic policy approach to stimulate growth. The Bank of Canada now has less room to provide traditional monetary stimulus, due to already-low interest rates, a lower “neutral” rate, and limited responsiveness of business investment. At the same time, cheaper borrowing and weak growth prospects give Ottawa an incentive to ratchet up infrastructure spending, which it is doing. The unusual and more benign g>r dynamic that’s forecast over the Liberals’ mandate would make it easier to reduce the debt-to-GDP ratio (unlike the unforgiving r>g headwinds that precipitated our 1990s fiscal crisis). But ultimately the government’s re-election chances hinge less on maintaining fiscal sustainability, and more on whether GDP growth accelerates before the next election and delivers gains that are broadly shared."
The Toronto and Vancouver housing markets
Sal Guatieri, senior economist, BMO Capital Markets
"Keep an eye on this chart because it could signal whether the two hottest housing markets of recent years—Vancouver and Toronto—are merely simmering down in the face of tougher mortgage rules, or are cooling rapidly because of the additional weight of weak affordability. There’s also a third possibility: after slowing briefly, both markets could re-accelerate amid still-low interest rates and an influx of foreign wealth, which was the pattern after prior rule changes. This could set the stage for a correction if either region slips into recession or interest rates rise materially."
Trump isn’t a big risk for Canada
Mathieu Savary, managing editor, BCA Research
"The Canadian dollar has greatly suffered in the wake of Trump’s electoral victory. Much of that underperformance reflects worries about NAFTA, and the risk to Canadian exports represented by a potentially protectionist U.S. president. Are these fears warranted?
The risk to the Canadian economy is overplayed. For one, the economic gains from globalization have been exaggerated. As Paul Krugman highlighted, commonly used academic models suggest that only five per cent of the increase in global GDP since 1990 is linked to greater trade. Additionally, as the chart shows, since the early 1980s, Canadian export growth has been far from exceptional. Finally, the likelihood that Trump’s aggressive trade tactics will be aimed at Canada is low. Cancelling NAFTA requires an act from Congress. Moreover, the real targets of Trump are Asian economies that have reaped outsize benefits from trade. They suffer a much greater risk of being at the receiving end of tariffs. For Canada, small battles over already existing issues like soft-wood lumbers may resume. But, unhampered by politics, overall Canadian non-oil exports should benefit from a cheap Canadian dollar and stronger U.S. final demand."
Gasoline demand in Alberta after the carbon tax
Joel Wood, assistant professor, School of Business and Economics at Thompson Rivers University. Twitter: @JoelWWood
"As shown in the figure, drivers in Alberta consume a relatively higher amount of gasoline per person than their counterparts in other Canadian provinces. Alberta is set to levy a carbon tax of $20 per tonne of carbon dioxide (4.49 cents a litre on gasoline) on Jan. 1, 2017. British Columbia implemented a carbon tax in July 2008 of $10/tonne increasing annually until reaching the current rate of $30/tonne in July 2012. Economists (here and here) have studied the impact of the B.C. tax on gasoline demand and found that the tax has had a larger impact than what would be expected from a similar market based increase in the price of gas. They attribute this difference to taxes being more salient (i.e., more visible) and more permanent in the minds of consumers. After the Alberta carbon tax is implemented on Jan. 1, it will be interesting to see if gas-guzzling Albertans show a similar response to that of their fuel-sipping B.C. neighbours."
Going the wrong way on investment in machinery and equipment
Craig Alexander, chief economist, forecasting and analysis, Conference Board of Canada. Twitter: @CraigA_Eco
"Business investment on machinery and equipment (M&E) in Canada has been a source of serial disappointment in recent years, but even worse is the fact that the pace of investment shown in the accompanying chart is not even keeping up with the rate of depreciation. This worrying trend means that Canada’s capital stock is declining. Economies grow either because they have more workers or they use their workers more productively. Given the aging of the Canadian population, productivity will be ever more important as a source for growth and a rising standard of living. One way to boost productivity is to increase the amount of capital per worker. But Canada is going the wrong direction. The decline in machinery and equipment investment in volume terms (removing the impact of prices) in the energy sector is not surprising as it reflects the adjustment to the lower oil price environment. However, the weakness in the volume of machinery and equipment investment in the non-energy sector is troubling and is leading the Conference Board of Canada to lower Canada’s medium-term growth projections. Note that Canada had a severe recession in the early 1990s, but real business investment in M&E was only slightly below the rate of the deprecation in 1992-93. In the wake of the collapse of the tech bubble in 2001, M&E investment also weakened. But, these experiences pale in comparison to the deep decline in 2009 and the last four years when M&E investment has not kept pace with depreciation. With Canadian economic fortunes poised to improve in 2017 and 2018, it will be critical for business investment to reverse course."
Trump could speed up Canada’s industrial decline
Rob Gillezeau, assistant professor of economics, University of Victoria. Twitter: @robgillezeau
“Life hasn’t been easy for workers in Canada’s industrial heartland in the years since the Great Recession. Even with a substantial depreciation in the Canadian dollar, the positions that disappeared during the crisis have failed to return. However, the election of Donald J. Trump and the Republican sweep of the United States Congress could drastically increase the rate of Canada’s industrial decline. Republicans will likely move to introduce national “right-to-work” legislation, which will financially cripple America’s remaining private sector unions and result in a rapid decline in union density. This will open the gap in manufacturing union coverage between Canada and the U.S. Rust Belt to unprecedented levels, which will substantially reduce the relative wages and benefits of American workers. Depending on the scale of this compensation shock, there could be more plant closures in southern Ontario as firms flock south of the border. This impact may be delayed if weakness in the Canadian dollar persists, but even a weak dollar may be insufficient to account for declining labour costs in the American Rust Belt. Canadian provincial and federal governments have struggled to cope with the existing pace of industrial decline, making the prospect of an increased rate of deindustrialization particularly concerning.”
The intergenerational cycle of low incomes
Miles Corak, professor of economics, University of Ottawa. Twitter: @MilesCorak
"This figure shows the rankings of children from low-income Canadian families, what fraction stand on each of the 100 rungs defined to equally divide the population across their adult income distribution. Their parents stood on exactly the bottom fifth rung of their income ladder, and the likelihood of them not advancing very much or even falling lower is clearly evident.
If adult incomes were completely independent of family income background, then we would expect one per cent of these children to be on each of the 100 divisions of their income distribution. If this were the case children of low-ranking parents would be as likely to rise to middle incomes, or even to the very top, as they would be to stay on the same rung as their parents, or fall lower.
But in fact, this cohort of Canadians (those born in the 1960s) are much more likely to be the low-ranking adults of the next generation and are more likely to repeat the experiences of their parents.
This inter-generational cycle of low-income is more likely for boys. Although there is considerable upward rank mobility among these children, men raised by parents who were outranked by 95 per cent of their counterparts are most likely to fall even lower, to be outranked by 99 per cent of their cohort. Their chances of falling to the bottom one per cent are more than four per cent."
Canada facing record-low wage growth
Toby Sanger, senior economist, Canadian Union of Public Employees. Twitter: @toby_sanger
There was a time in the not-too-distant past when workers received real wage increases—and economic growth was stronger. But not now. Wages in terms of average hourly earnings are on track to increase by an average of just 0.8 per cent in 2016. This would be the lowest in 80 years—since Statistics Canada’s records start in 1935. Other wage measures may not show such record lows, but they’re below longer-term averages. And it’s not just Alberta: wage increases in most other provinces are also well-below longer-term averages.
We’re also suffering from serially disappointingly slow economic growth. We’ve had monetary stimulus in the form of record-low interest rates, but that’s led to perilously high household debt ratios. Fiscal stimulus has helped but its been narrowly focused on infrastructure spending while governments have practiced austerity and frozen wages elsewhere. Thanks to business tax cuts and low wage increases, Canadian corporations have over $700 billion in excess cash they’re not going to invest it unless there’s increased demand. With wages, salaries and other worker compensation amounting to more than half of our national income and household spending two-thirds of our GDP, we’re not going to get stronger economic growth unless workers finally receive the decent wage increases they deserve.
Canadian housing is still hot
Arlene Kish, senior principal economist, IHS Markit Economics
"Housing has been one of the hottest sectors in Canada’s economy and strong domestic and foreign demand has resulted in skyrocketing prices, not just in Vancouver and Toronto, but in surrounding cities as well, driven up mostly by single-family home price jumps. Lack of new home supply doesn’t help either. Looking at recent trends, single-family housing starts are about 20 per cent below long-term averages while multiple-family housing starts are up nearly 50 per cent above the long-term average. Thanks to the drop in oil prices since mid-2014, housing starts in the energy-producing provinces of Alberta, Saskatchewan and Newfoundland have declined steadily. Only recently they are beginning to creep higher. Meanwhile, Ontario housing starts have trended higher and are approaching the post-Great Recession peak. Starts in the rest of Canada are solid as well. The gradual recovery in oil prices should help boost starts in the energy-producing provinces. Therefore, with interest rates expected to stay relatively low, housing will be a stalwart driver of economic growth in 2017."
Does Trumpism have a base in Canada?
Jim Stanford, economist and director, Centre for Future Work at the Australia Institute. Twitter: @JimboStanford
"The pundits and pollsters will be trying to understand Donald Trump’s shock victory for years to come. But they agree on one point: he was propelled to victory (especially in key battleground seats) by anger and desire for change among a segment of society that’s faced dislocation and underemployment for many years. Thanks to forces of deindustrialization, globalization, deunionization, and the concentration of most new jobs in big coastal cities, the ’middle class dream’ has been snatched away from a substantial share of the population who could once reasonably aspire to it.
Is there a similar base for an anti-establishment backlash in Canada? Yes there is: but Canada’s regional diversity, not to mention our stronger public sector and welfare state, help to dilute and salve the resulting hardship. My graph portrays the loss of jobs in traditional ’blue-collar’ industries since 2001 (resources, manufacturing, construction, and utilities), measured as a share of initial employment in the total economy. Across the U.S. that dislocation totalled more than three workers in 100 over the past 15 years. In the four key Rust Belt states that turned from blue to red and pushed Trump over the top (Michigan, Ohio, Pennsylvania, and Wisconsin), it was more than five in 100. There are hard-hit regions in Canada that have also lost many once-well-paid, goods-producing jobs: New Brunswick has been hardest hit (losing 3.8 industrial jobs from every 100 total jobs that existed in 2001). But the West and Newfoundland have added industrial jobs, and for Canada as a whole there’s been very little net absolute job loss in goods-producing sectors (net manufacturing job losses have been offset by new jobs in construction and resources).
But Canadians can’t be too smug: within sub-provincial regions (like southwestern Ontario) industrial job losses have been very acute. And with resource jobs now disappearing in the oil-producing provinces, the potential for backlash (whether right or left) can’t be discounted, without ambitious policies to cushion the losses of these workers, and create new jobs for them to go to."
Full-time job growth has been anemic for ’prime-age’ Canadians
Jamie Carson, former Statistics Canada economist. Twitter: @carsjam33
"Full-time job growth has been minimal for ’prime-age’ Canadians—those between 25 and 54 years old. In the last recession, employment bottomed out in June 2009, so we indexed our data to that month. Almost seven-and-a-half years later, we find that females have seen a total increase of 5.3 per cent in full-time jobs, and males have only gained 3.4 per cent. In fact, full-time job growth for men is essentially unchanged since 2012. Employment rates are up slightly and participation rates are down ever so slightly in the same period, leading to the anemic growth. Part-time trends do not explain the full-time numbers: Part-time employment growth for men was 16.7 per cent over the period, but much of that has only come since June 2016, prior to which there had been no growth from 2009. For women, part-time employment has declined from June 2009 levels. The part-time data movements are quite volatile from month to month, and have been left out of the chart to better focus on the full-time trends."
The household effective interest rate is likely to rise
Ben Rabidoux, president of North Cove Advisors Inc. Twitter:@BenRabidoux
"Regulatory changes forcing lenders and mortgage insurers to hold more capital starting next year, coupled with the recent backup in bond yields argue that mortgage rates have likely bottomed in Canada barring unconventional monetary policy from the Bank of Canada. Household debt service ratios remain elevated even as the effective interest rate they pay is at a record low and likely to begin rising. Expect this to weigh on consumption and housing demand starting in 2017."
Nothing surprising about Canada’s lackluster exports
Luke Kawa, Bloomberg Markets
The Canadian dollar has depreciated meaningfully relative to the greenback since oil prices began to hit the skids, but export volumes have gone nowhere since mid-2014. The lacklustre performance of Canadian real exports isn’t what’s confusing or curious—it’s that U.S. real imports have flatlined despite a sizable, broad-based rally in the U.S. dollar (which would tend to encourage Americans to buy more foreign goods). The chart shows that Canadian export volumes have largely been tracking U.S. real imports throughout this cycle. In other words, it’s not our fault!
In the end, it all goes back to something Bank of Canada governor Stephen Poloz once quipped: a lower currency is icing on the cake, but strong foreign demand, that’s the cake itself. Hopefully, that cake is just about ready to come out of the oven. If the U.S. inventory correction cycle has ended and business investment stateside starts to accelerate in the context of full employment, Canadian southbound shipments would be in a far better position to pick up some steam. Of course, any moves by the incoming Trump administration that hamper our exporters’ ability to cash in on rising demand in the world’s largest economy could throw a wrench in this relationship.
Tracking global demand for bulk ’stuff’
Finn Poschmann, president and CEO, Atlantic Provinces Economic Council
"There’s not much of the world, and not much of Canada, that doesn’t depend on trade in ’stuff.’ And Canada sells a lot of heavy stuff. Like coal, ores, nickel and other metals, and grains. Over 2015-16 we’ll have sent about 31 million tonnes of grain to places other than the U.S. And that doesn’t count lentils, mostly to India. Or peas—we will be shipping about a kilo of peas per Indian this year. And if you want to know what is the global state of demand and supply for bulk ’stuff,’ the Baltic Dry is your index. What’s cool about the Dry is that it is an instantaneous measure of demand and supply pressures. There isn’t much market optimism or pessimism in it, and no real expectations embodied. By contrast, look at the daily lease rate for a Very Large Crude Carrier—it starts spiralling up whenever the Brent futures market starts showing serious contango six months to a year out (which is a lot of fun if you happen to own a VLCC at the time). The Dry can be blown off course now and then, owing to the long lag in getting bulk carriers on and off the market, and it is slightly correlated with bunker fuel costs, but its instantaneous slope says a lot about the state of the world. And it has been sending a pretty happy message since summer 2016."
The explosion in Canadian private debt
Jason Kirby, business editor, Maclean’s
"This chart, drawn from a database maintained by the Bank for International Settlements, shows the combined debt levels of non-financial corporations and households as a percentage of national GDP, for both Canada (the red line) and the United States (the blue line). As is clear, the gap between the ratio for those two countries has never been wider, a result of the post-recession deleveraging in the U.S. and the borrowing binge undertaken by Canadian households and businesses. The differential between the two countries’ ratios is shown by the bar graph. Several decades of history suggests that a gap this wide will not go on forever. So how will the gap close? Will U.S. households and businesses now gorge themselves on debt? Will Canada undergo a massive deleveraging (either through a surge in GDP or outright credit contraction). Or will we see some combination of both, where Canadian credit growth stagnates for years while the U.S. slowly catches up? Whatever the case, the days are numbered for Canada’s debt boom.
Jason Kirby is a Toronto-based editor and journalist. Follow him on Twitter: @jason_kirby
Related Posts

The ’safe bets’ and ’wild cards’ needed to meet Canada’s net zero emissions target

The working class has had enough

Capitalism’s connection to our ever-worsening mental health

Mark Carney sits down with Paul Wells: Maclean’s in Conversation
Get the Best of Maclean’s straight to your inbox.
Sign up for news, commentary and analysis. Join 60,000+ Canadian readers.