Canadian employment: this is getting ugly
We’ll know soon enough if another mistake has been made, but the new jobs report fits with the slump that’s been underway for months
(Shutterstock)
Share

When the latest employment figures from Statistics Canada hit like a ton of bricks this morning—the number of private sector jobs fell by 112,000 in August, resulting in an overall drop in employment of 11,000—the obvious first thought was: Should there be an asterisk on that?
It was, after all, only last month when the agency botched the July jobs report, erroneously claiming the economy added just 200 new jobs, when it fact the figure was 42,000. Scotiabank economist Derek Holt was quick to warn the report “looks very fishy to me.” (It’s always telling when a bank economist titles his analysis: “Really?!!”)
We’ll know soon enough if another mistake has been made, but even if the employment report for August didn’t fit with what economists were expecting, it’s hardly out of line with what the Canadian economy has experienced in recent months. There have not been two consecutive months of net new job growth since October 2013. And, as this chart showing the 12-month change in employment reveals*, these new jobs figures are just part of a slowing trend that’s been underway since January 2013.
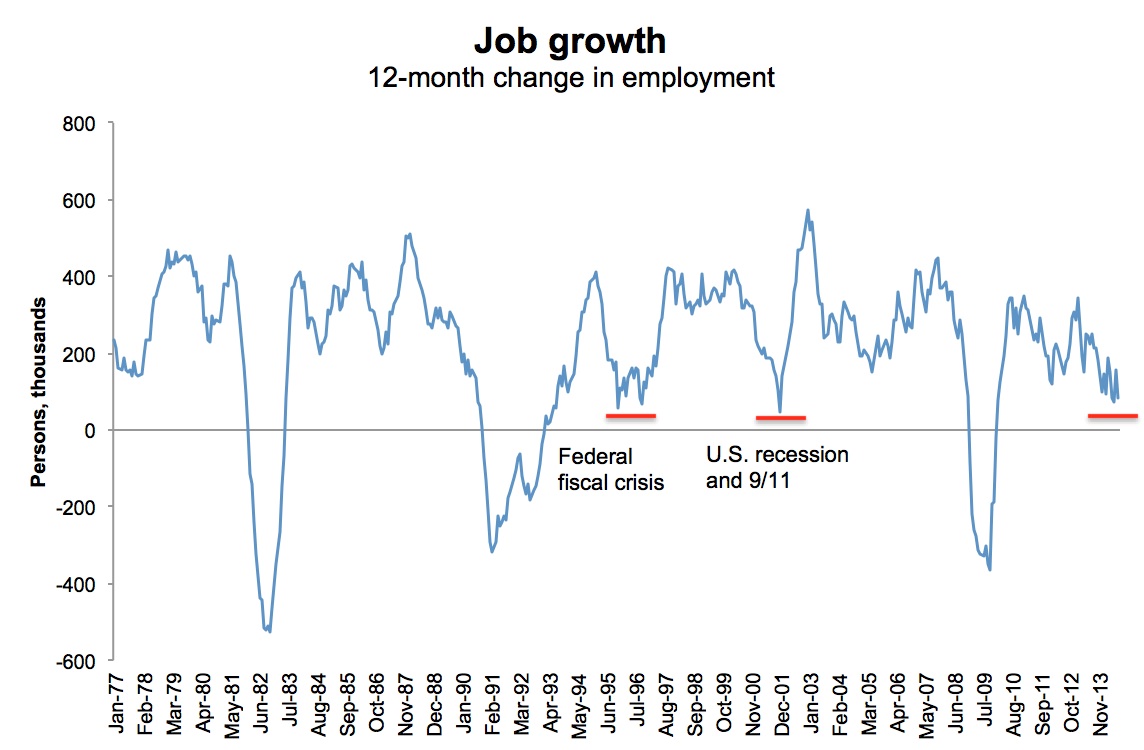
On an annual basis, job growth is probing depths not seen outside of a recession since the federal government took its deficit-fighting axe to the public service in the mid-1990s, or since the 2001 U.S. recession and 9/11 brought economic activity nearly to a halt.
Here are a few other employment highlights from August:
-The unemployment rate stayed at seven per cent.
-Since September 2013, full-time employment has grown just 0.03 per cent, the equivalent of 4,200 net new positions.
-Despite the decline in the number of jobs, wages posted a 2.5 per cent gain from the year before. So it’s not all bad news.
*This post has been updated to fix incorrect wording on the chart, which originally said it showed a moving average.