![IMPORTANT CHARTS_TILE_2[1]](/_next/image/?url=https%3A%2F%2Fmacleans.mblycdn.com%2Fuploads%2Fmac%2F2014%2F12%2FIMPORTANT-CHARTS_TILE_21.jpg&w=640&q=80)
35 ways to look at the economy on budget day
At the end of 2014, Maclean’s asked 35 of Canada’s leading economists, analysts, investors and financial bloggers to send us what they thought would be the most important chart for the country, as we headed into this election year. The result was the following 35 charts, first published in December, that touch on everything from household and government finances and oil prices to the job market and exports.
With the federal budget due to be released on Tuesday, April 21, these charts are as important as ever. Click on each one to open in a new window and enjoy.
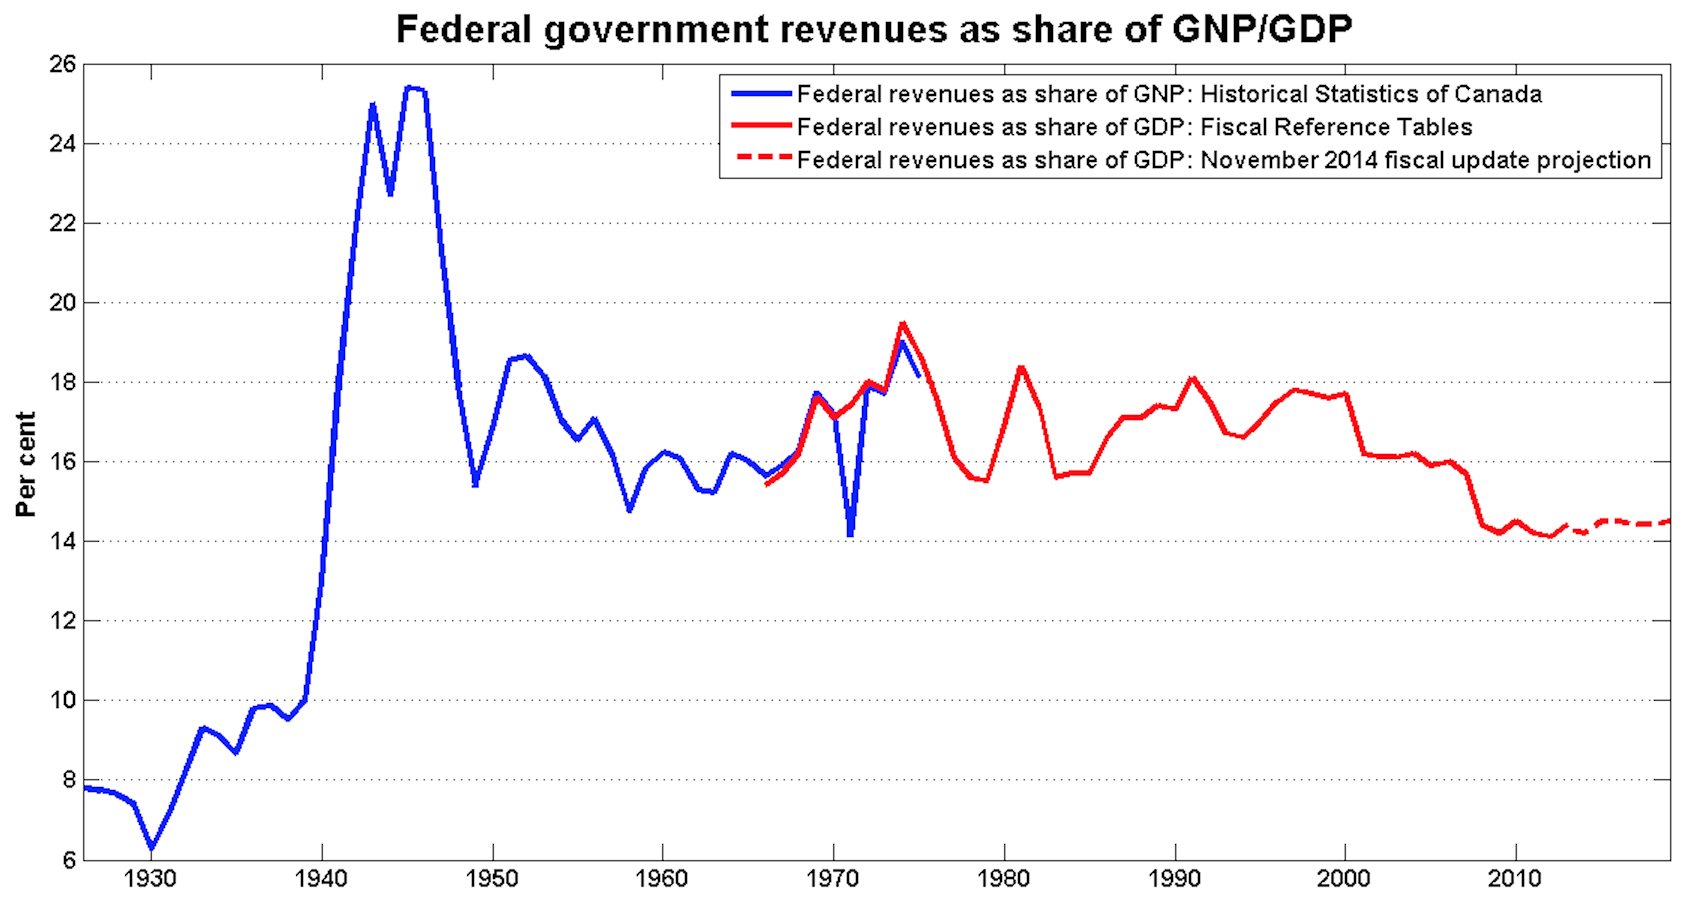
- 1. Shrinking federal revenues to keep spending in checkStephen Gordon, Université Laval
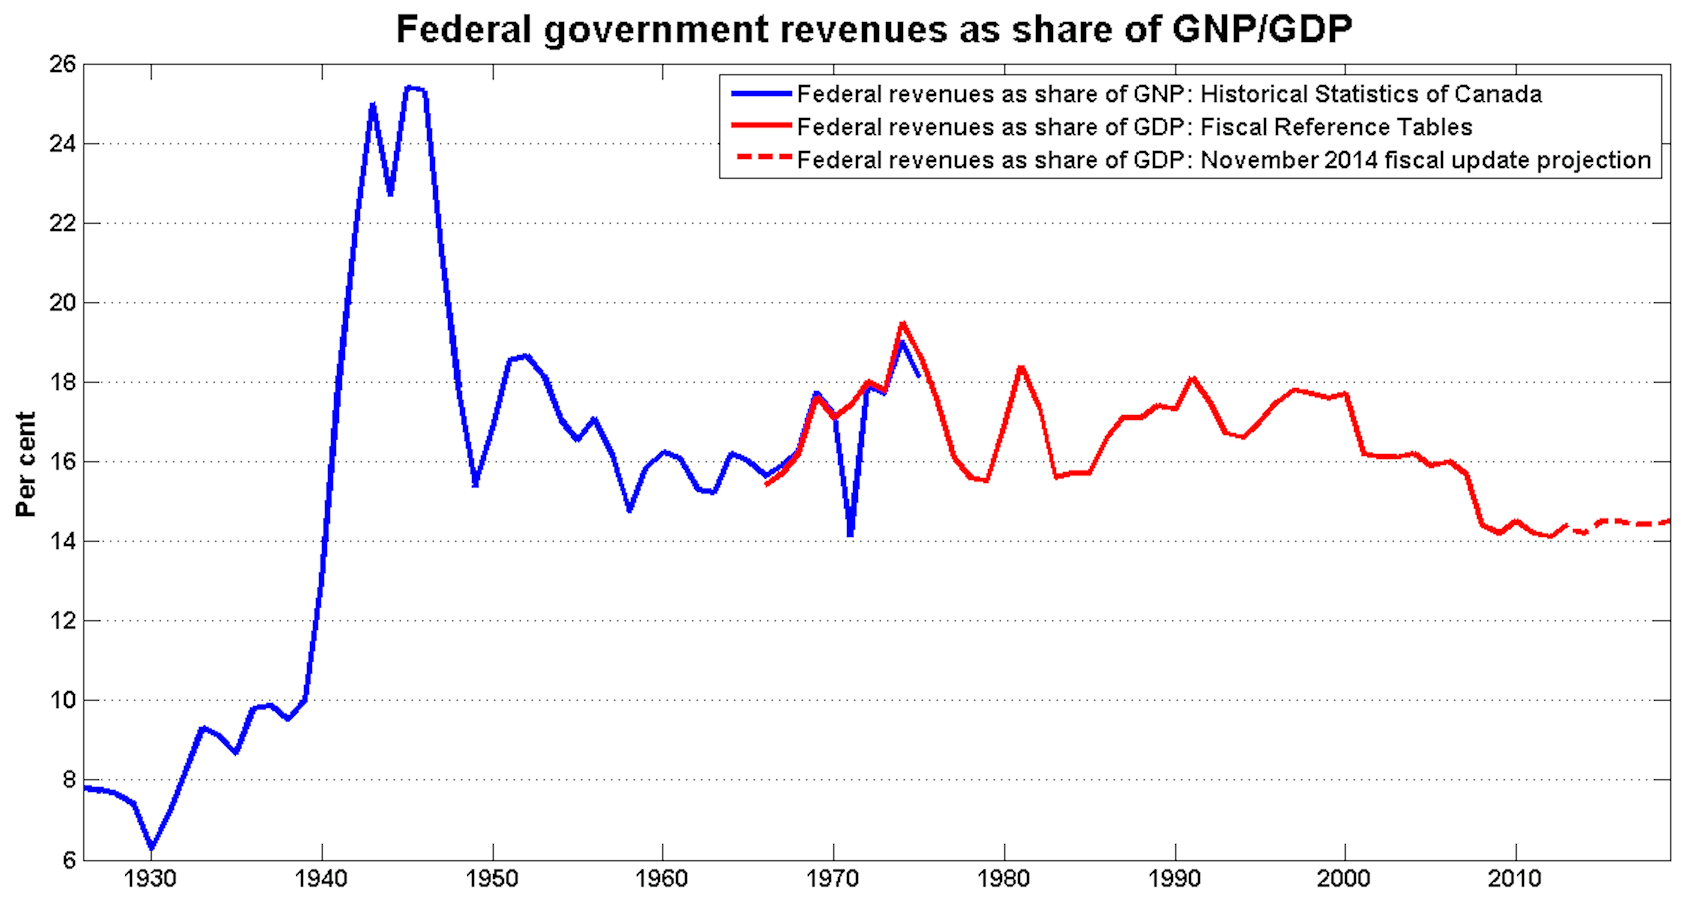
- This is a chart of federal government revenues, expressed as a fraction of total economic activity. Before Prime Minister Stephen Harper came to power, this ratio had been above 15 per cent since before the Second World War. Federal revenues have now been below 15 per cent of GDP for the last six years, and are projected to stay below this threshold for the next five years. Neither the federal Liberals nor the federal NDP has indicated they are willing to take steps to significantly increase revenues. So, regardless of who wins the next election, the outlook for federal spending will closely resemble the Conservatives’ projection.
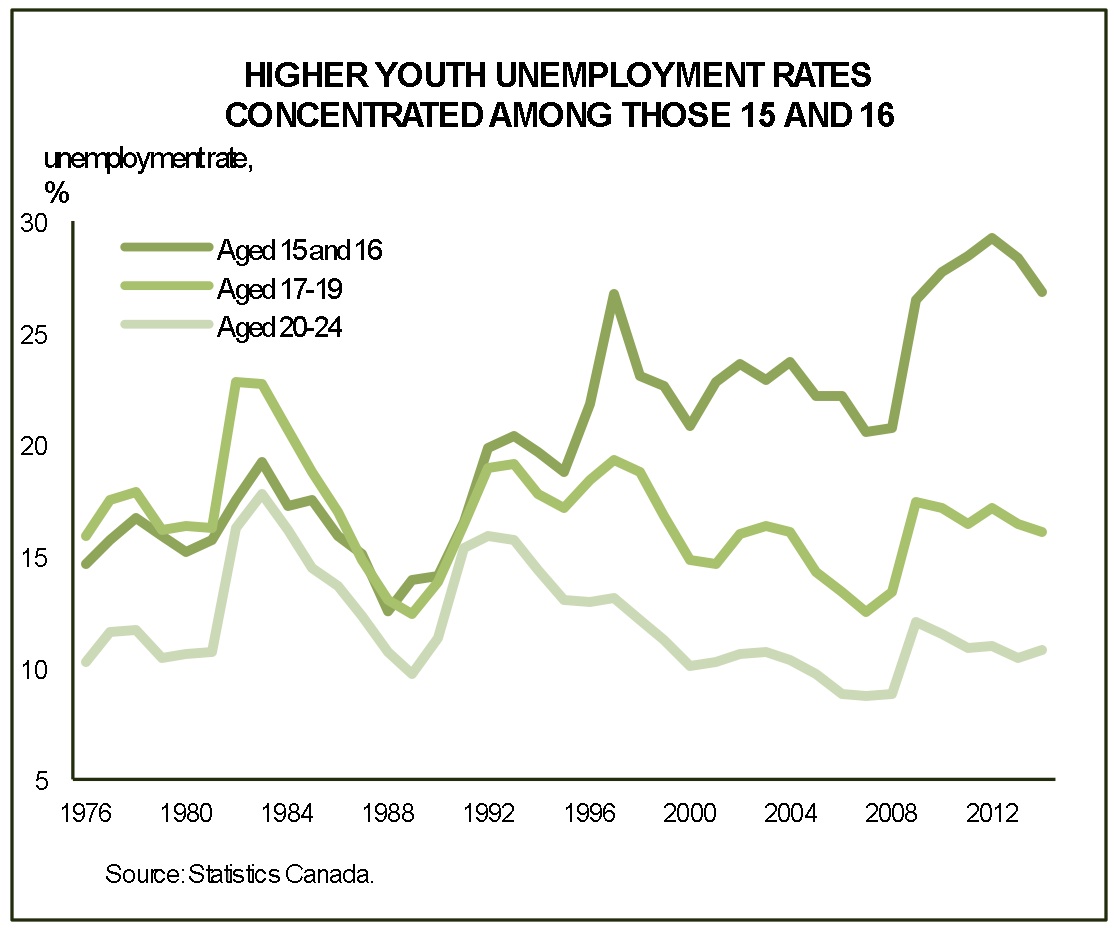
- 2. There’s more to the youth unemployment storyDerek Burleton, TD Economics
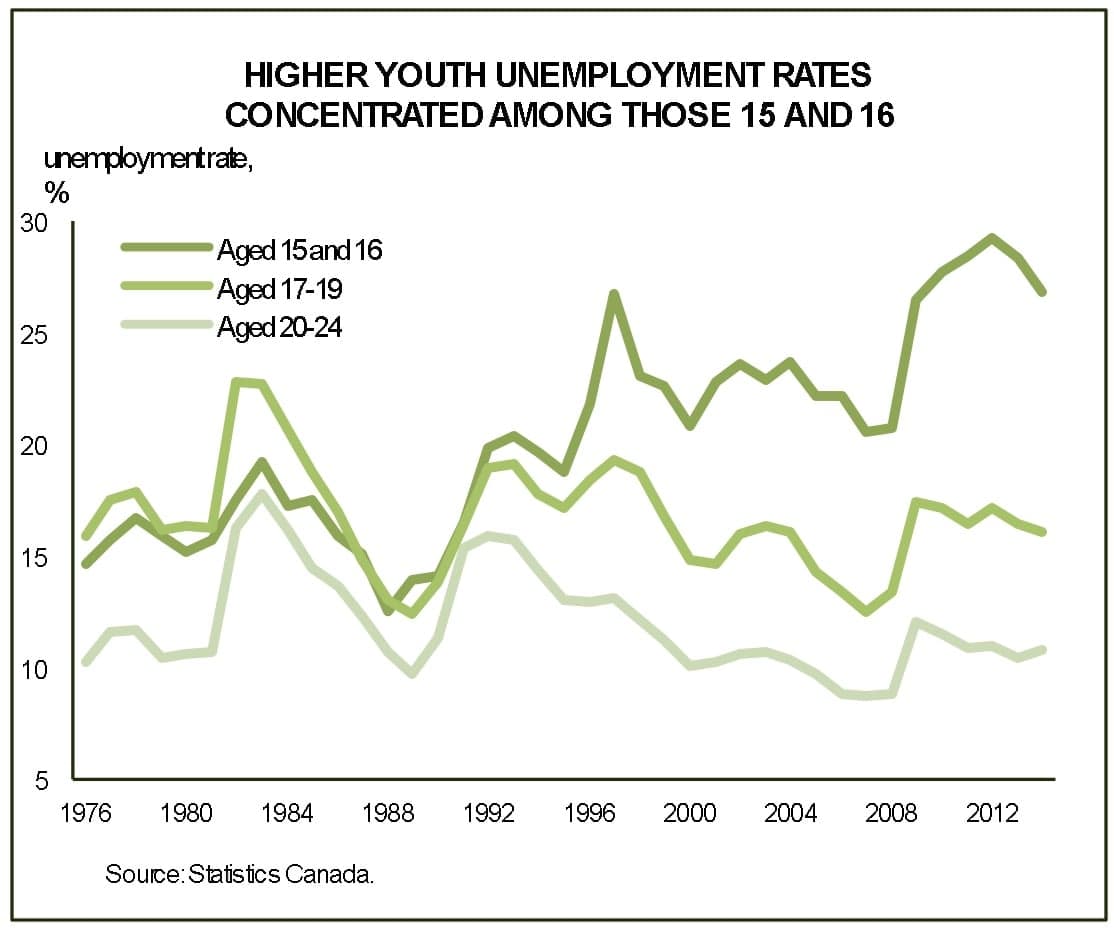
- There were many headlines in 2014 about the challenges of Canada’s youth in the job market. Typically, commentators refer to the 15-24 age category, where unemployment continues to hover at an unacceptably high 13 per cent, which is about twice the national average rate. Yet, average statistics can hide the true picture. As the chart shows, a good part of the problem is concentrated in the high school age groups of 15-19 and, in particular, the 15- to 16-year olds. (Many Canadians in those young age cohorts tend to be loosely attached to the job market.) In contrast, the jobless rate for the 20-24 age group, which comprises a share of new post-secondary education grads, has fallen into the lower end of its long-term range. This is not to say that job conditions are great for any age slice within the 15-24 category. For example, if one uses the pre-crisis lows as a benchmark, unemployment rates are still on the high side, even for 20- to 24-year olds. However, the point here is that one must be careful in painting the entire 15-24 age group with one brush.
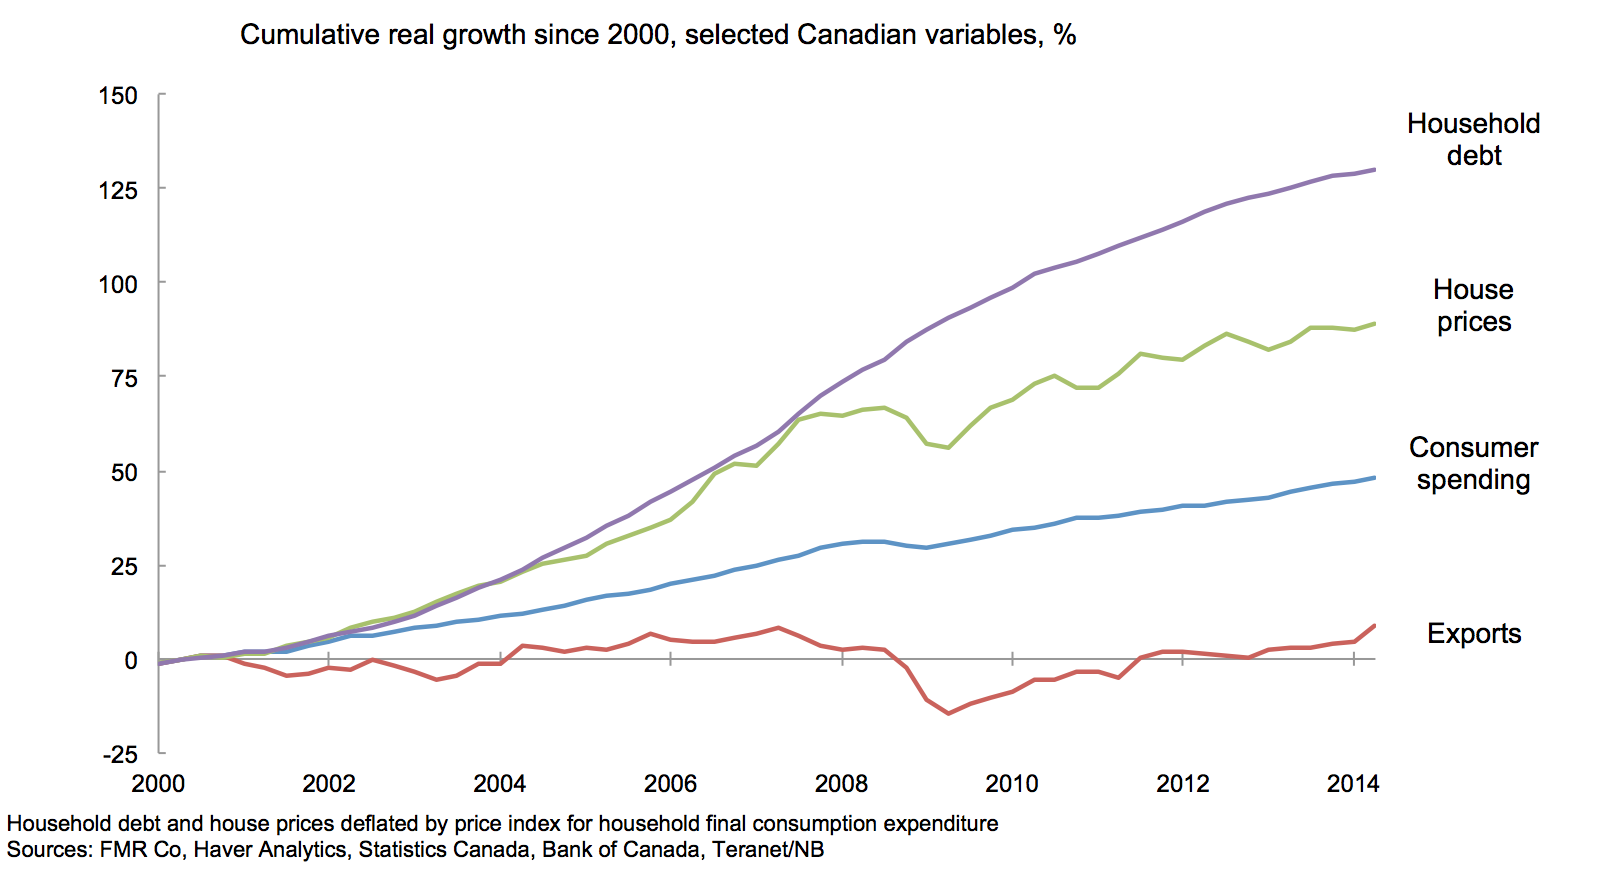
- 3. Canada’s economy remains unbalancedDavid Wolf, Fidelity Investments
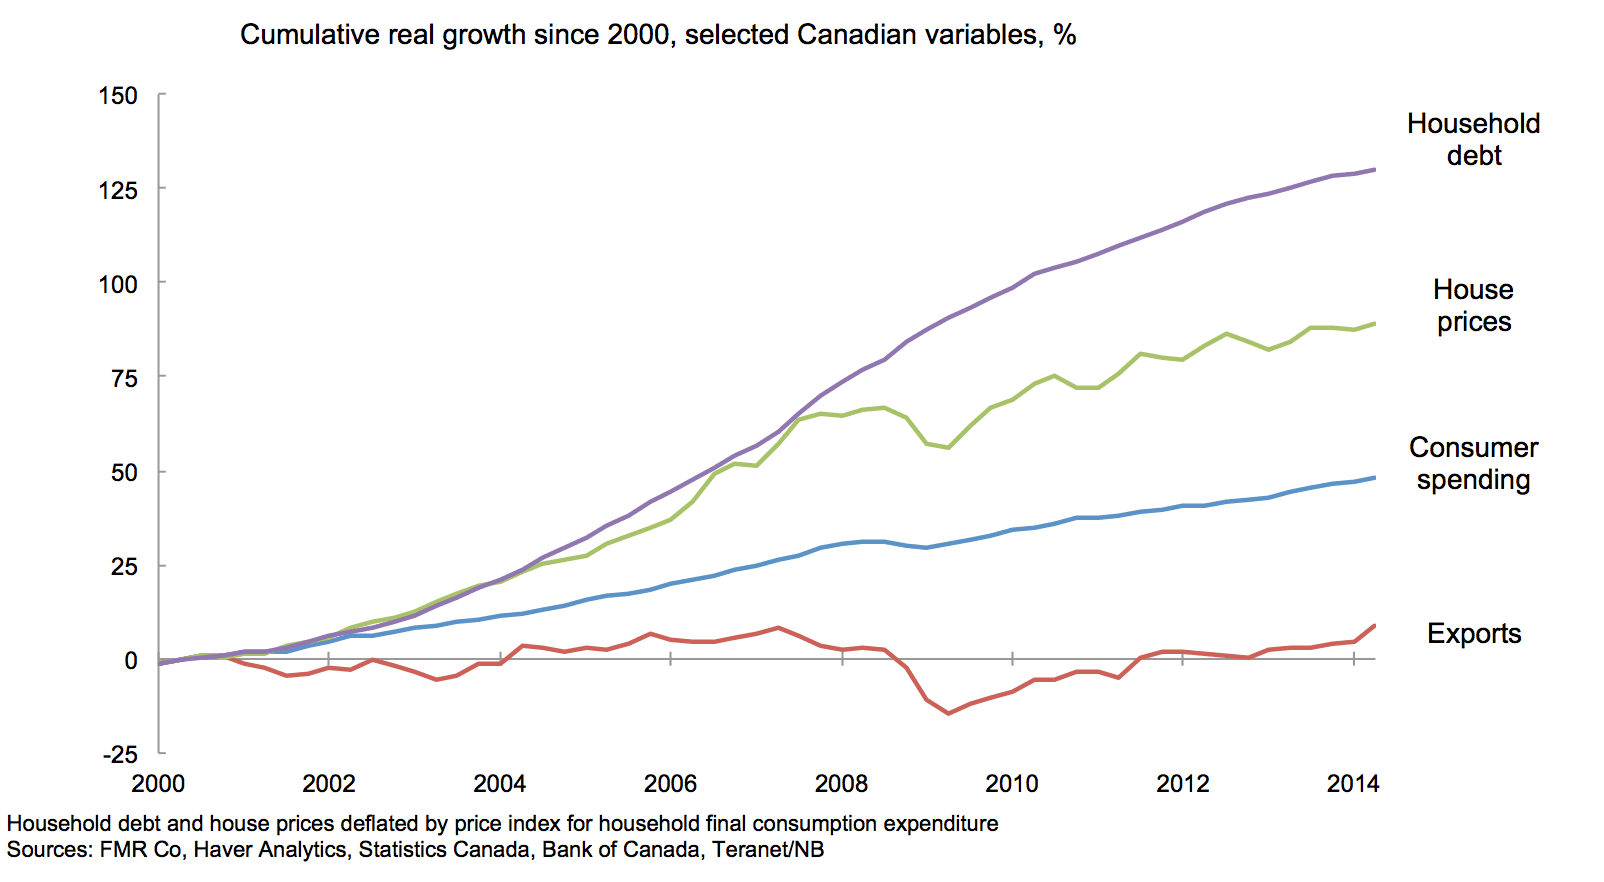
- Canada’s economy has relied excessively on debt-fuelled consumer spending and housing investment in recent years. But exports can only pick up the slack ahead if Canadian competitiveness improves, which we expect will require a weaker Canadian dollar. Among other things, this should provide a tailwind to returns on foreign investments ahead.
- 4. Canada runs on immigrantsSal Guatieri, BMO Capital Markets
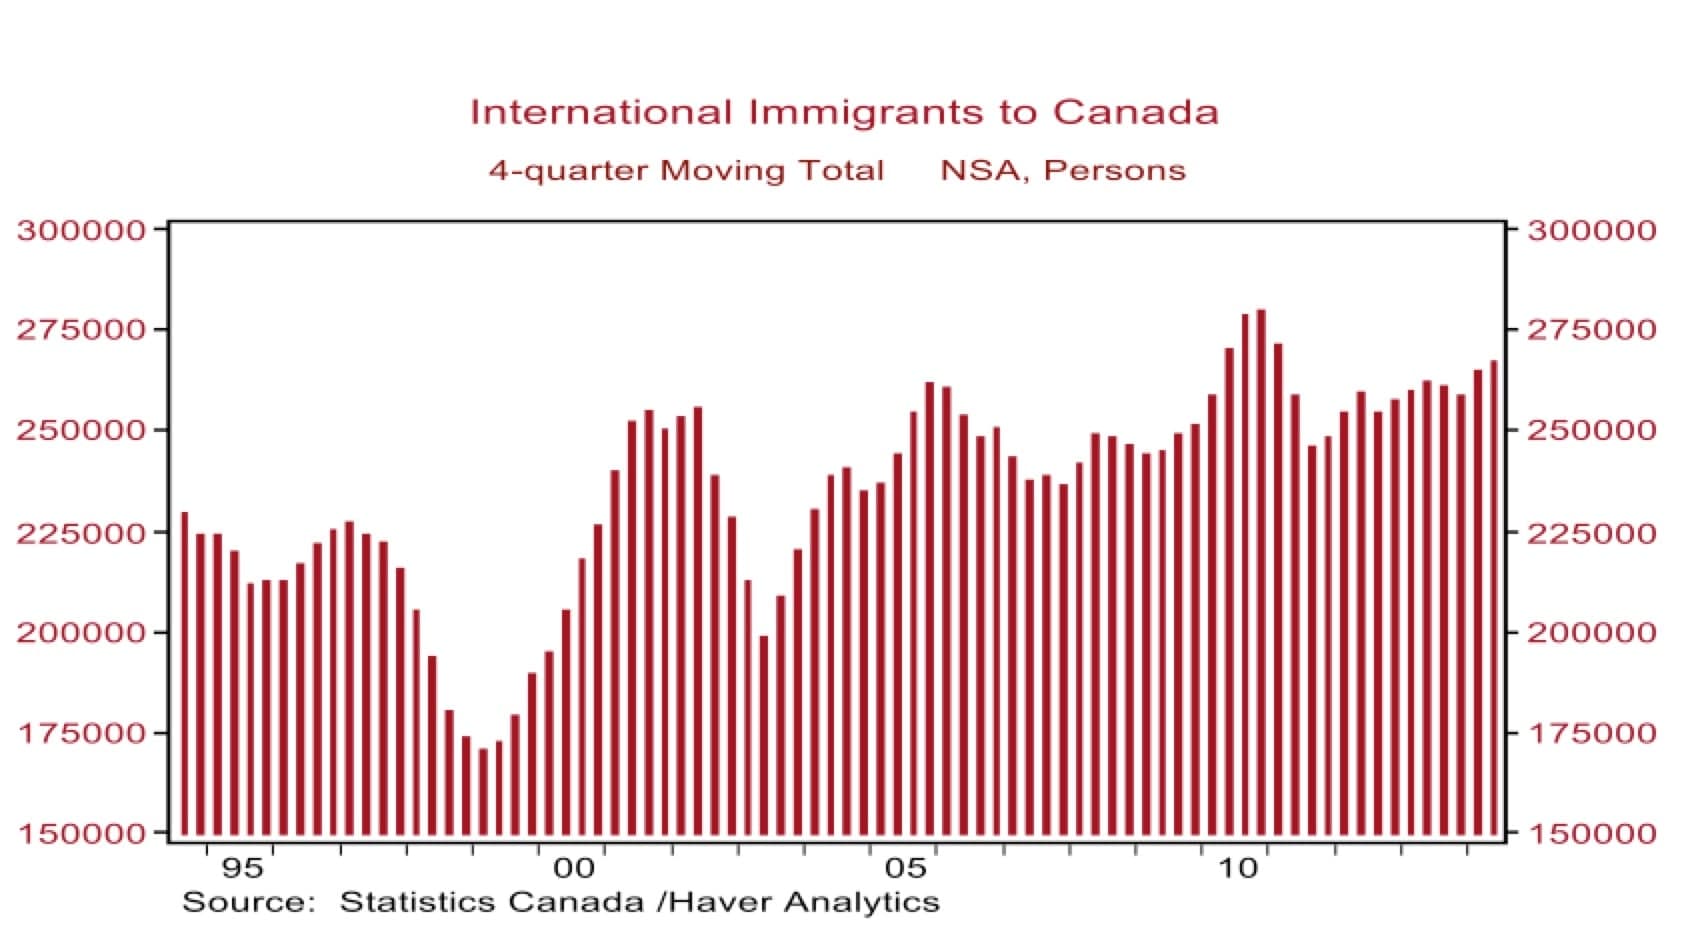
- This is a chart showing international immigration to Canada. I believe immigration is crucial to Canada’s economic vitality. If not for the 250,000 international migrants who arrive in Canada each year, our population would grow only one-third as fast, the economy would be weaker and less dynamic, and many skilled positions would go unfilled, hurting competitiveness.

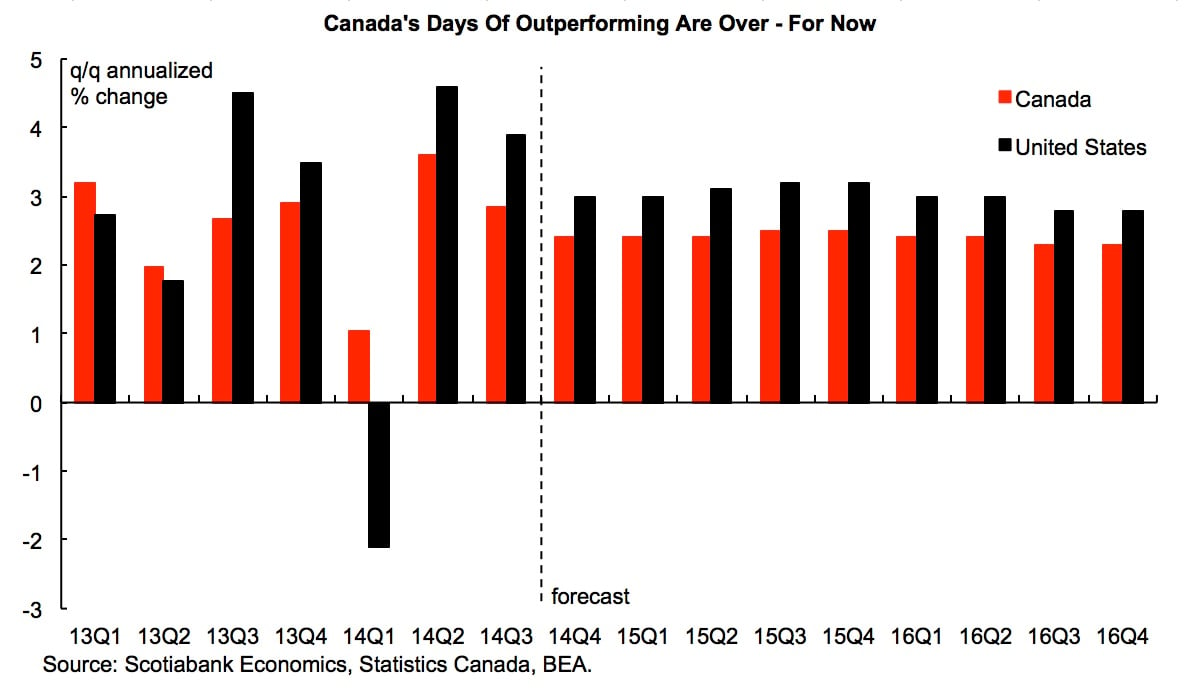
- 5. Canada’s underperforming economyDerek Holt, Scotiabank Economics
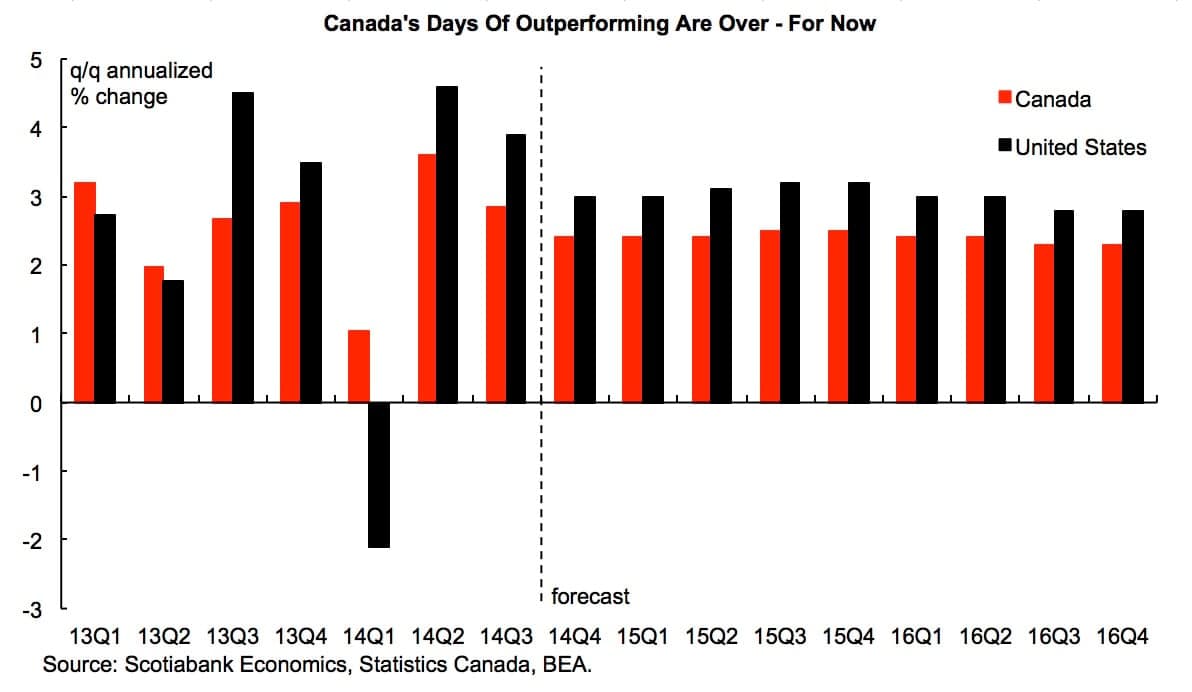
- Our long-held view that U.S. economic growth would outperform Canadian growth has come to fruition and is likely to continue. Canada bolted from the post-crisis starting gates, but now, resource investment and the household sector are becoming more growth-challenged, just as the U.S. unleashes pent-up demand via improved hiring and confidence. The consequences will continue to reshape Canadian financial markets via less growth in foreign-investor appetite relative to the U.S.
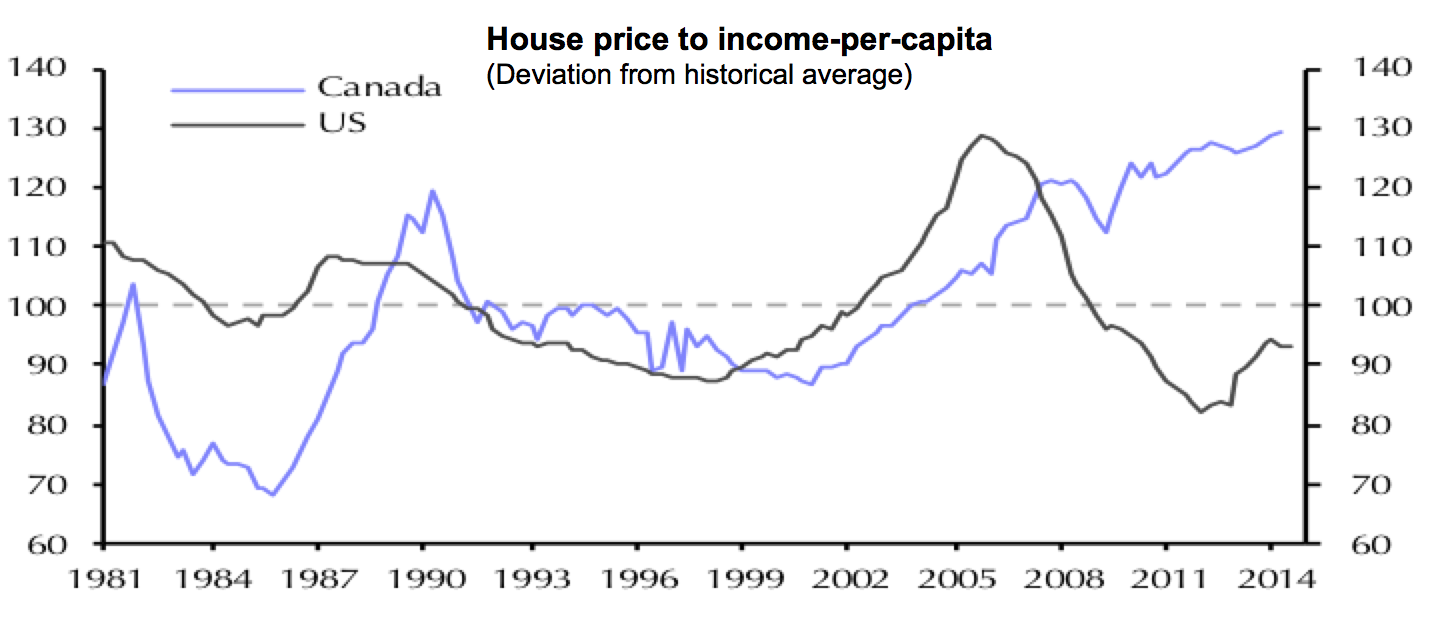
- 6. Canada’s housing bubble tops America’sDavid Madani, Capital Economics
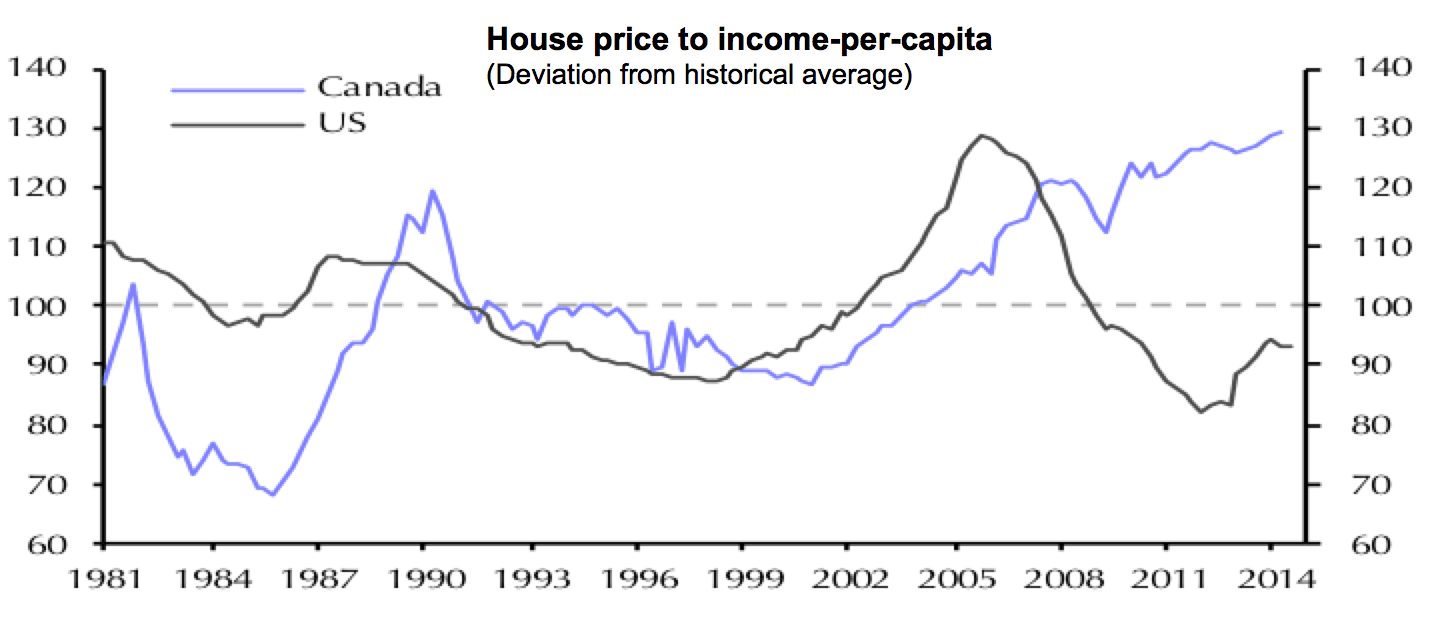
- House prices for Canada relative to income per capita have deviated from their long-term historical average, to the same degree that occurred at the peak of America’s housing bubble. In the chart, the long-term historical average is set to equal the value 100. The data range covers 1981Q1 to 2014Q2.
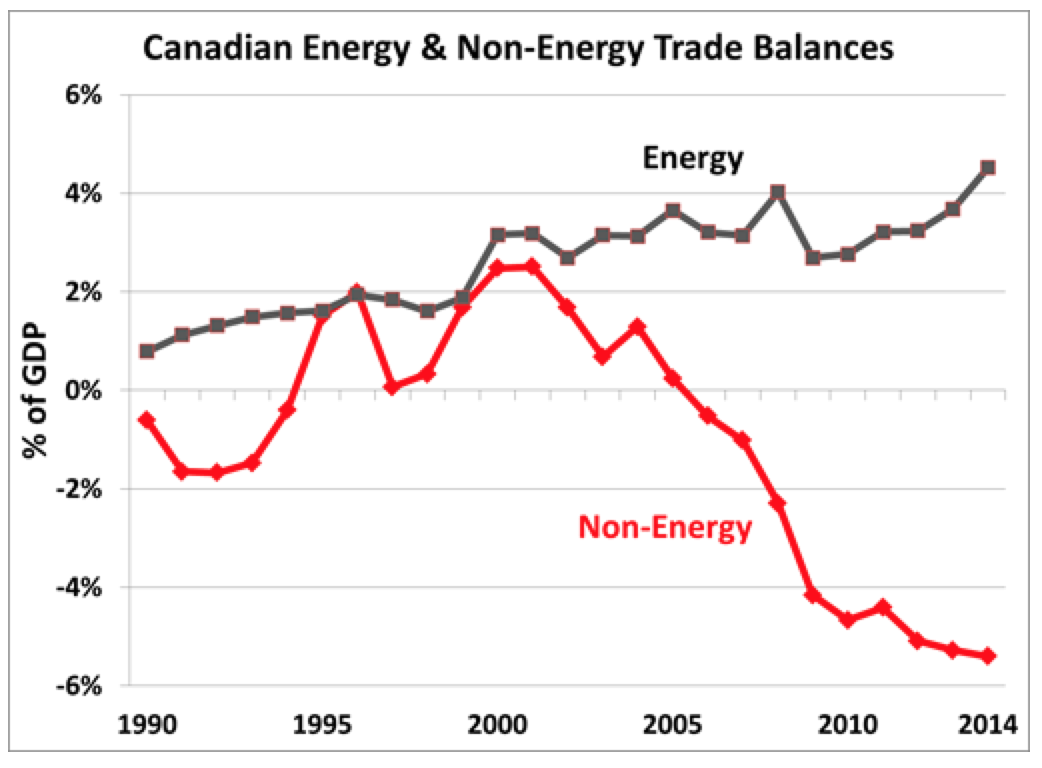
- 7. Canada’s unhealthy reliance on energy exportsJim Stanford, economist at Unifor
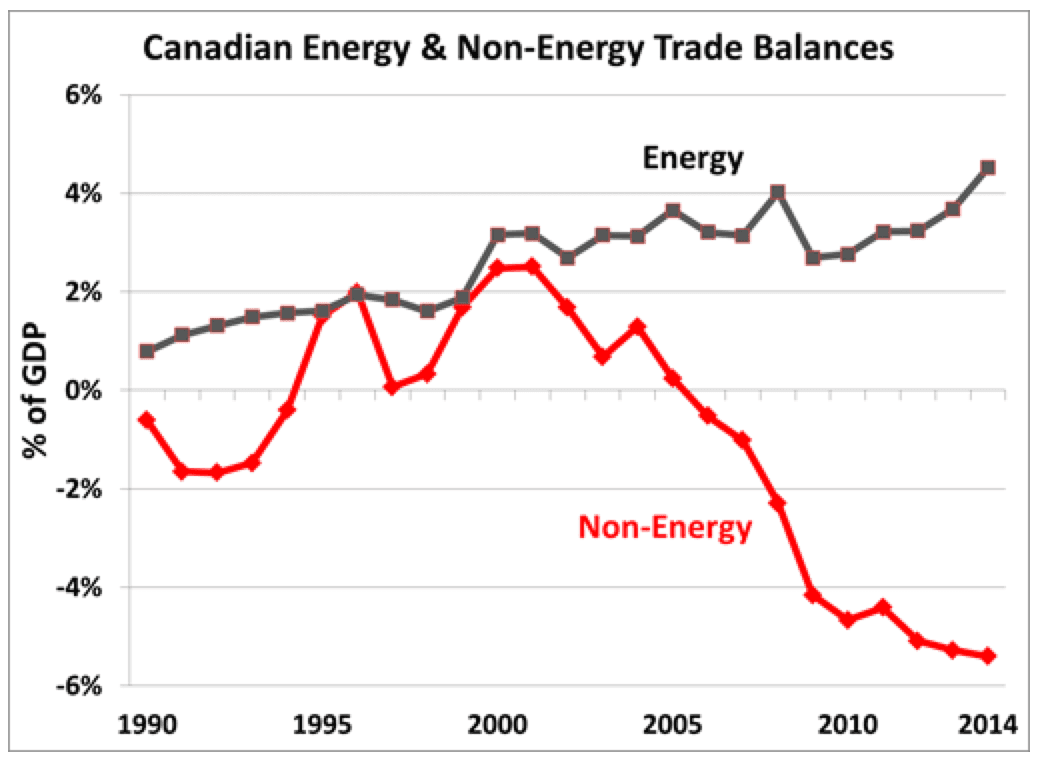
- Until the turn of the century, Canada had a diversified and successful portfolio of export products. Yes, we exported significant amounts of natural resources (including energy). But we also exported many other goods and services, including generating trade surpluses in several technologically sophisticated value-added products (such as automotive, aerospace and telecommunications equipment). Around the turn of the century, however, the composition of our international trade began to change dramatically. Resource exports soared while other export industries declined. The end result? Our export portfolio became dangerously concentrated in energy (especially petroleum). Imagine what will happen if oil prices fall substantially (as they are now doing), and/or the rest of the world stops demanding oil in large quantities (as is likely to occur, for both economic and environmental reasons). Putting all our national export eggs in that one basket may prove to be a big mistake. Canada no longer relies on exports of beaver pelts to pay our way in international trade . . . and it’s not because we ran out of beavers.
- 8. Foreign investors still drawn to CanadaDavid Rosenberg, Gluskin Sheff and Associates
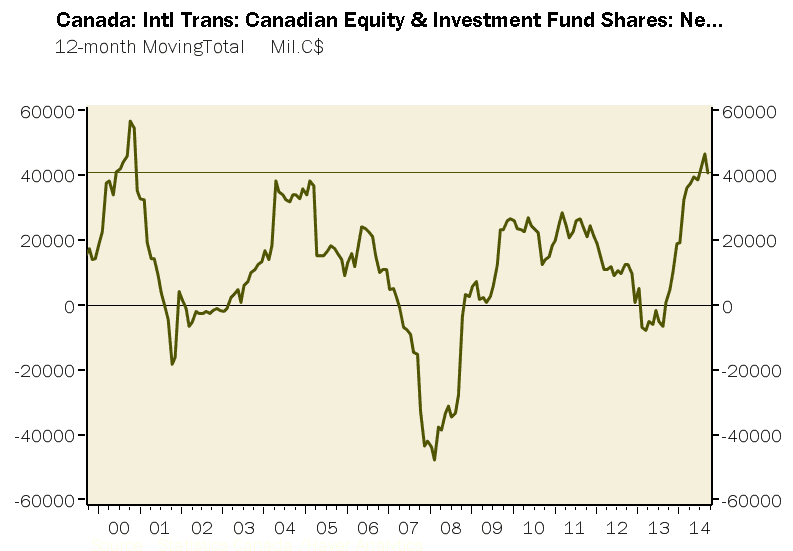
- You would think that, based on all the negative press about the resource sector, the housing market and the consumer, that the Canadian economy was some sort of struggling emerging-market basket case. But, for all the downbeat narrative, the foreign investor is voting with his pocketbook in the opposite direction: Over the past year, net inflows to equities from abroad have exceeded $40 billion, and there has not been one month of net redemption since August of last year. So put that in your pipe and smoke it!
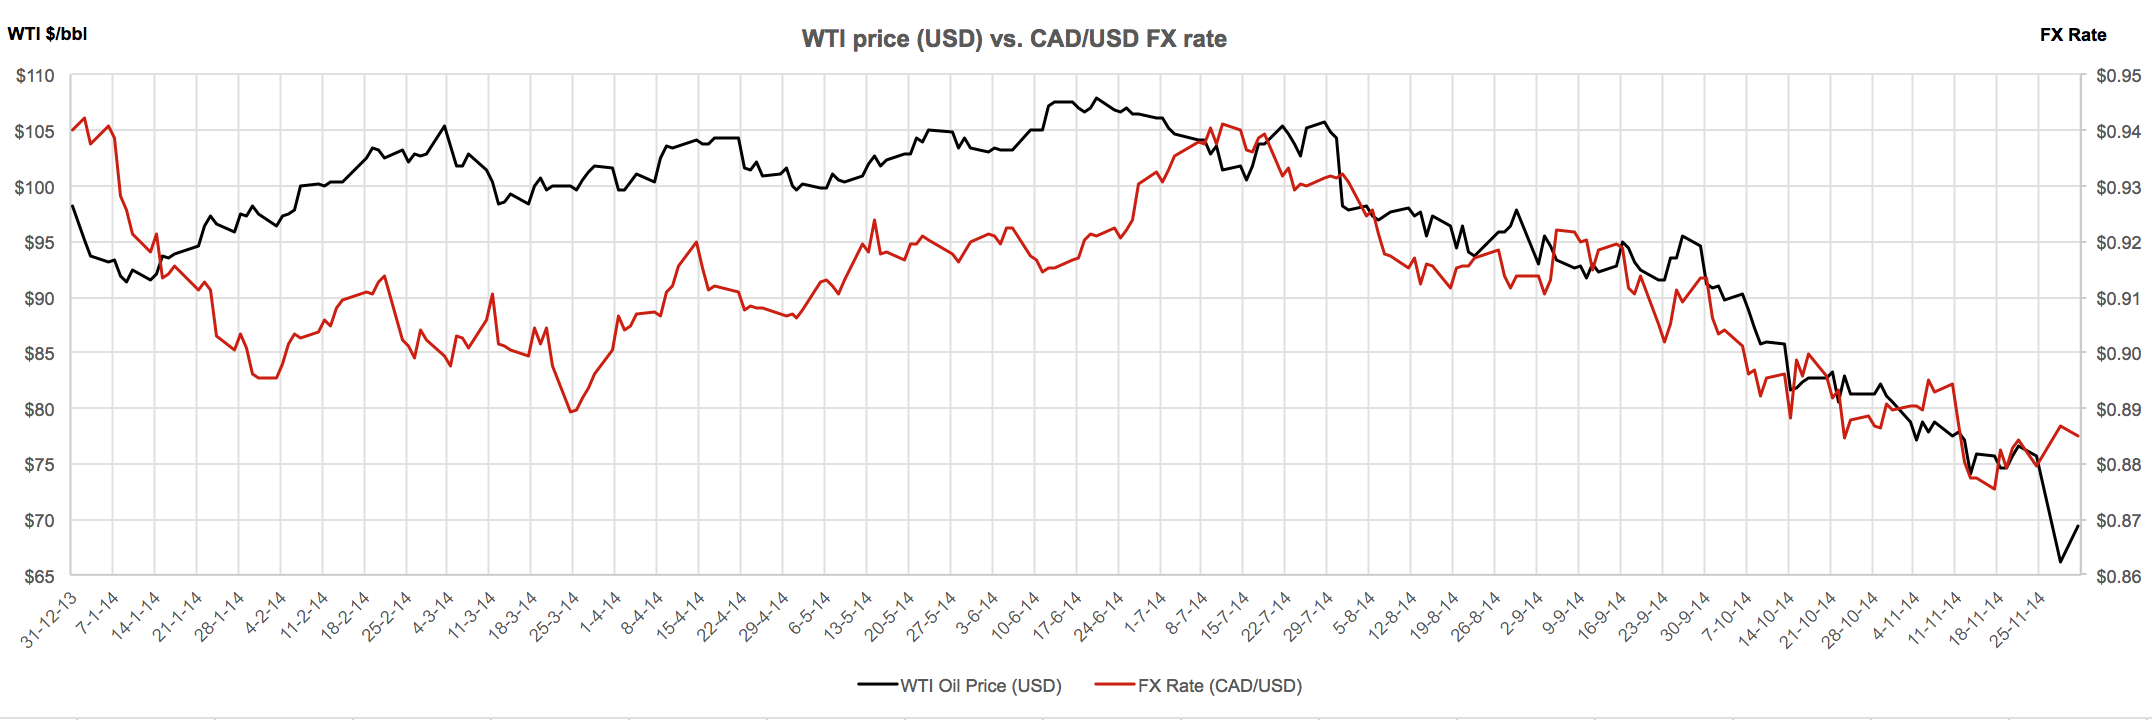
- 9. The fall of oil and the loonieDoug Porter, BMO Capital Markets
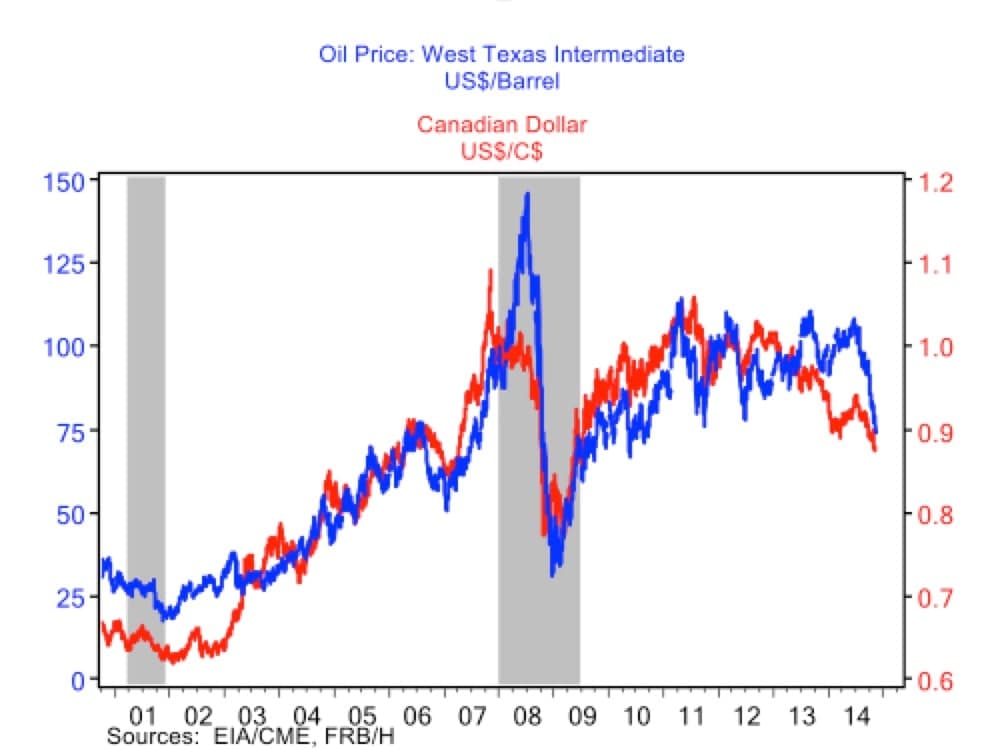
- The deep dive in oil prices in late 2014 was probably the single-most important development for the Canadian economic outlook, and it has implications for the Canadian dollar, stock prices, GDP growth, government finances and the regional outlook. The sag in oil prices, if sustained, is a clear-cut negative for the Canadian dollar. However, we believe that the loonie actually led the way in 2014, dropping heavily at the start of the year, and that it is actually close to fair value at just below US90 cents. The dual drop of the Canadian dollar and oil prices has massive regional implications: After handily topping the provincial growth tables for a decade, Alberta will probably come back to the pack (if not lower). On the flipside, it’s tough to write a better external script for Ontario: a firming U.S. economy, a softening loonie and falling oil prices.
- 10. The danger of high fees to investorsPreet Banerjee, personal finance expert

- Few people truly understand the importance of keeping an eye on portfolio costs. This chart shows how a seemingly innocuous annual cost of 2.25 per cent can add up to more than $350,000 in lifetime costs. You might be wondering if this is just a wealthy person with a large portfolio, hence the large costs. Nope. This scenario assumed the following: starting income of $25,000, which increased by four per cent per year until age 65; the savings rate was 10 per cent of gross income, and the portfolio grew at seven per cent per year. He spent down his portfolio to $0 by age 90. Adjusting for inflation, the lifetime costs in today’s dollars would be just over $160,000. All other things being equal, reducing costs can bolster your retirement income. But don’t fall into the trap of thinking that cutting out the cost of financial advice will translate into a larger portfolio for everyone. What you save in costs there might pale in comparison to what you lose by making mistakes with your portfolio. Start by having a conversation with your adviser about cheaper products first before doing anything drastic. (For a calculator that lets you play with your own income, inflation, growth and fee assumptions, click here.)

- 11. Longer life expectancy requires a rethinkKevin Milligan, University of British Columbia
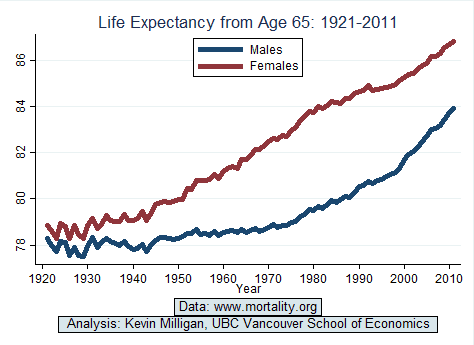
- Life expectancy continues to increase in Canada. This is very positive news—but we can’t keep our work and pension expectations fixed in the face of such rapid expansion in life expectancy.
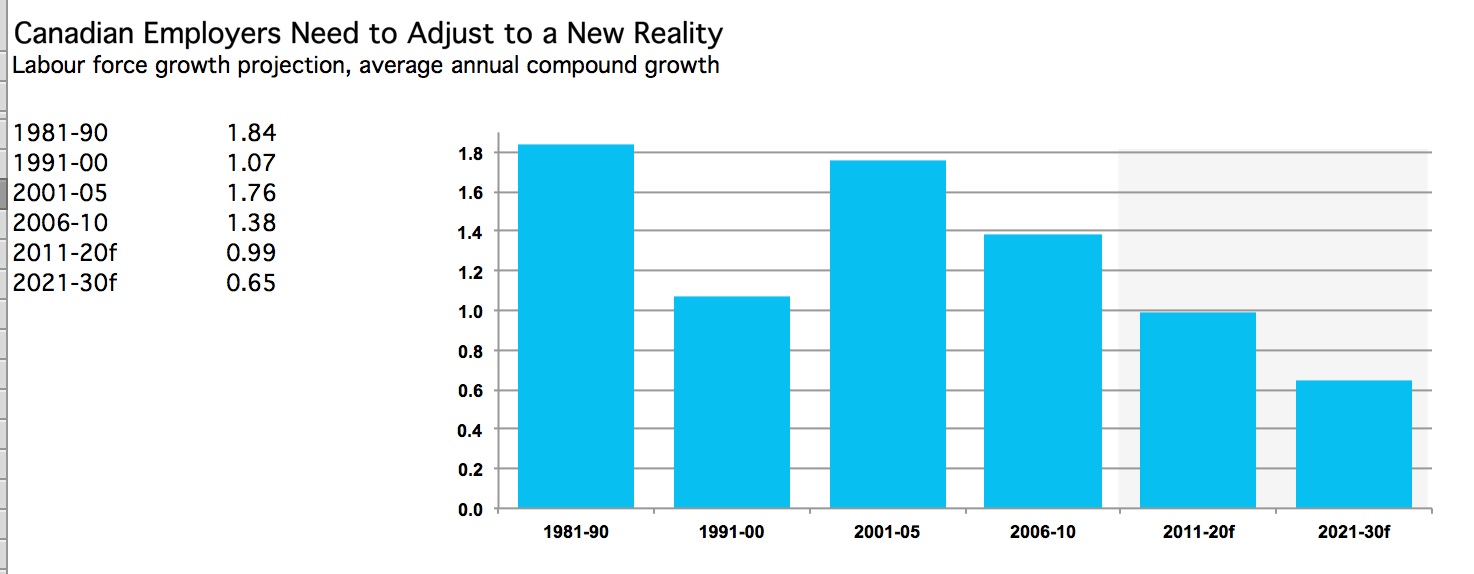
- 12. Fewer workers for the futureGlen Hodgson, Conference Board of Canada

- Canadian organizations are already adapting to slower growth in the supply of labour but, for many, the current weakness in the economy is masking the extent of the issue. Divergent economic conditions aside, very soon, employers will only be able to grow their payrolls at one-third the pace we’ve seen in the past. Are Canadian companies ready for the challenge?
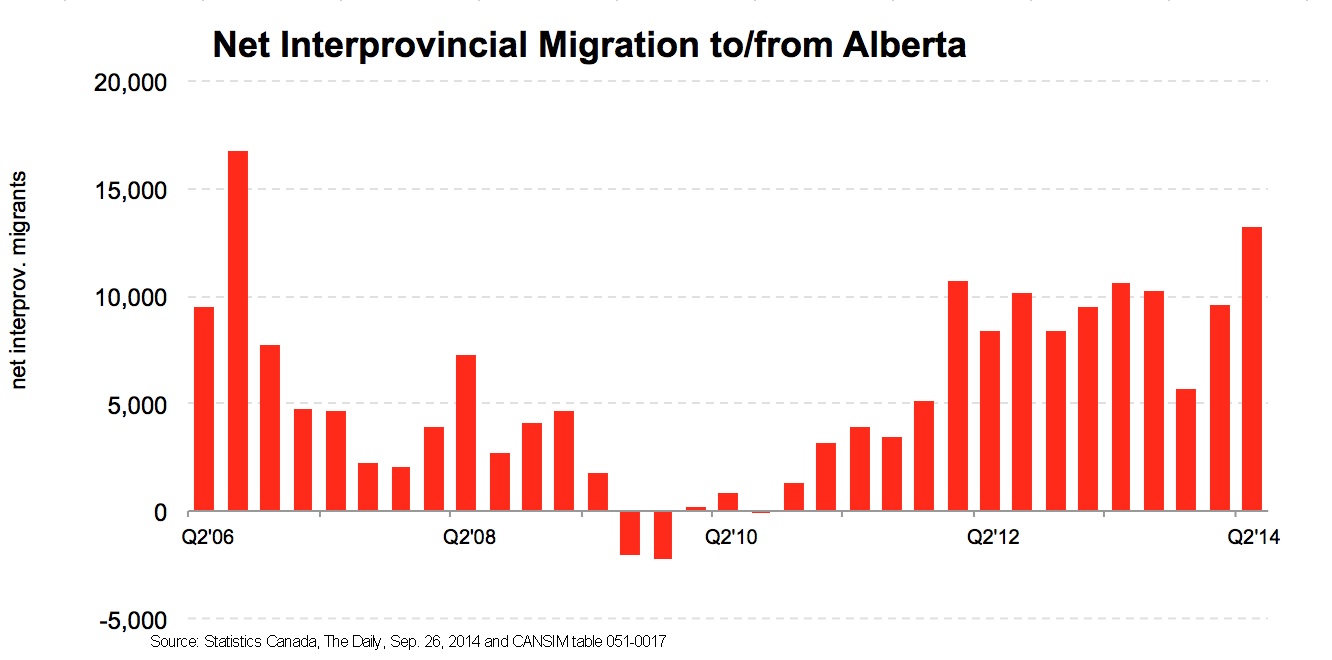
- 13. Alberta-boundTodd Hirsch, ATB Financial
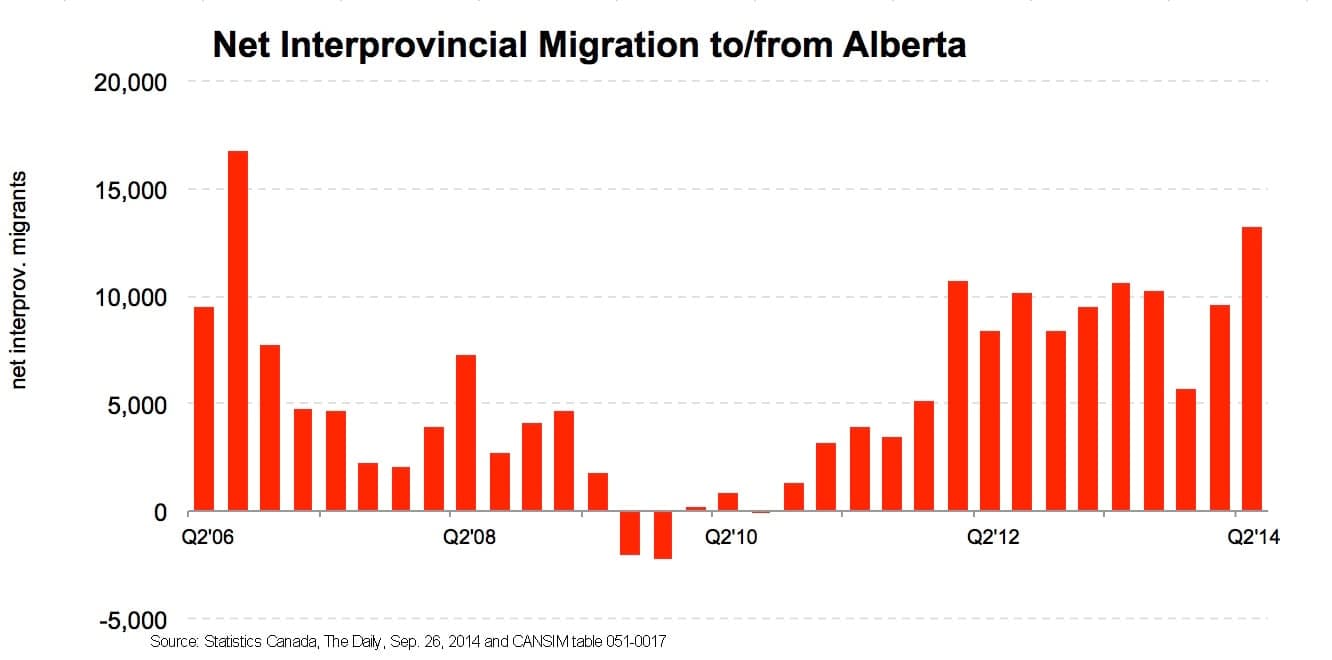
- Jobs have been scarce in many parts of the country lately. But the ability of Canadians to take work in other regions has helped to correct these labour market imbalances. Alberta’s strong job market has been particularly attractive for job seekers. Over the last three years ending July 1, 2014, Alberta has welcomed thousands of them—a net increase of 105,000.
- 14. Younger workers will be scarredMiles Corak, University of Ottawa
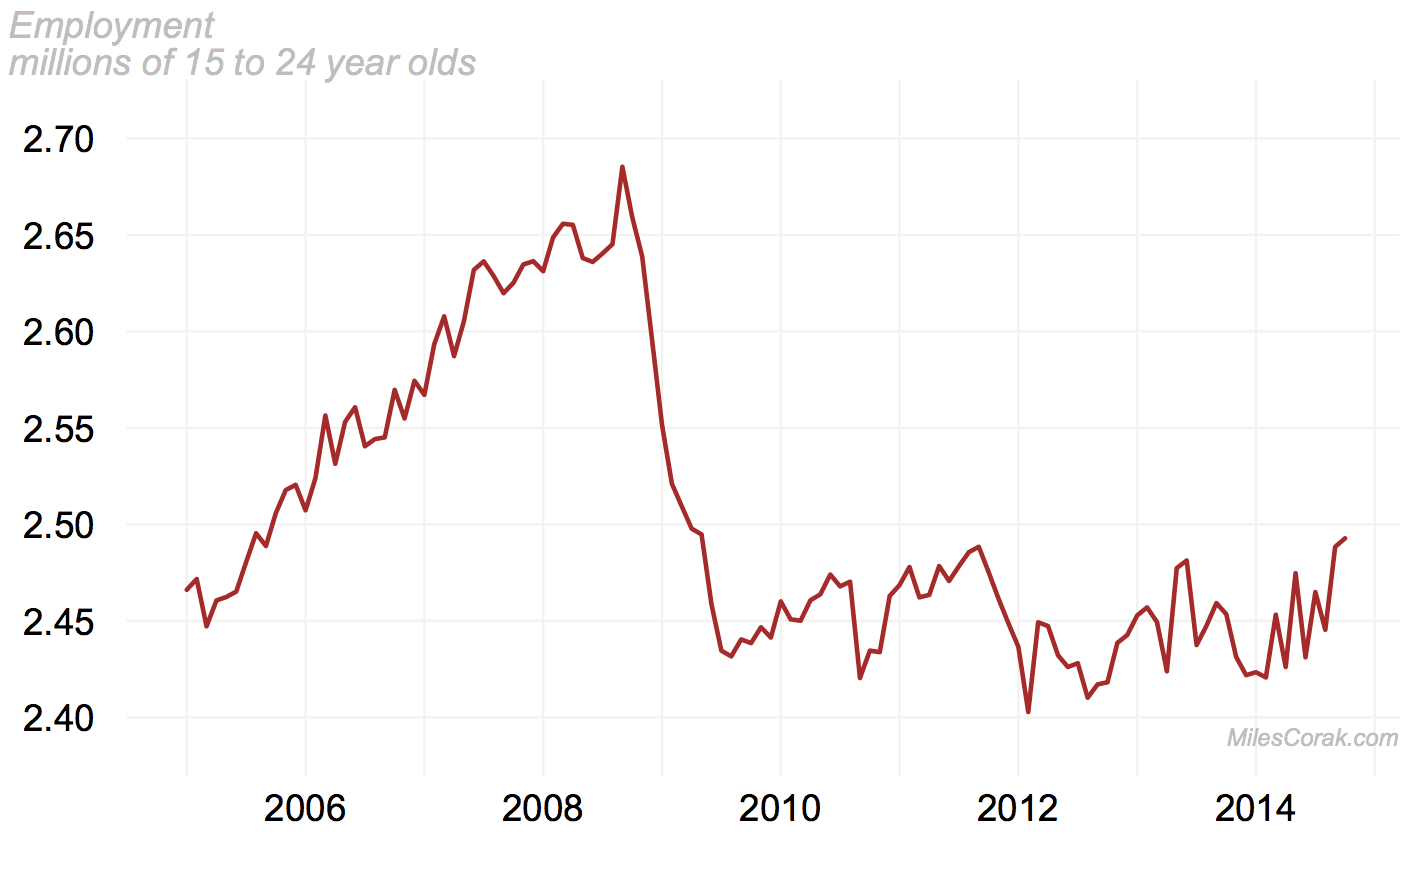
- The economic recovery has yet to come for the young. Their employment levels haven’t grown at all, in spite of the fact that more than five years have passed since the recession ended. Some have stayed in school longer, many have made do with low-paying jobs, while others have given up looking for a job altogether. This isn’t a temporary blemish. It’s likely to leave a permanent scar, as many young people, through no fault of their own, will eventually be shunted down career paths offering a future of lower wages than they ever expected.

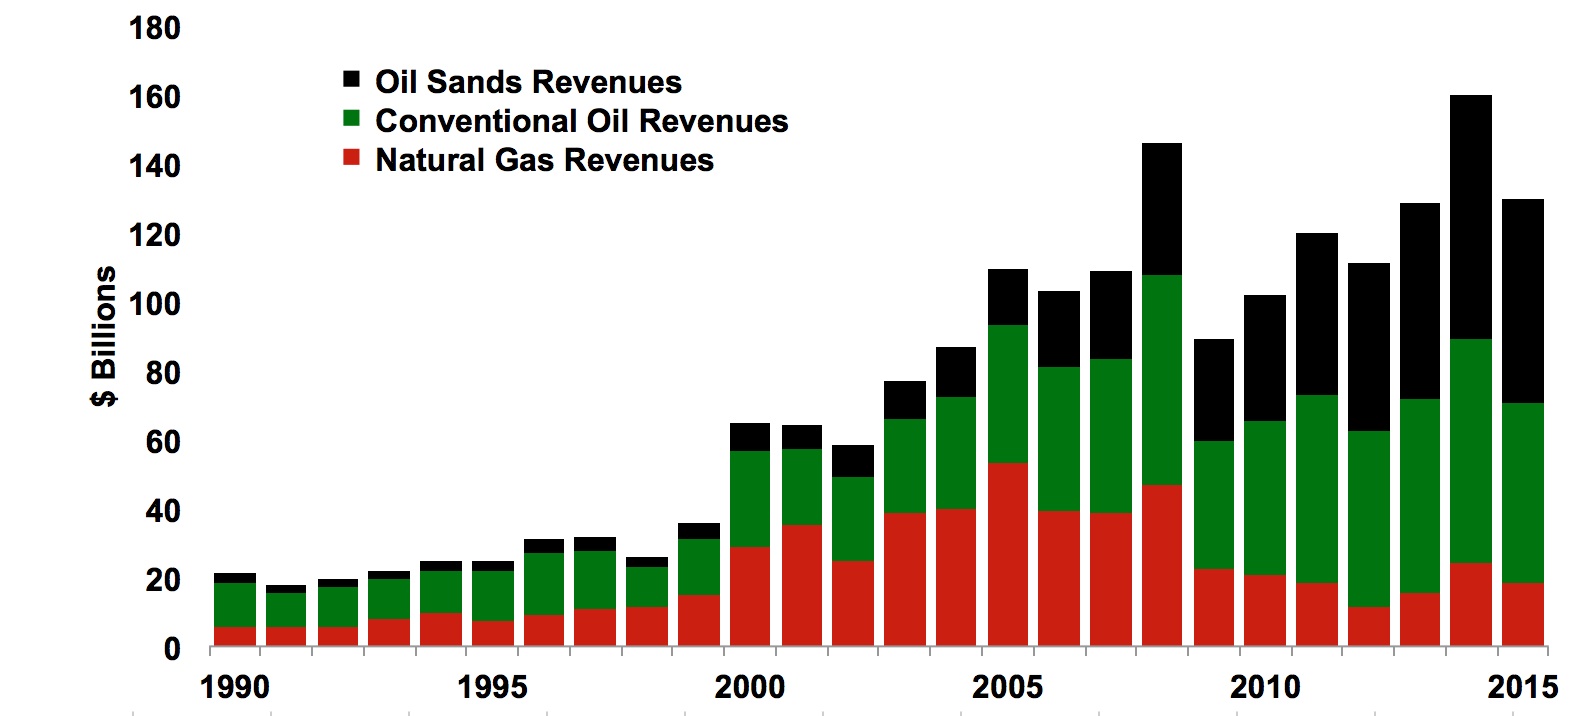
- 15. Canada’s energy sector on the risePeter Tertzakian, ARC Financial Corp.
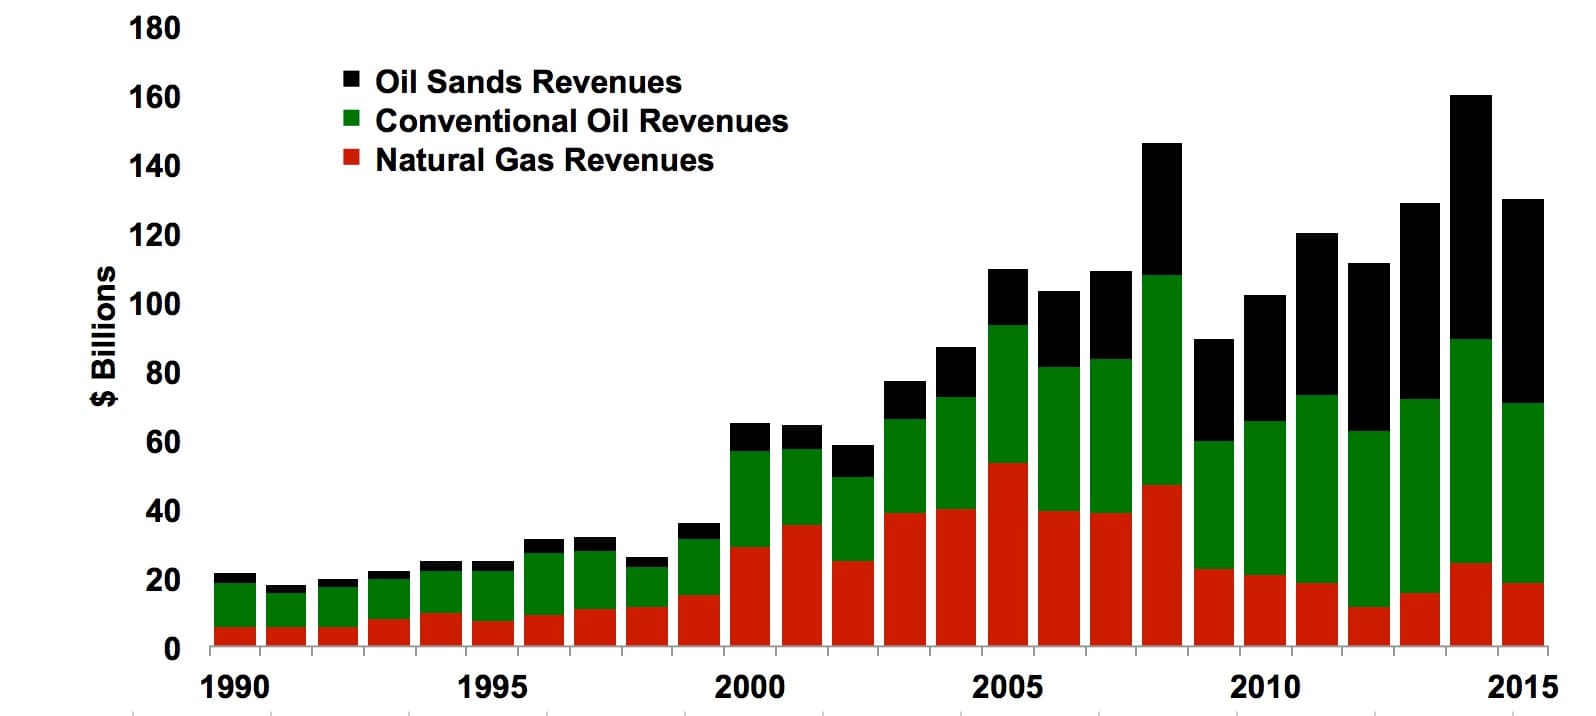
- From meager beginnings in 1858, Canada’s oil and gas industry has grown to be the fourth-largest in the world by production volume. In dollar terms, the revenue of upstream products—oil sands (black), conventional oil and liquids (green), natural gas (red)—topped $155 billion in 2014. That’s four times the size of any other resource industry in our country, including mining, agriculture and forestry.
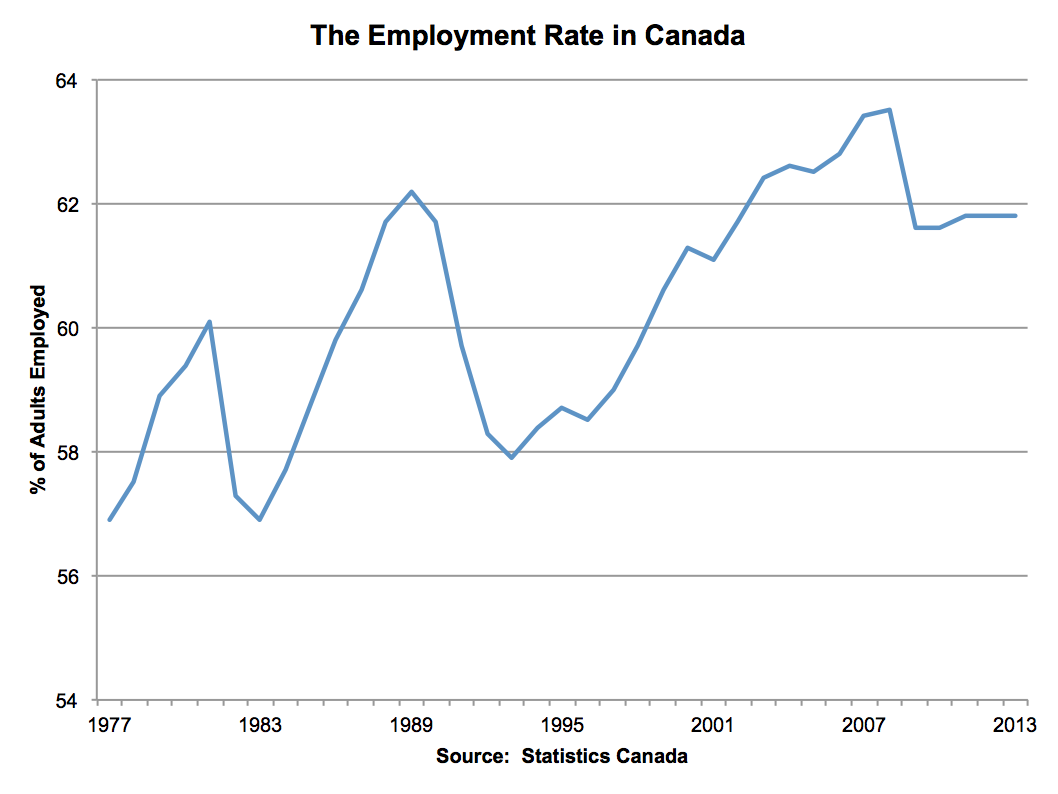
- 16. Canada’s impressive employment rateWill Dunning, Canadian Association of Accredited Mortgage Professionals
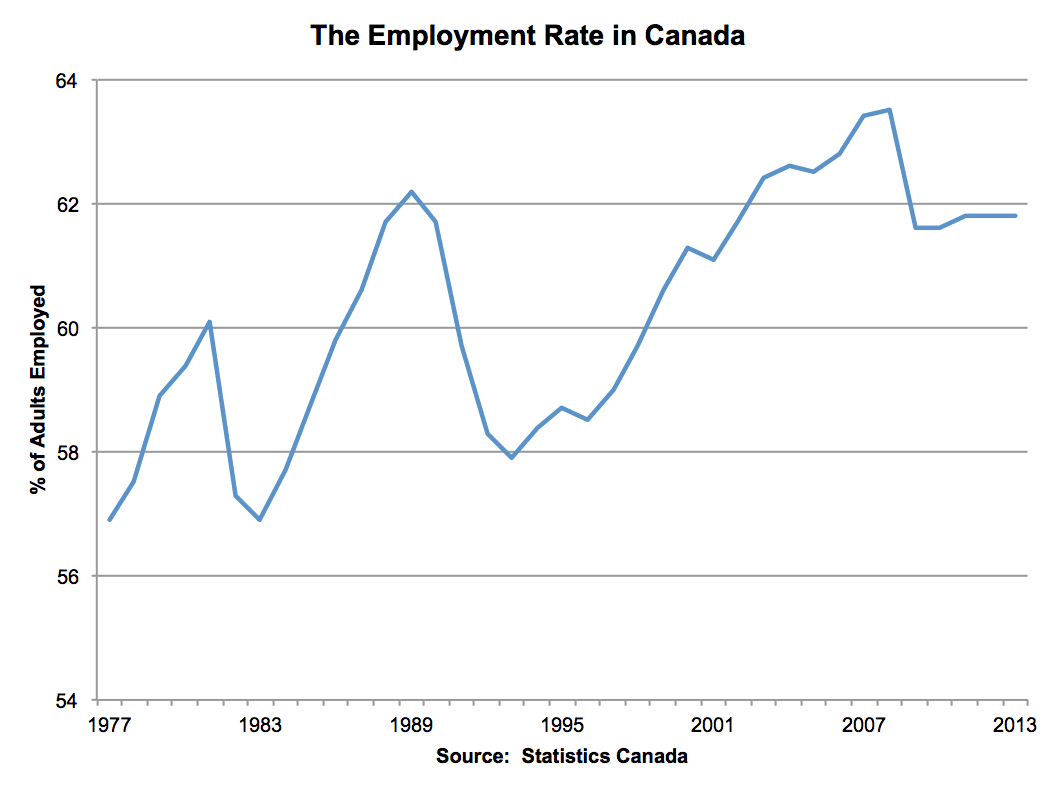
- Having a job gives us a lot of freedoms. The percentage of us who have jobs is lower than before the recession, but still pretty high, historically. For me, this is the most important economic statistic there is.
- 17. Canada’s greying populationBarry Schwartz, Baskin Wealth Management
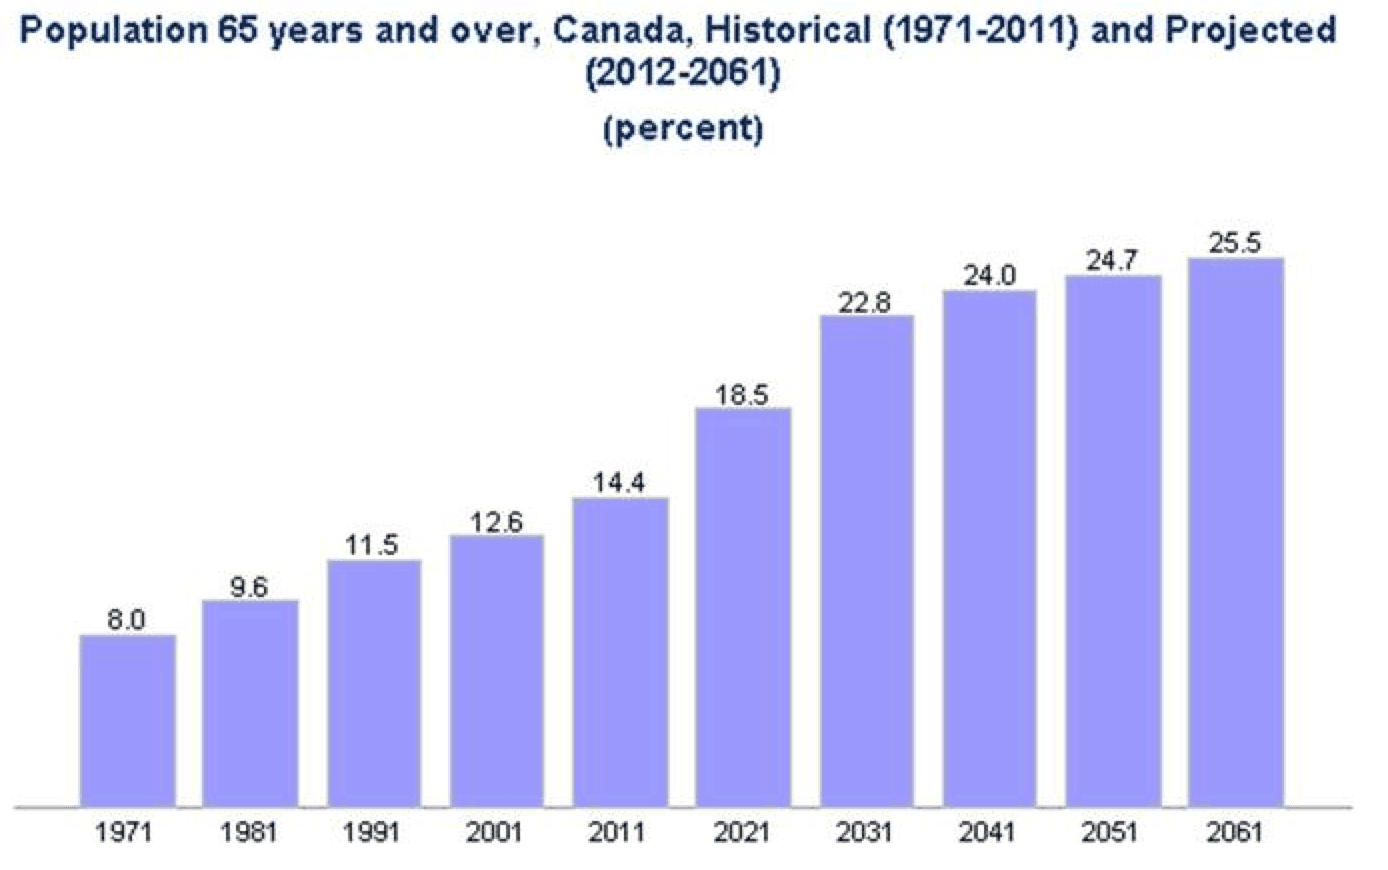
- About the only thing economists are able to predict with any accuracy is demographics. The chart shows the percentage of people in Canada, age 65 years and over and projected. The first Baby Boomers turned 65 in 2010 and the sharp upward projection shows the unprecedented number of new retirees in the future. For the first time ever, by 2016, there will be more Canadians over 65 than there are under 14. As people live longer, the percentage of non-participants in the labour force will grow. There will be extreme pressure on the health care system, pension plans and other social spending platforms. Those preparing to enter the workforce should take note of the risks and opportunities when choosing their careers.

- 18. The success of B.C.’s carbon pricing policyChris Ragan, McGill University
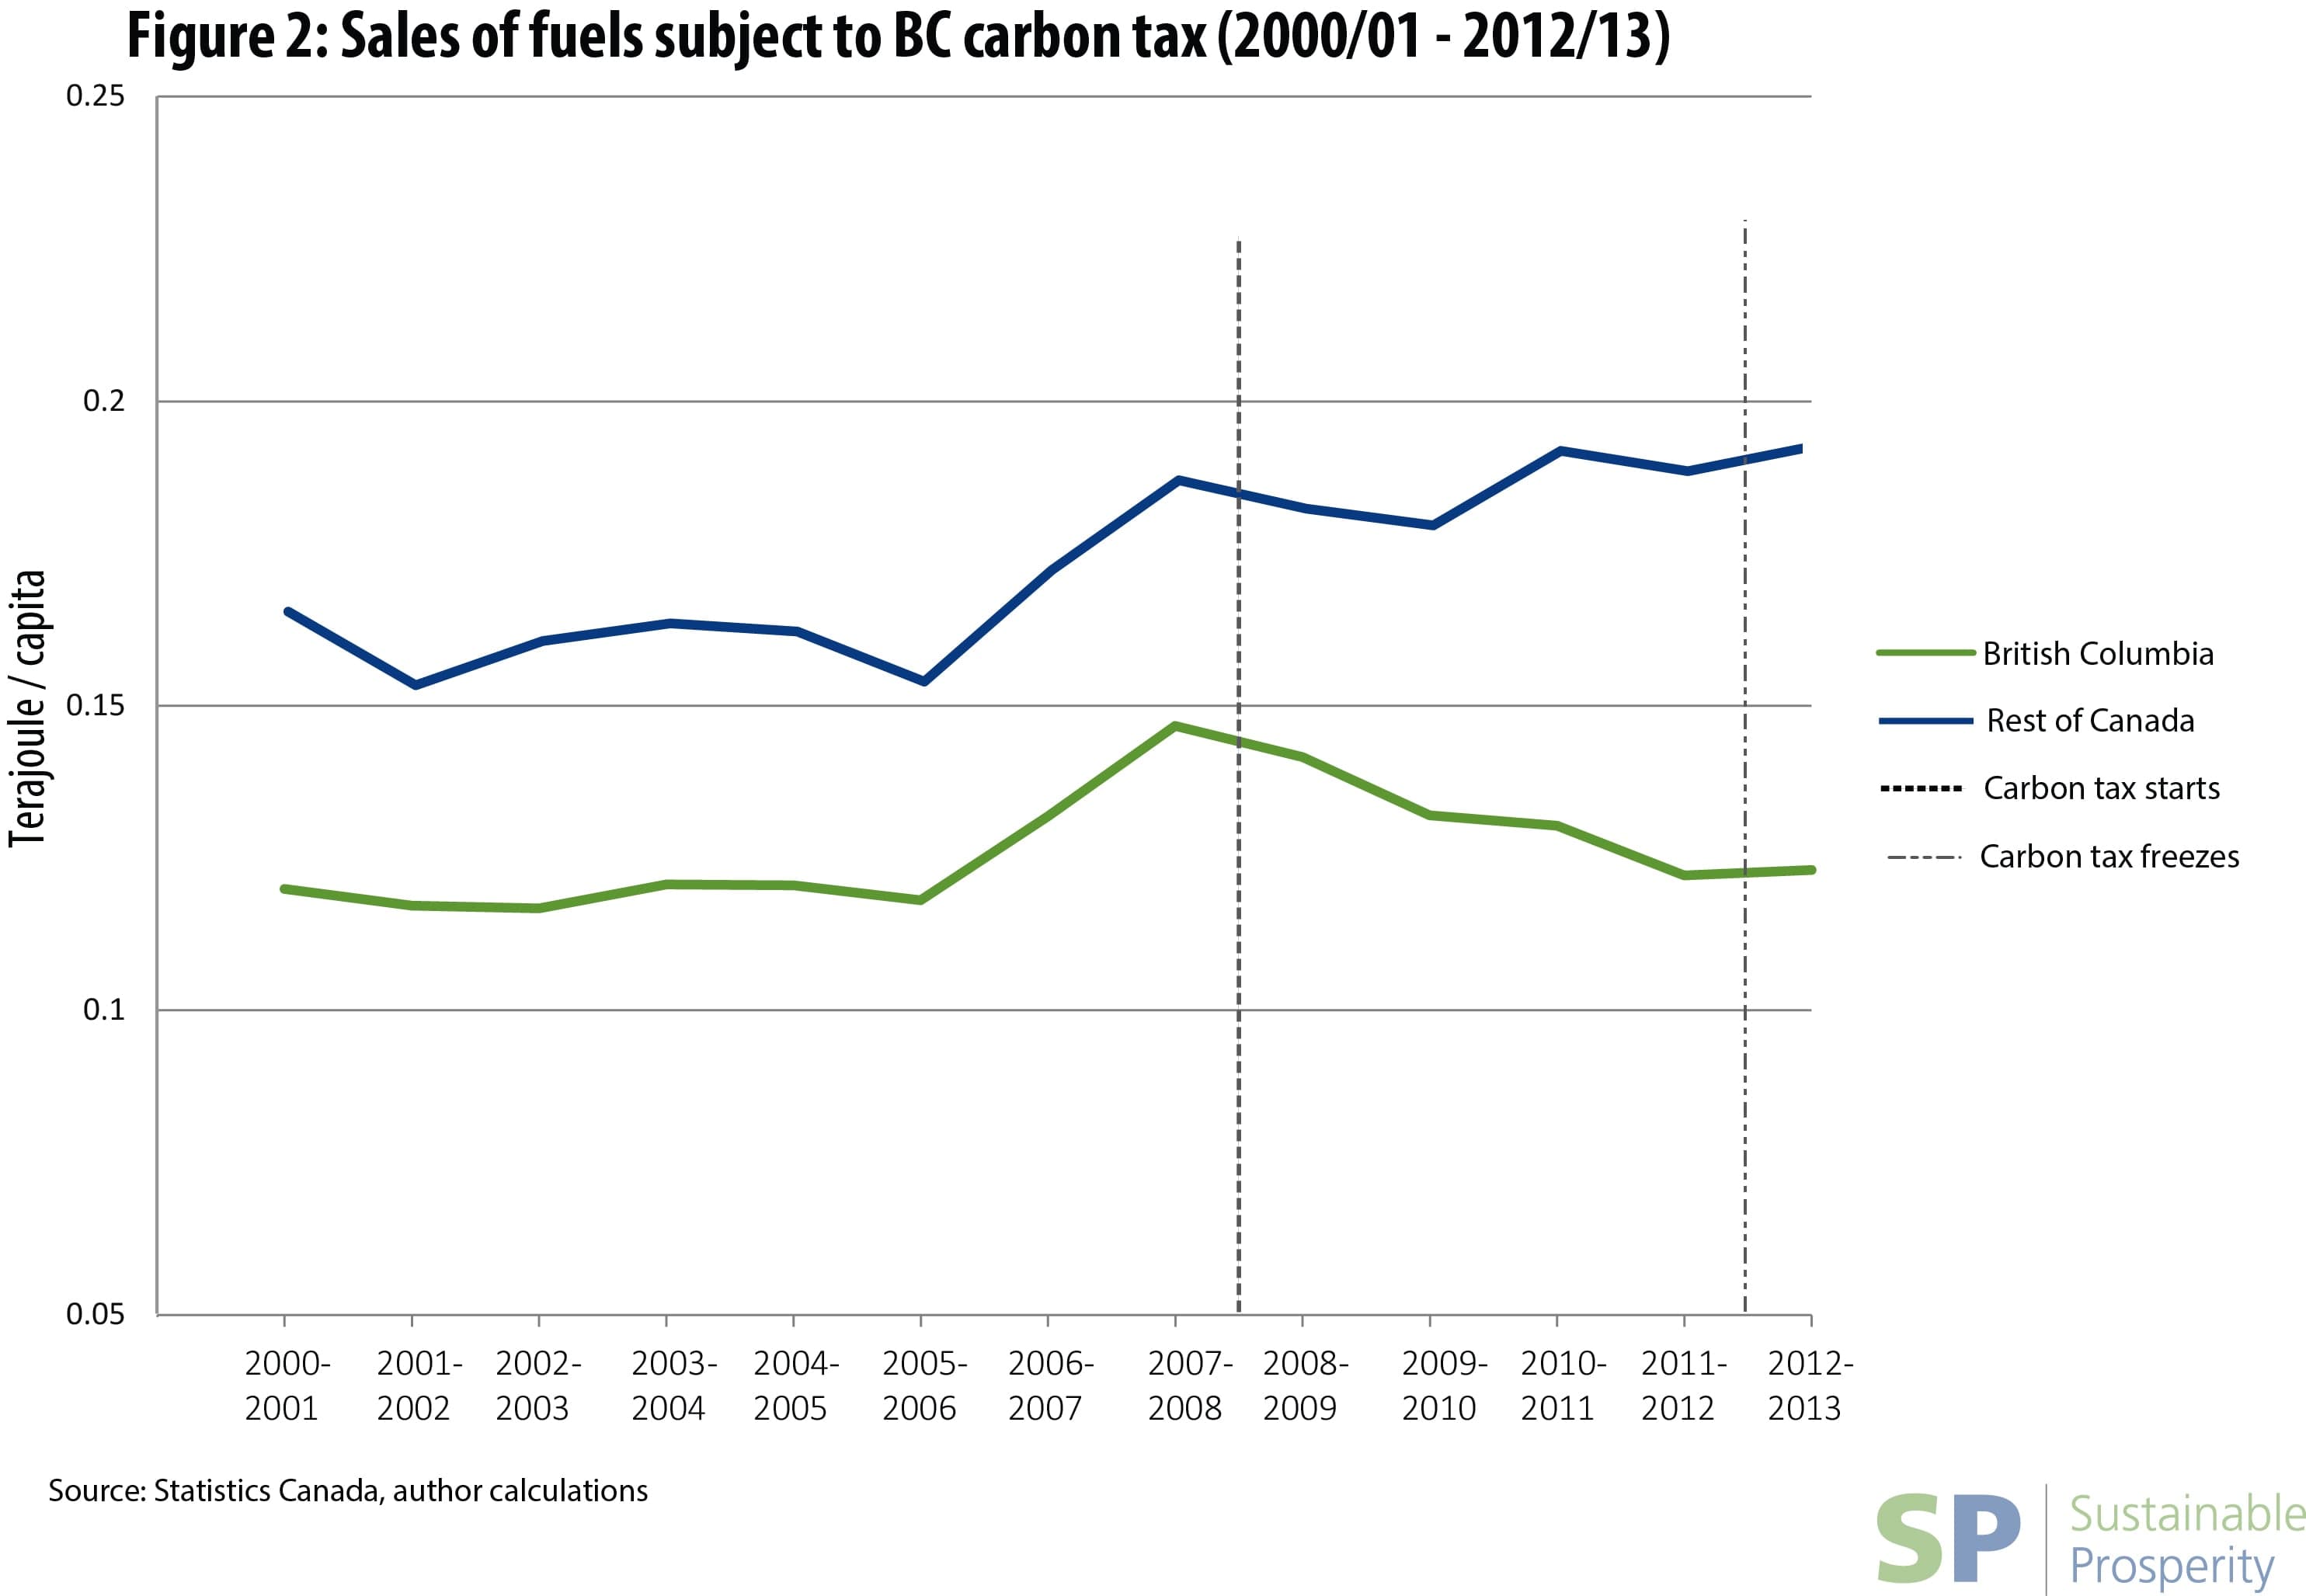
- The relationship between our economy and the environment has been one of the most important and prominent discussions of the past year, globally and here in Canada. We are approaching a turning point in that discussion—a realization that it is both necessary and possible to build a strong economy underpinned by the health of our land, air and water. We have a real opportunity in the year ahead to focus on practical solutions for achieving that goal. As an economist, I believe that opportunity lies in redesigning our provincial and municipal fiscal structures to encourage the positive economic activities we want (innovation, investment and better jobs) while discouraging the harmful ones we don’t want (pollution and escalating greenhouse gas emissions). B.C.’s revenue-neutral carbon pricing policy is a textbook example of how this can work successfully. As the chart below illustrates, in the five years since the introduction of the policy, B.C.’s fuel use (the main source of greenhouse gas emissions) has dropped 16.1 per cent; over the same period without carbon pricing in the rest of Canada, fuel use has risen. Of course, the chart does not establish a strict causal effect of B.C.’s policy, but it is very suggestive. In addition, the chart does not show that, over the same period, B.C.’s GDP kept pace with that in the rest of Canada. Nor does it show that, as a result of personal and corporate income-tax cuts enshrined in the policy, B.C. now has among the lowest personal and corporate income tax rates in the country. Most Canadians agree that we should not have to sacrifice our economy for our environment, or vice versa. Examples like this show we don’t have to.
- 19. A potential rough patch for oilAndrew Leach, Alberta School of Business, University of Alberta
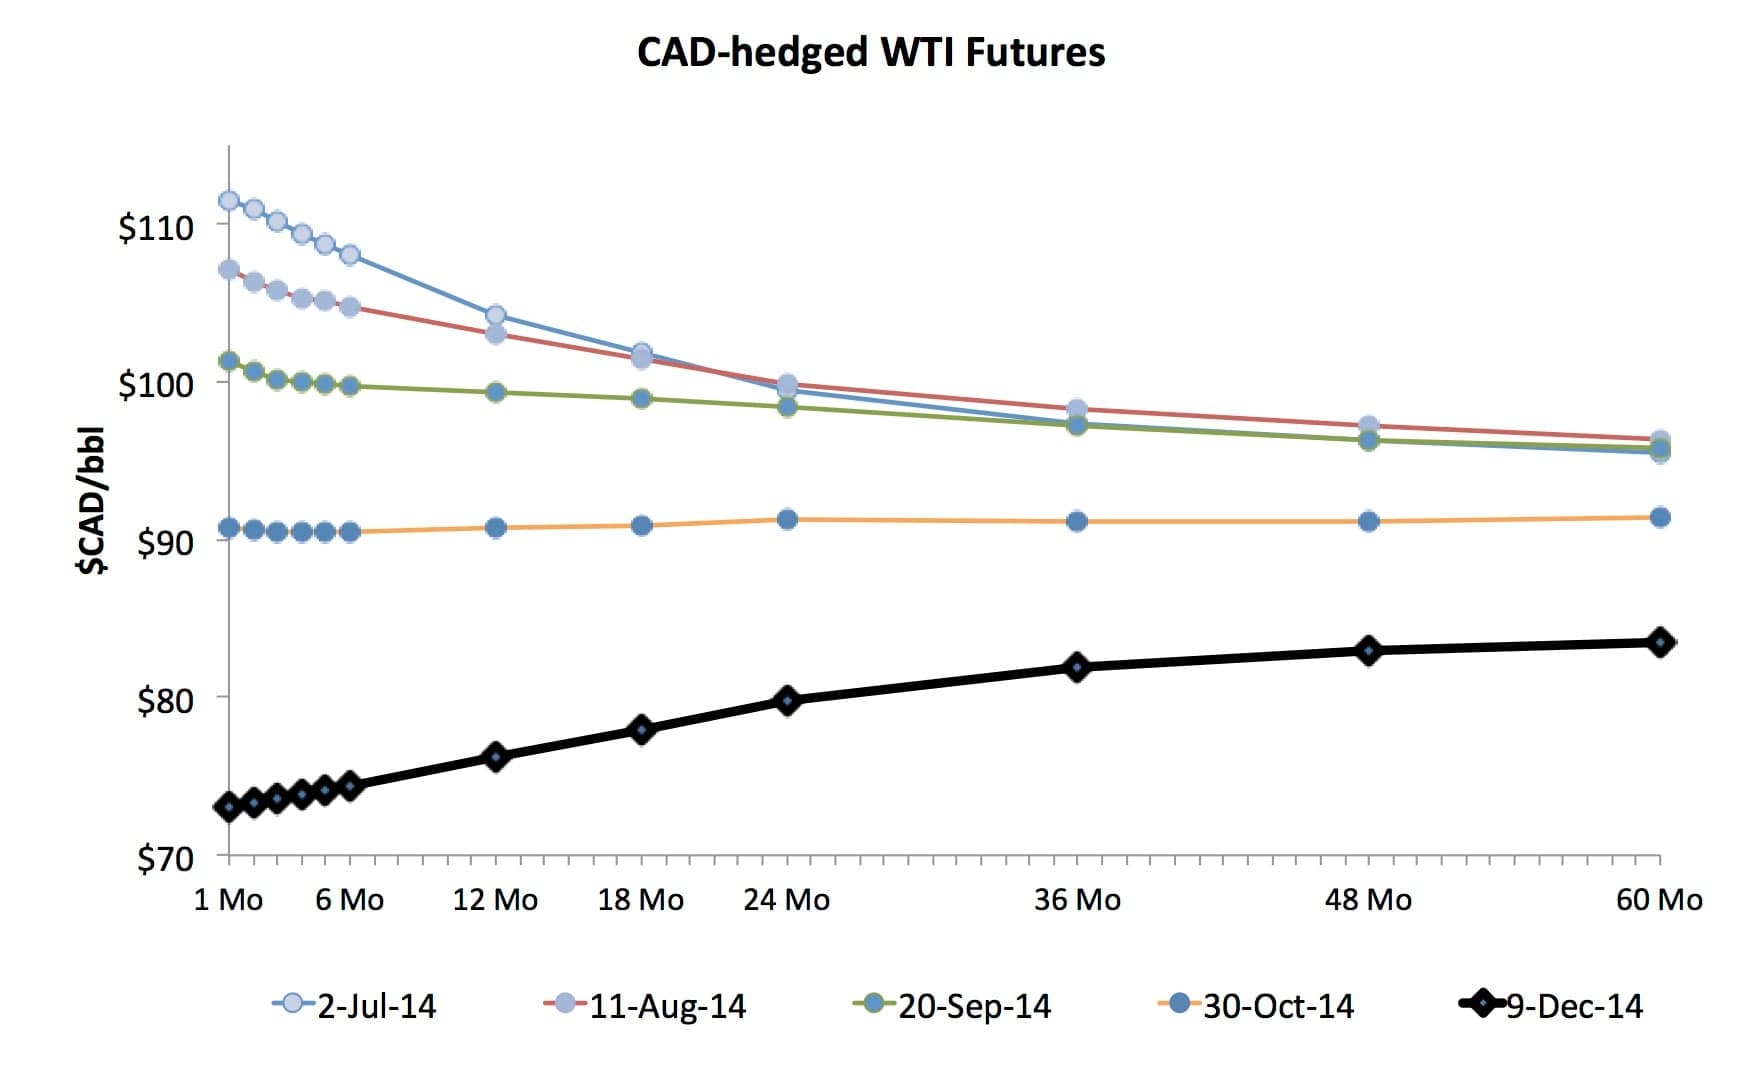
- Without a doubt, the story of the second half of the year is the drop in global oil prices, and the way it’s hit Canada. Initially, through July and August, world oil prices dropped, but Canadian producers were sheltered by a weaker Canadian dollar. Even into September, the long-run view in the market was that oil prices would recover. That started to change in mid-October, and now the story seems to get worse every week. If the future prices follow the expectations of the market today, it could be a long few years in Canada’s oil patch.

- 20. The shift to temporary foreign workersArmine Yalnizyan, Canadian Centre for Policy Alternatives
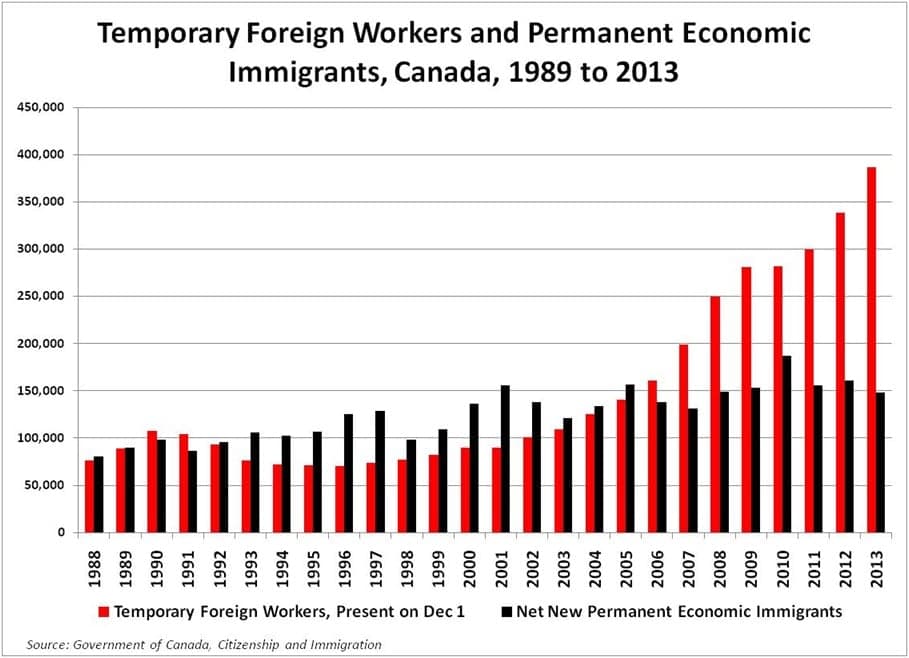
- Every passing year creates more pressure to articulate a national strategy that will deal with replacing an aging labour force. It seems one has snuck up on us, with the de facto preference of temporary foreign workers over permanent economic immigrants. Growing public concern about how this program is being used (and abused, in some cases) is appropriate. Migrant workers can plug labour shortages and help the economy grow, but distribution of the gains from growth will become ever more lopsided. This is a radically new policy thrust in Canada, one that dramatically shifts bargaining power away from workers, reduces opportunity, and increases inequality by design. It redefines the future of Canada, a nation built by immigrants who had a stake in how their families helped communities, markets and politics to evolve. It cheapens us all to view migrant labour as the fix to growing labour shortages: good enough to work here, but not good enough to stay and build their lives.
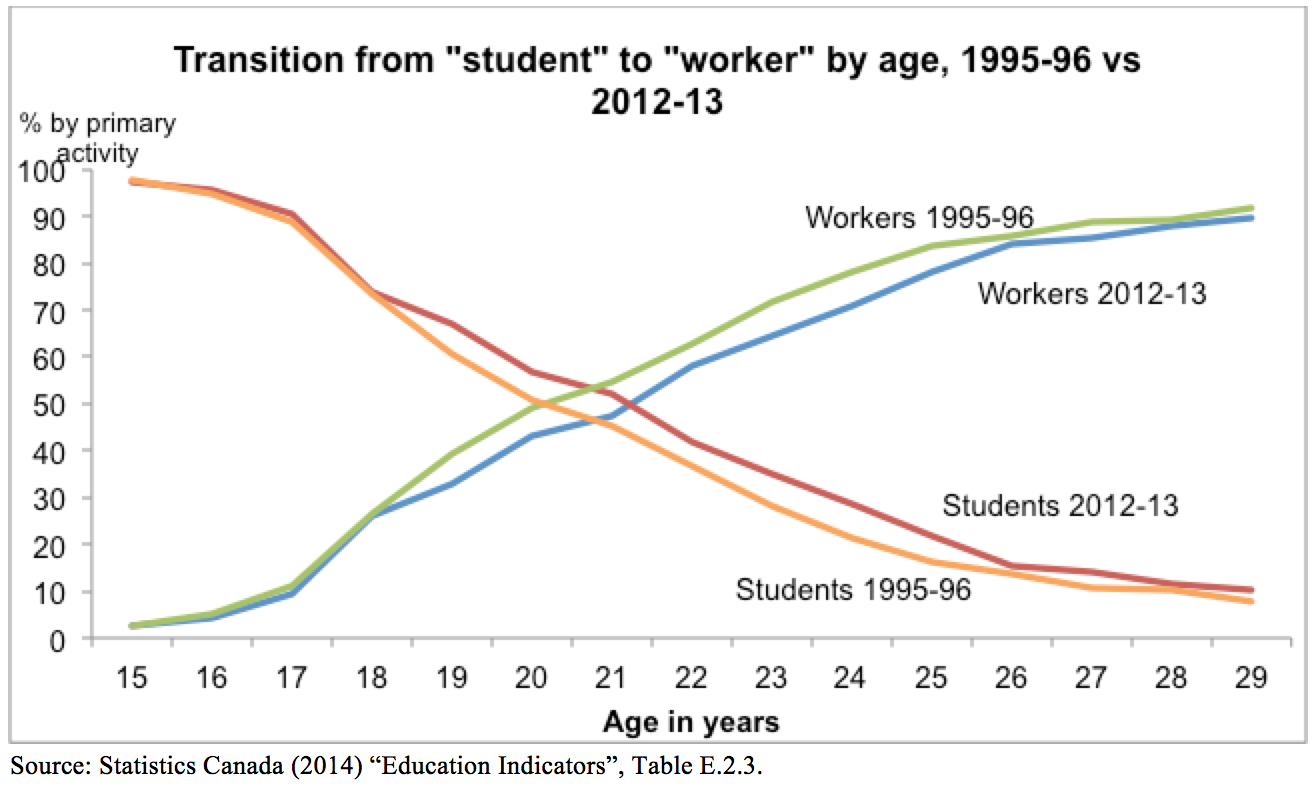
- 21. Students delay entering the workforceJennifer Robson, Carleton University

- This chart shows the change in youth transitions from school to work. It shows the percentage of Canadian youth (aged 15 to 29) who were primarily “students” and primary “workers” (not in school anymore) by age. The point where those diagonal lines intersect is what the Organization for Economic Co-ordination and Development calls the transition age—the age when more youth are working than studying. The chart below compares that transition point for 1995-96 (the earliest year available) and 2012-13 (the most recent year available). The key thing is that the transition age went up by more than a year in that time period. The longer and later school-to-work transition is real. This may not be a problem in the strictest terms; maybe delayed transitions in youth pay off over the long run in higher lifetime earnings. I don’t think we know. In the meantime, pretending this isn’t happening is probably unwise. Do governments need to make any policy changes (to education planning and finance) to be responsive?
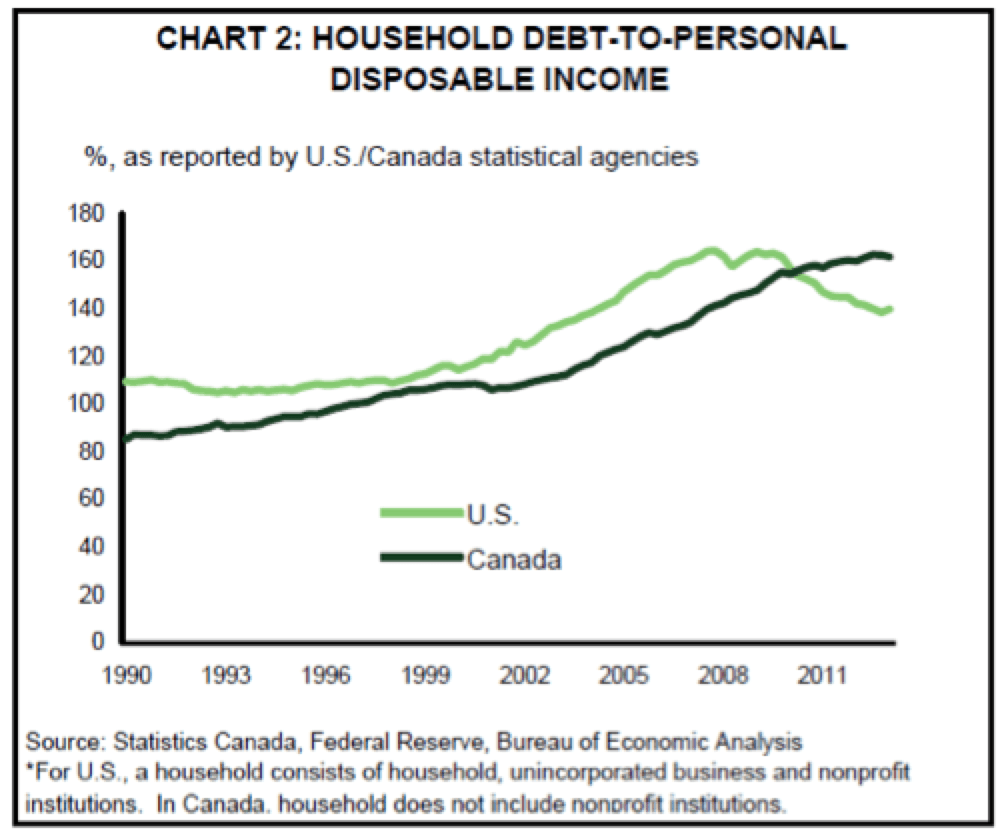
- 22. Canadian household debt looks disturbingly familiarBen Rabidoux, North Cove Advisors
- It’s hard to miss the parallels between U.S. credit growth leading up to their crisis and the Canadian profile today. Also noteworthy is the unprecedented gap between Canadian and U.S. household leverage. Despite overall stronger underwriting by Canadian lenders, households remain very vulnerable to a downturn in employment or a rise in interest rates.
- 23. Oil and the loonieMartin Pelletier, TriVest Wealth Counsel
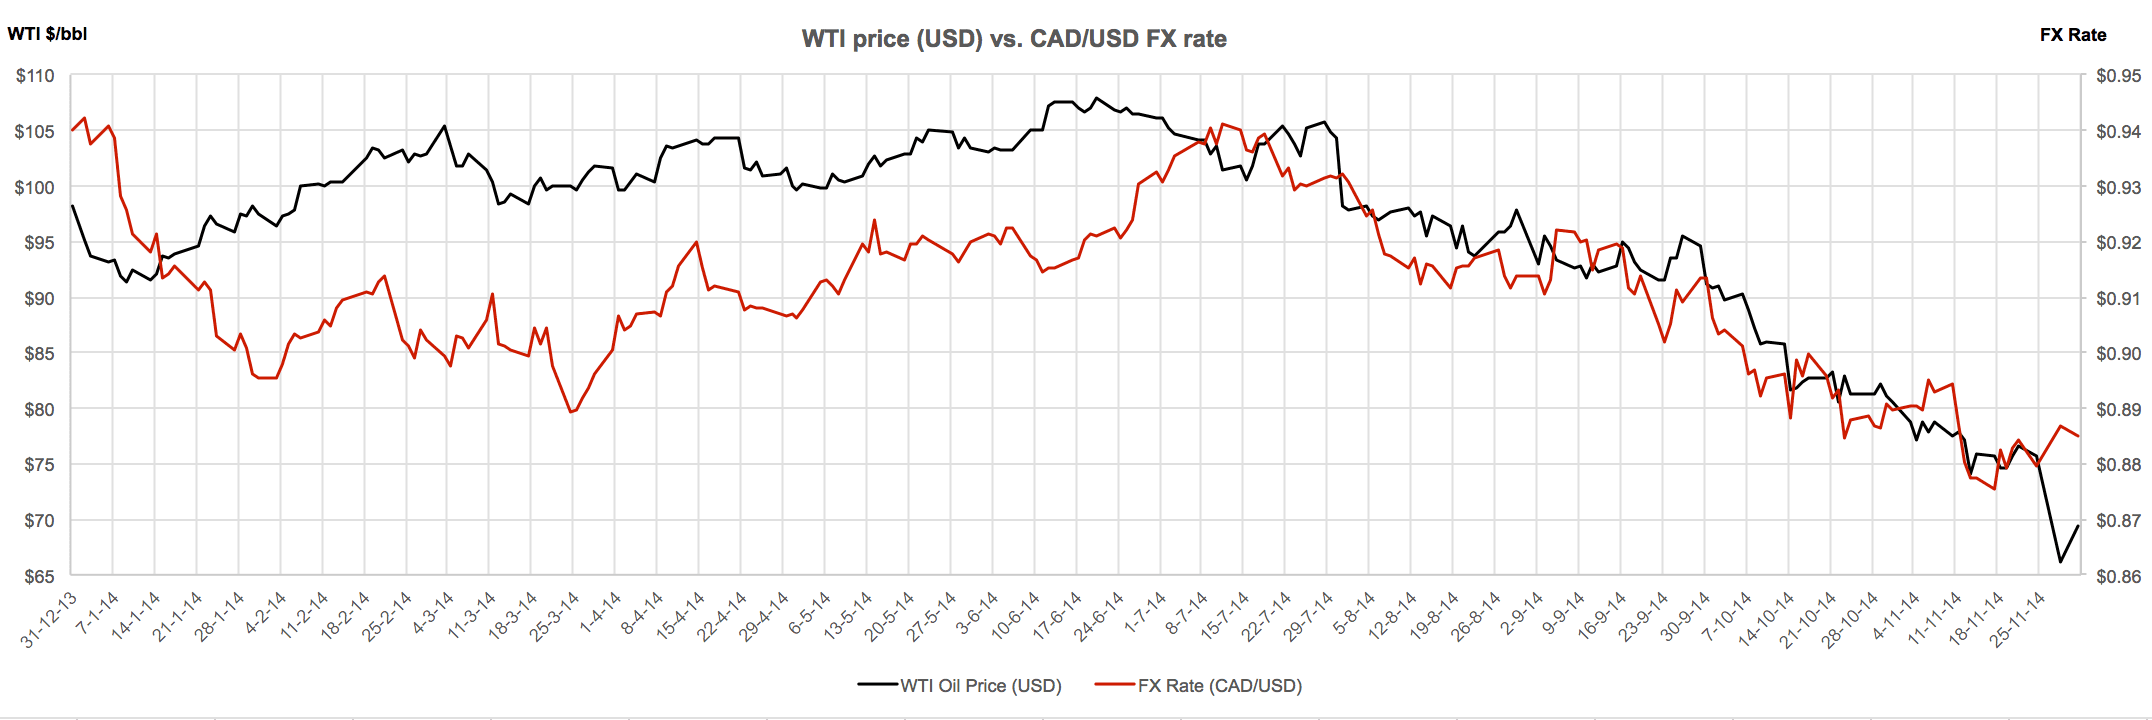
- Of all the statistics to follow, we believe two stand out in importance: the value of the Canadian dollar relative to the U.S., and oil prices. Canada and the U.S. currently have the largest trade relationship in the world, with energy being a significant component of our cross-border commerce. A weakening Canadian dollar should have a material impact on our economy by stimulating trade, in addition to softening the impact of weakening oil prices.
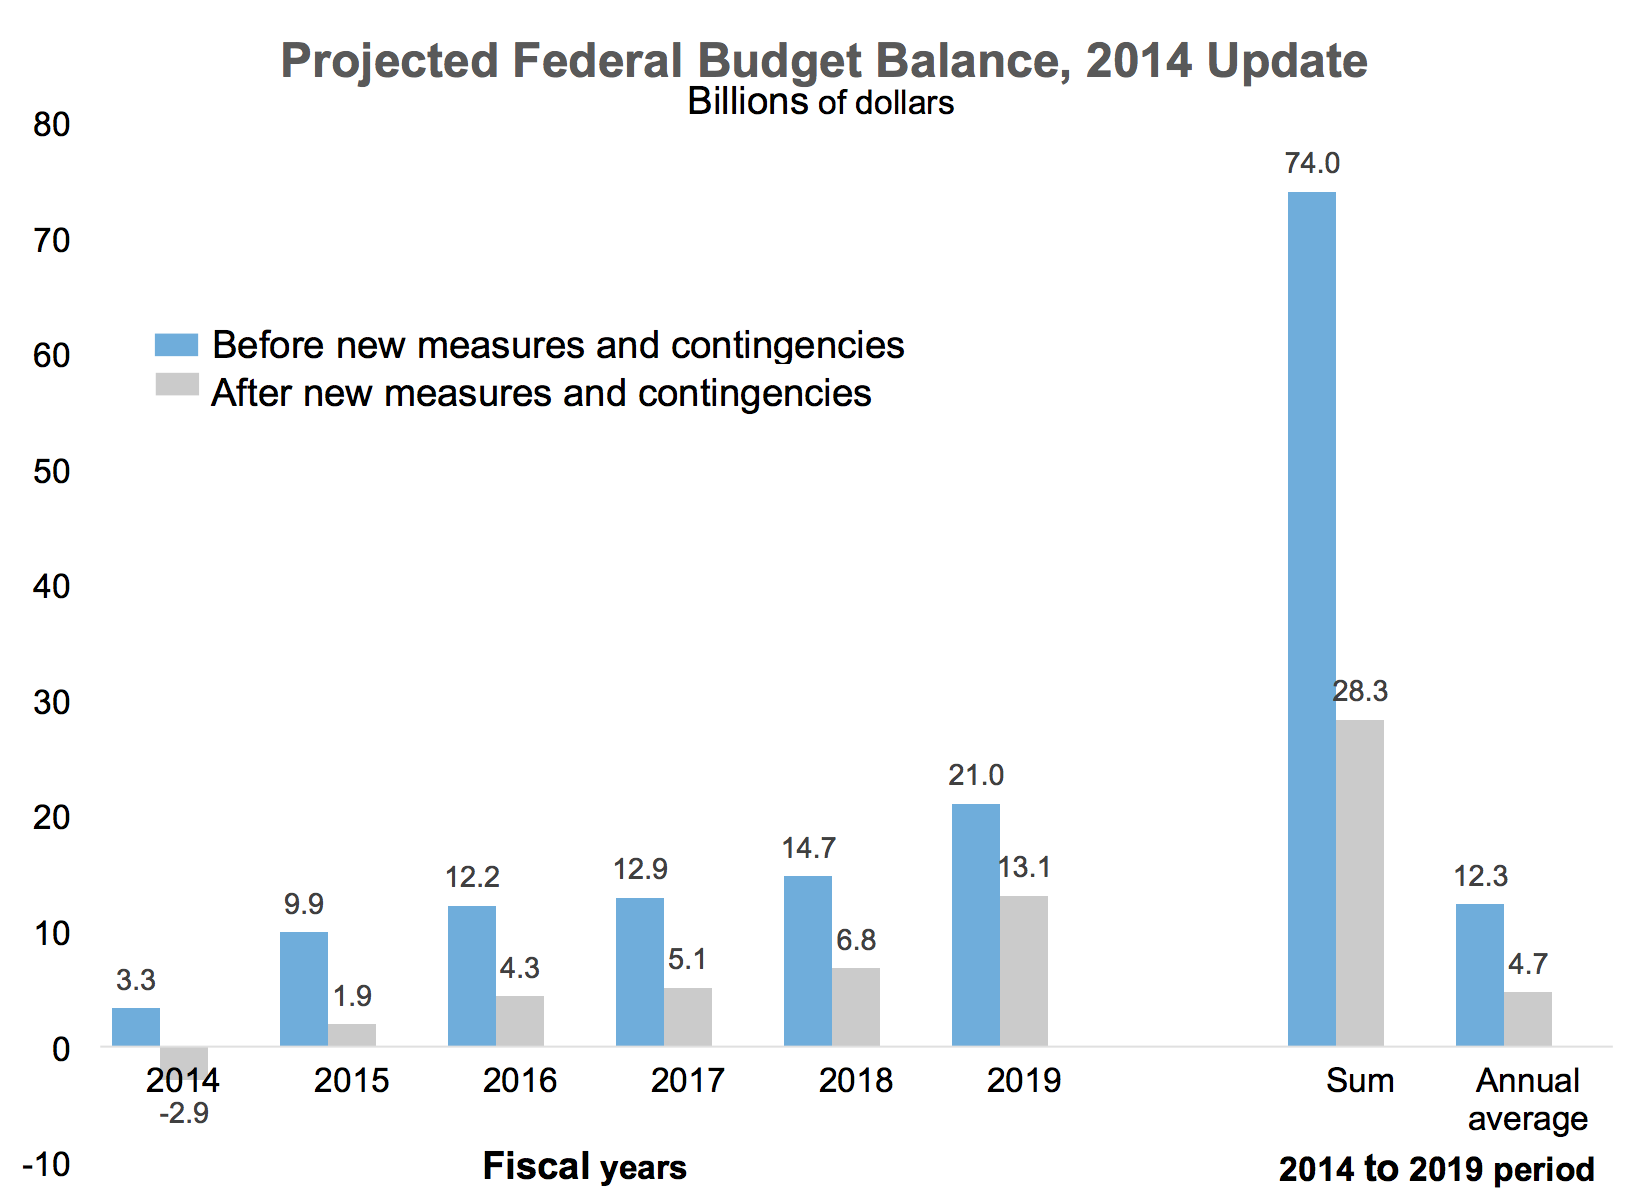
- 24. No fiscal room to manoeuvreStephen Tapp, Institute for Research on Public Policy
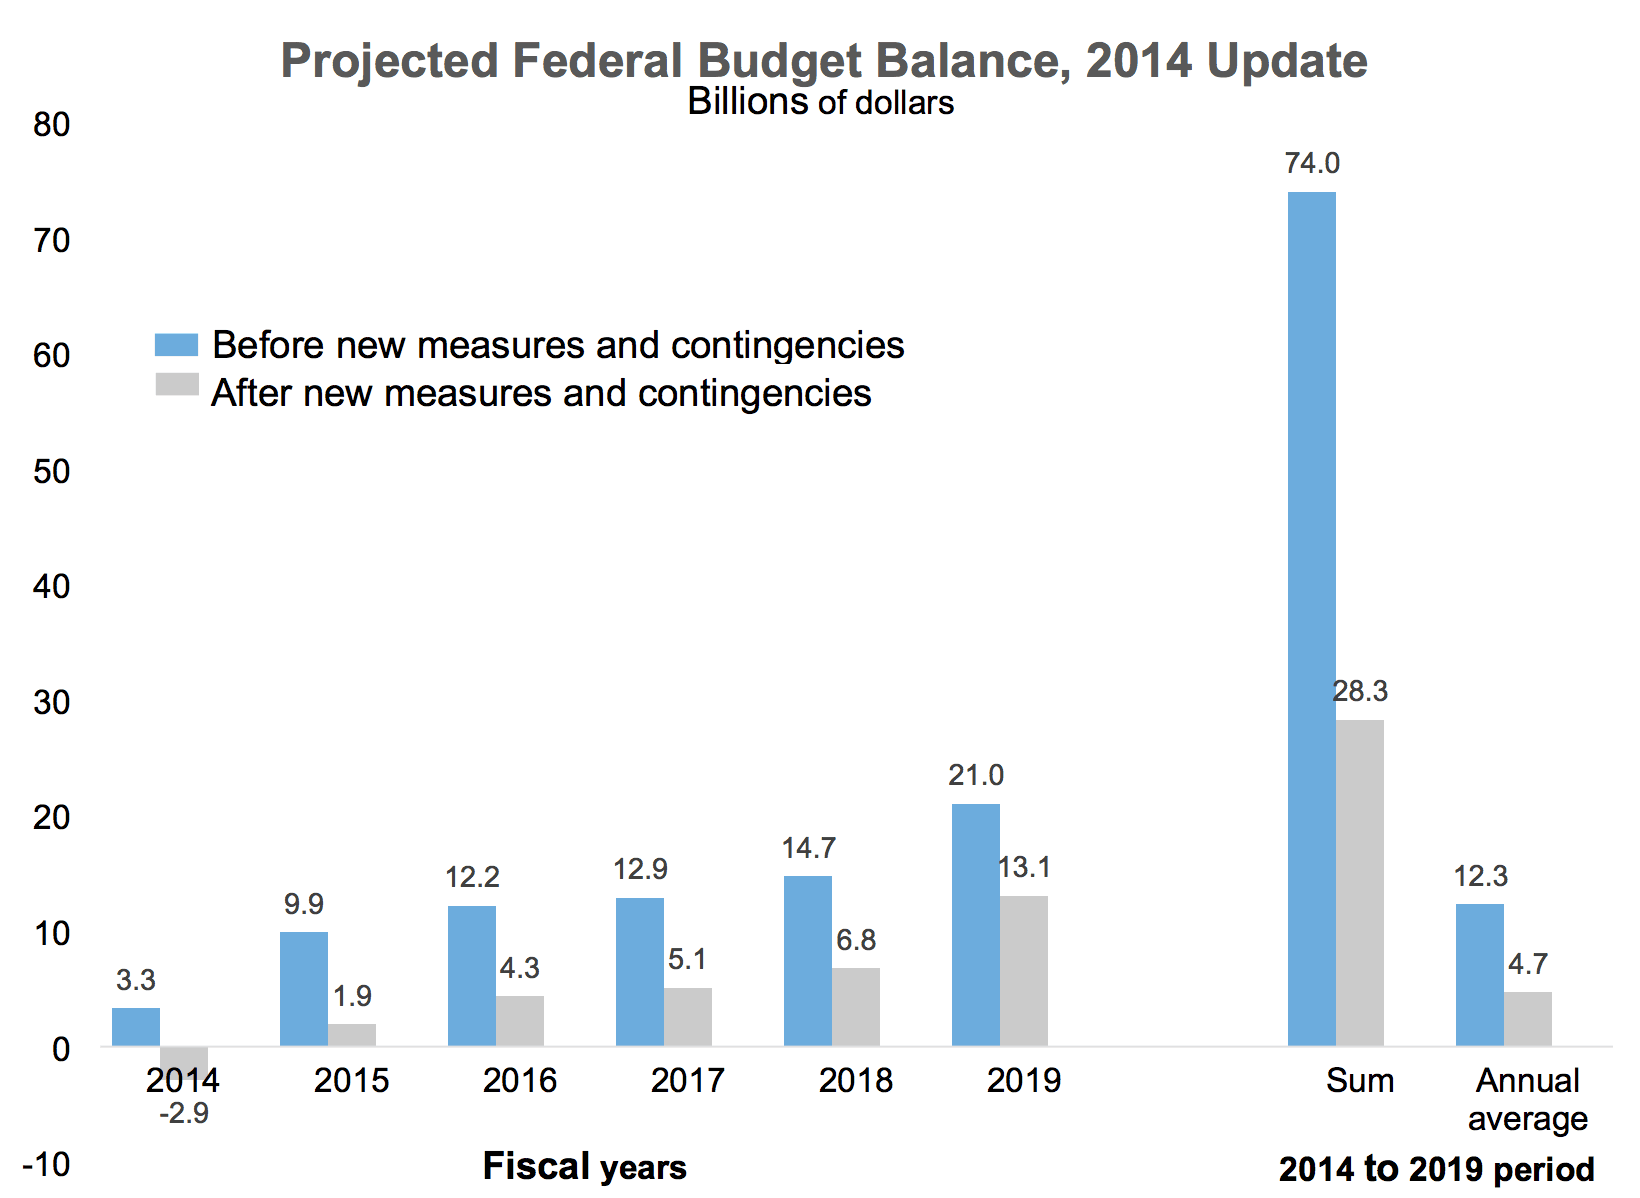
- This figure provides important context for the 2015 federal election, where the government’s fiscal approach is clear: lower taxes (e.g., income-splitting), continued spending restraint, and a plan to introduce balanced-budget legislation. The blue bars in the figure show the status quo fiscal path before this year’s new measures and contingencies. The grey bars show what remains after recent policy announcements and contingencies. This demonstrates how the government has enjoyed "first-mover advantage" in allocating anticipated federal surpluses. Since there is considerably less fiscal room available—down from roughly $74 to $28 billion, summed over this and the next five fiscal years—opposition parties face the challenge of undoing recent moves and/or providing distinct policy approaches that emphasize a larger role for the federal government in Canada.
- 25. Canada is underexposed to growing emerging marketsAilish Campbell, Canadian Council of Chief Executives
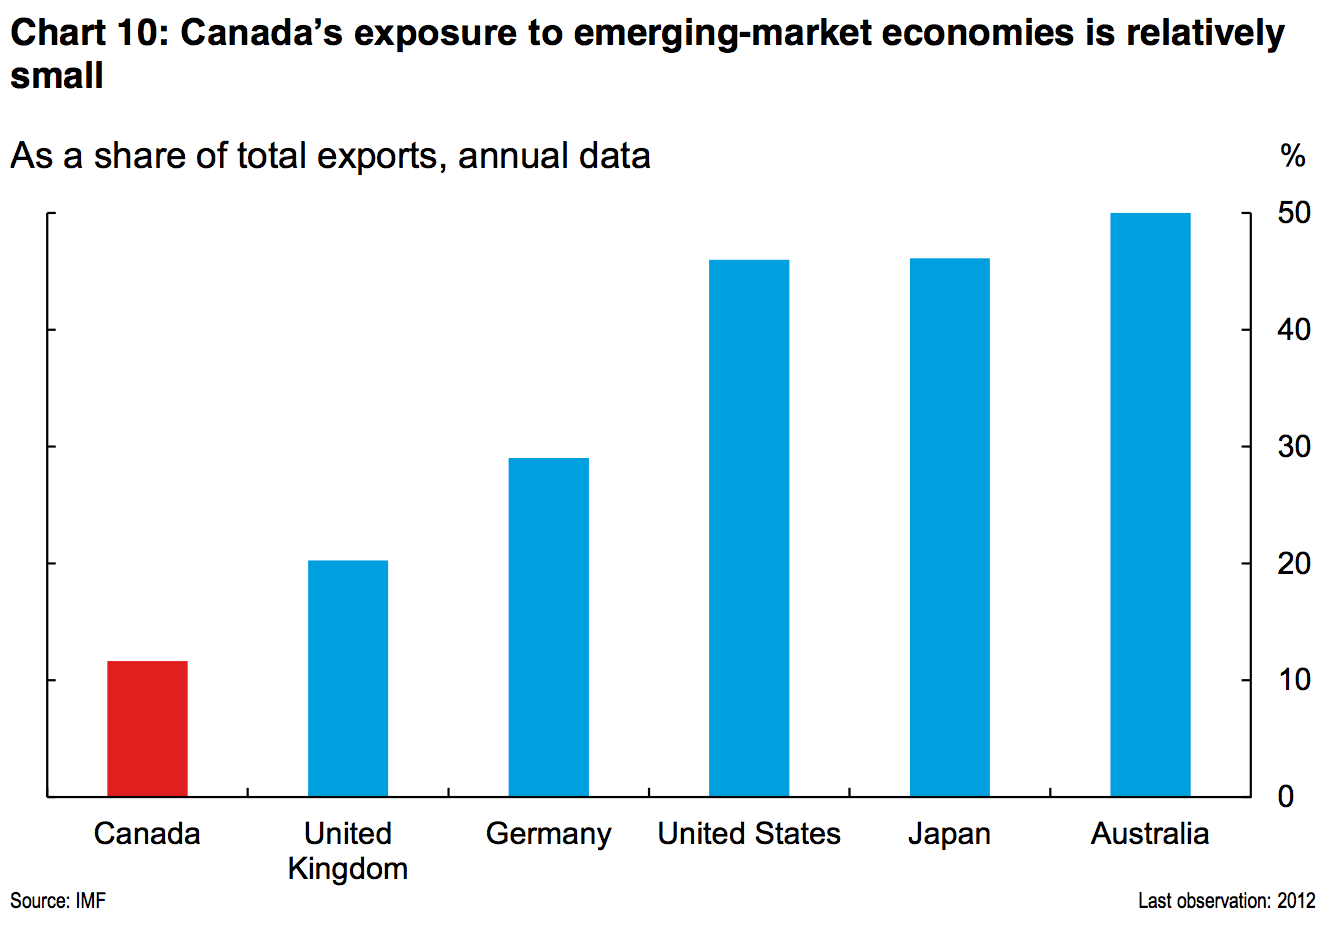
- Canada’s economic success will always be linked to U.S. demand. But, over my lifetime, and that of my children, demand in emerging markets such as Mexico, China and India will boom due to a growing middle class. This chart shows how under-exposed Canada is to these growth markets relative to our competitors. Increased exports to emerging markets, and growing the presence of Canadian firms in these countries, are critical to Canada’s future well-being.

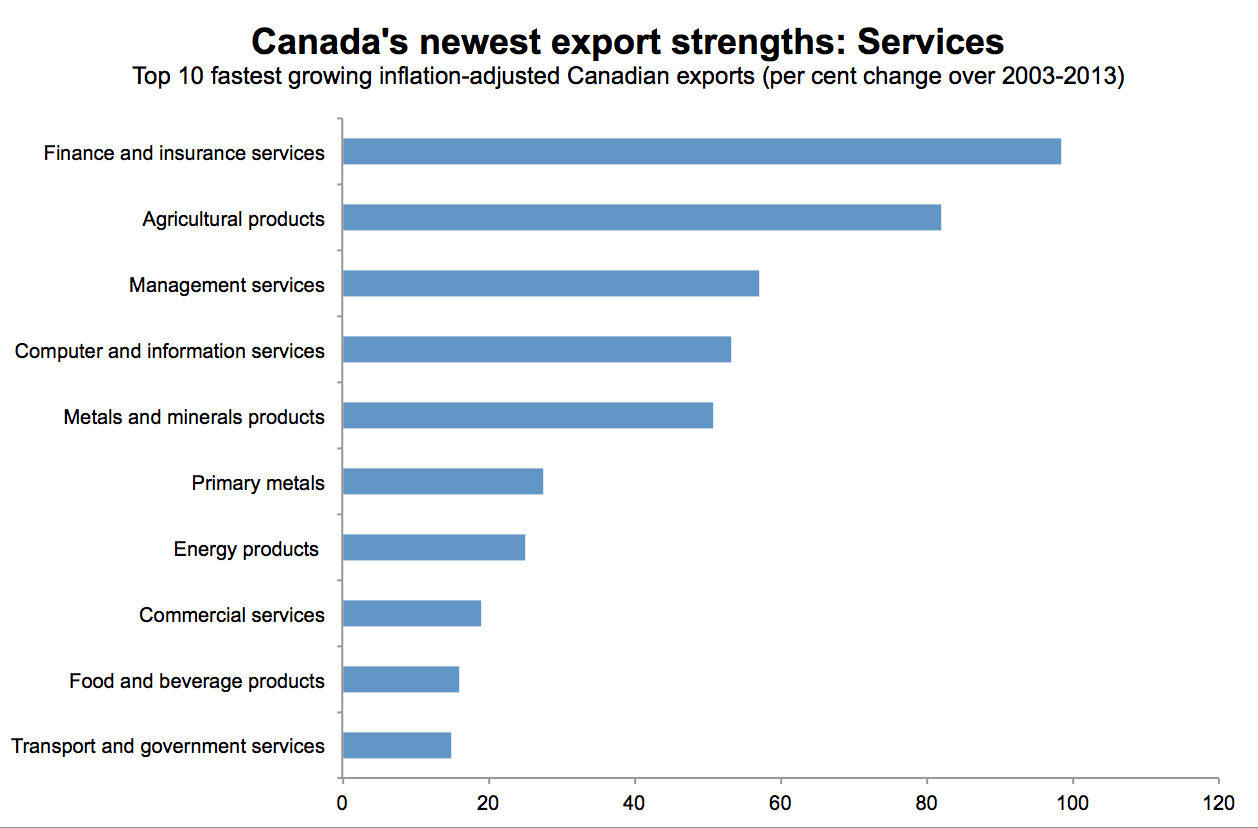
- 26. The world wants Canada’s servicesDanielle Goldfarb, Conference Board of Canada

- With constant news coverage of Keystone XL, combined with the iconic image of trucks crossing the Canada-U.S. border, Canadians might reasonably think this country only sells resources and manufactured products. But services (such as financial, IT, and business services) are quietly accounting for some of Canada’s strongest trade growth and, by extension, growing their contribution to Canadian living standards. The world not only needs Canadian resources and products, but also our less visible expertise and services.
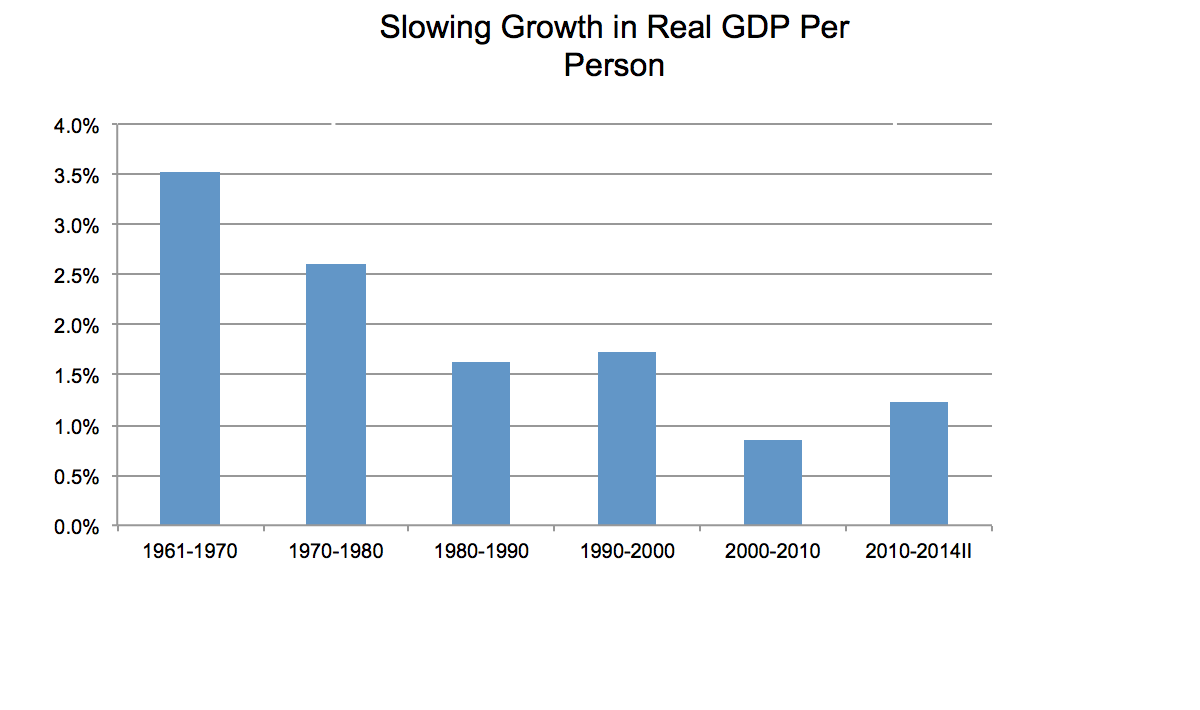
- 27. Canada’s productivity is weakeningMike Veall, McMaster University
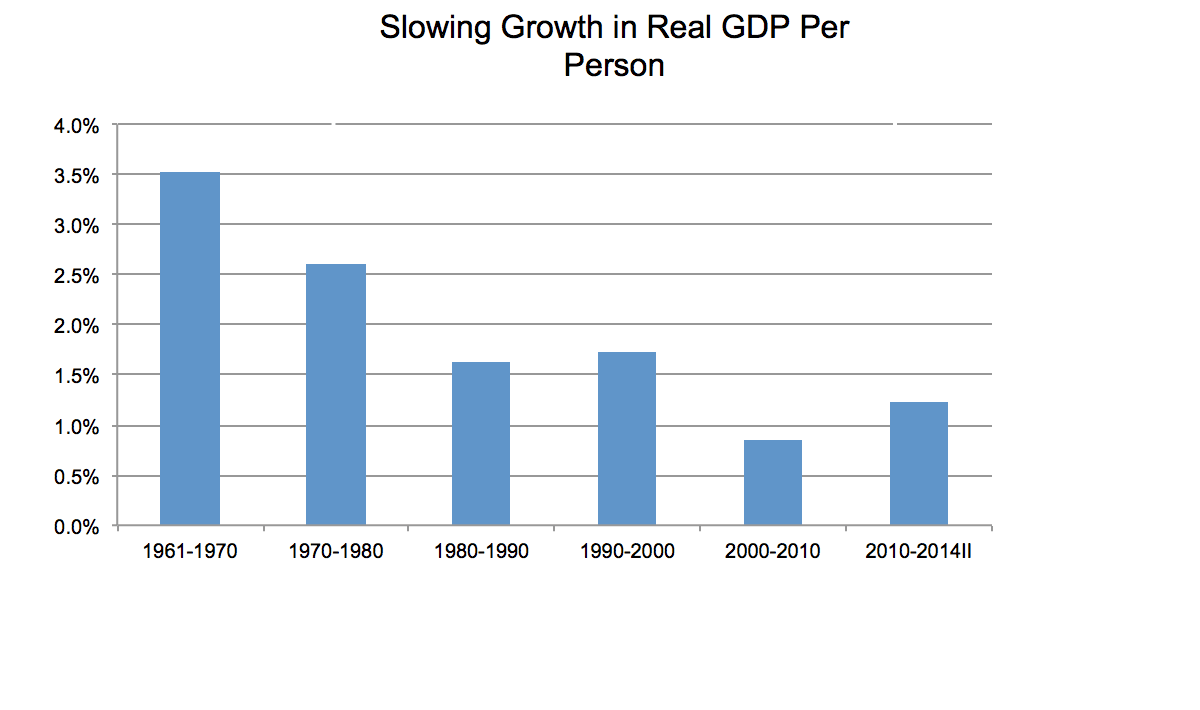
- The mild recovery does not disguise the long-term trend to lower growth in output per person. That is slowing the rise of Canada’s standard of living and making it difficult for governments. As Paul Krugman has written, "Productivity isn’t everything, but, in the long run, it is almost everything."
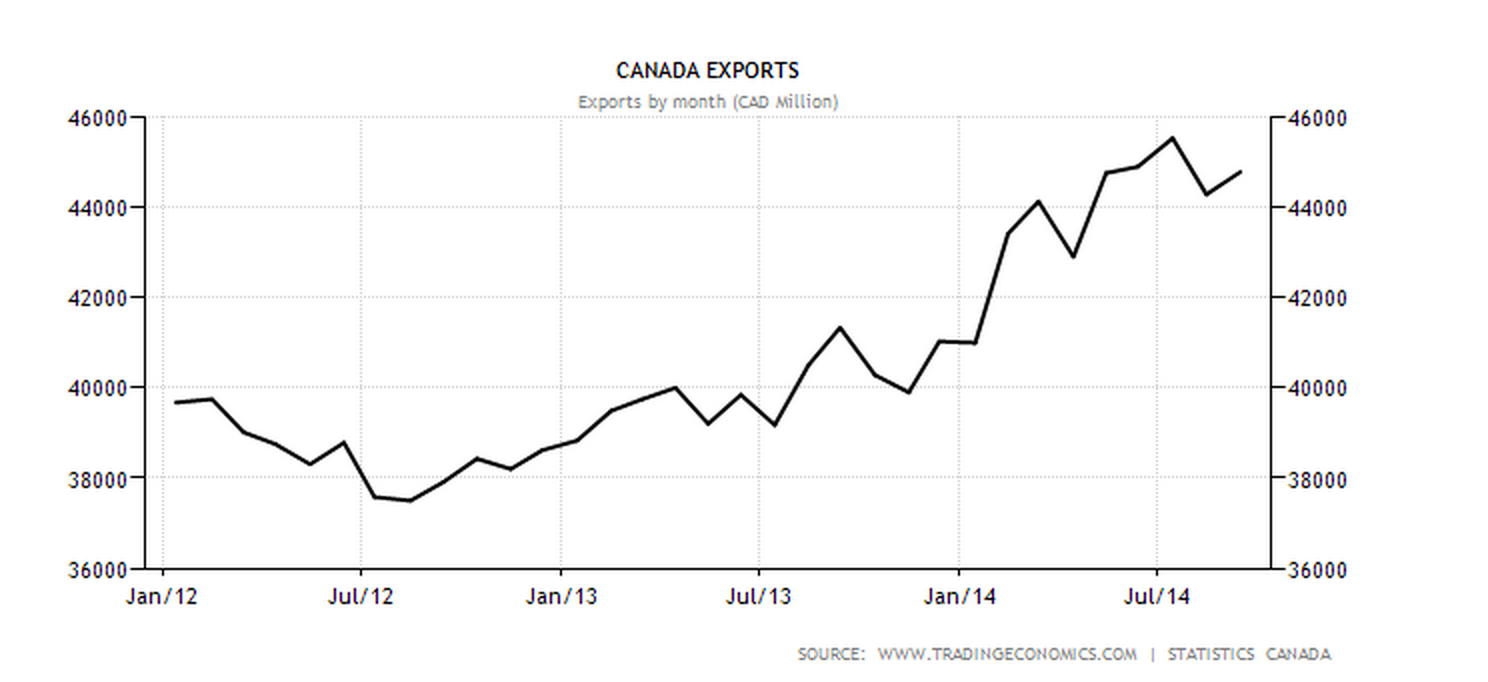
- 28. An export recovery will help OntarioMike Moffatt, Ivey Business School, Western University
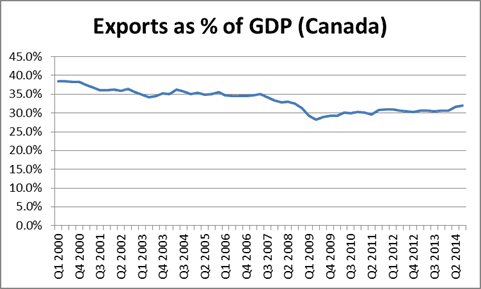
- Exports have finally started to recover in 2014, but are still well off the levels of a decade ago. While it is true that exports are a cost (as Stephen Gordon is fond of saying), they are necessary to obtain imported goods, machinery and equipment. If exports could return to the 35 per cent of GDP levels of the mid-2000s, this would mean an extra $50 billion per year in sales for export-intensive regions such as southwestern Ontario. The recovery of these regions is dependent on an export recovery, so watch the trade data closely in 2015.
- 29. Canada tops OPEC as a supplier to the U.S.David Watt, HSBC
- A critical and historic crossover looms. Canada has long been the largest single-country source of oil imported by the U.S. Canada is now poised, for the first time, to overtake all of OPEC as a source of oil imported by the U.S. While U.S. oil production has soared, and imports have declined, the U.S. has continued to take increasing volumes of Canadian oil. We don’t expect that to change. This upswing in U.S. imports of oil from Canada has unfolded, despite the ongoing delays affecting the Keystone XL pipeline, and will continue, even as Keystone XL is delayed further. The recent upswing in Canadian oil exports, and the increases to come, will largely be carried by rail.
- 30. The outlook is good for high-end manufacturingPhilip Cross, Macdonald-Laurier Institute
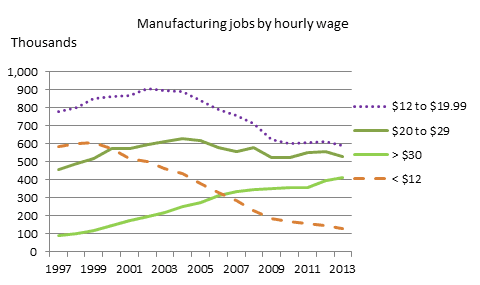
- This chart shows that manufacturing in Canada has a bright future. In 1997, two-thirds of manufacturing jobs were low-paying (less than $20 an hour, with a good number less than $12). These jobs were the ones ravaged by global competition, the rising loonie and the recession. By 2013, what has emerged is that two-thirds of manufacturing jobs are high-paying (more than $20 an hour). These jobs survived the same challenges that destroyed low-paying jobs. (The ones over $30 did not even fall during the recession).
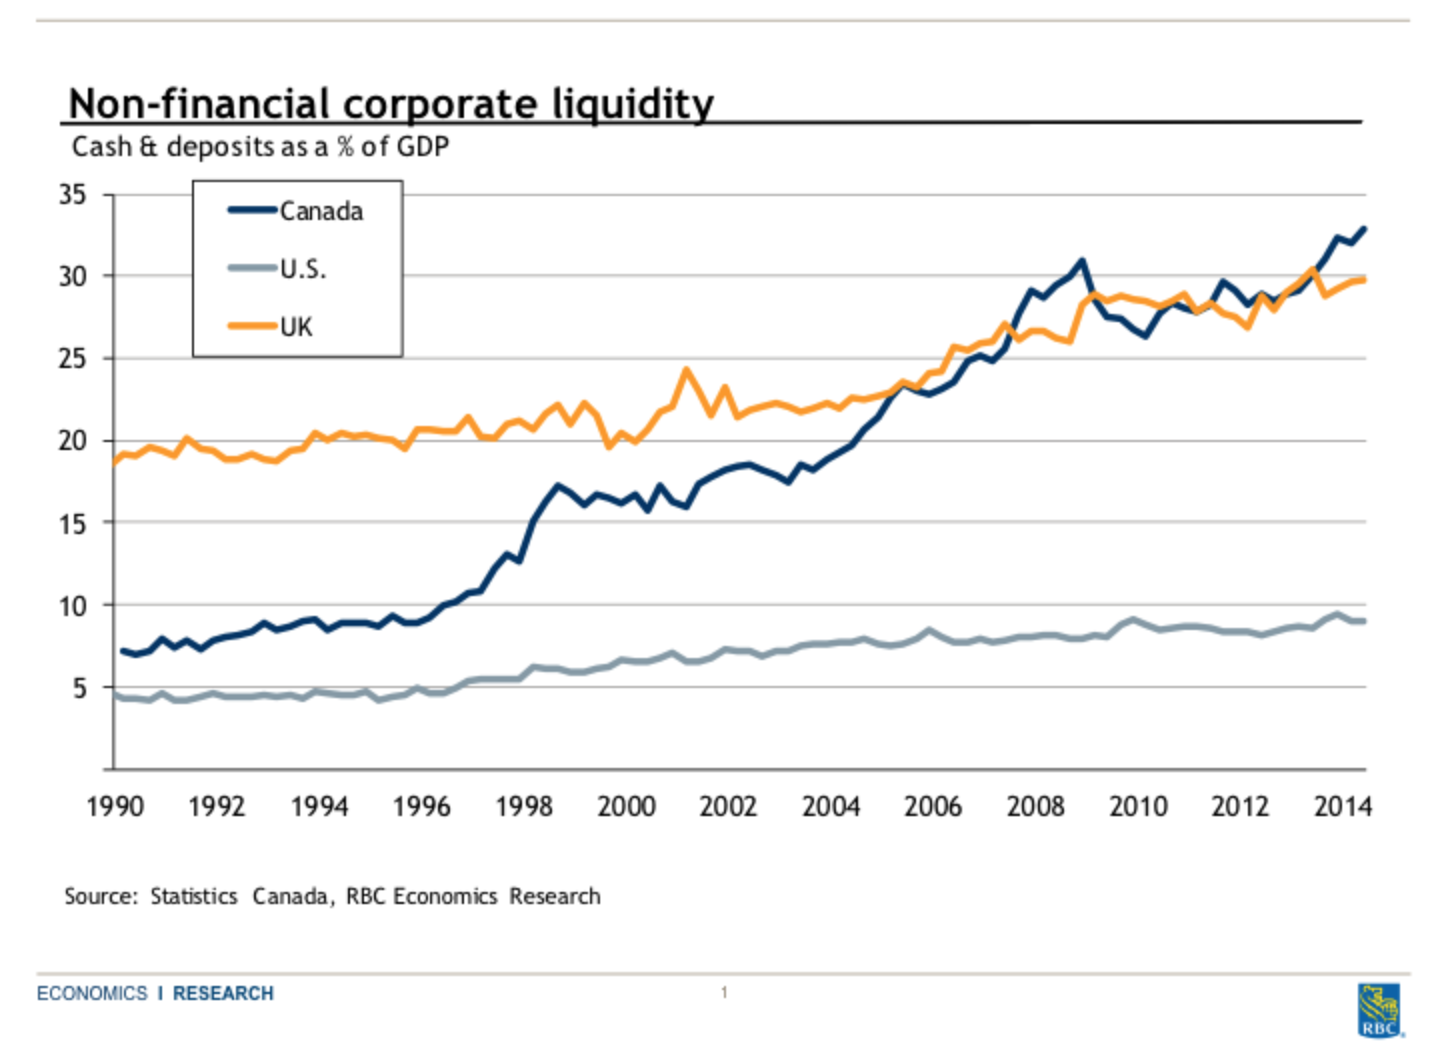
- 31. Businesses are well-positioned to investCraig Wright, Royal Bank of Canada

- We expect Canadian economic growth to accelerate from an expected 2.3 per cent this year to 2.7 per cent in 2015. As consumer spending slows, any acceleration in overall activity will depend on exports and investment activity rising. Exports have risen sharply on the heels of a stronger U.S. economy and a more competitive currency. We expect investment to accelerate in 2015, as demand improves and uncertainty eases. Corporate balance sheets are well-positioned to support investment in future, as liquidity has risen at the fastest pace within the G7 and currently sits at the highest levels on record relative to GDP. As we move forward, this liquidity will be put to work in the form of increased dividends, share buy-backs, mergers and acquisition activity and investment. The expected pick-up in investment is good news for short-term growth prospects and bodes well for a long-awaited rise in productivity.
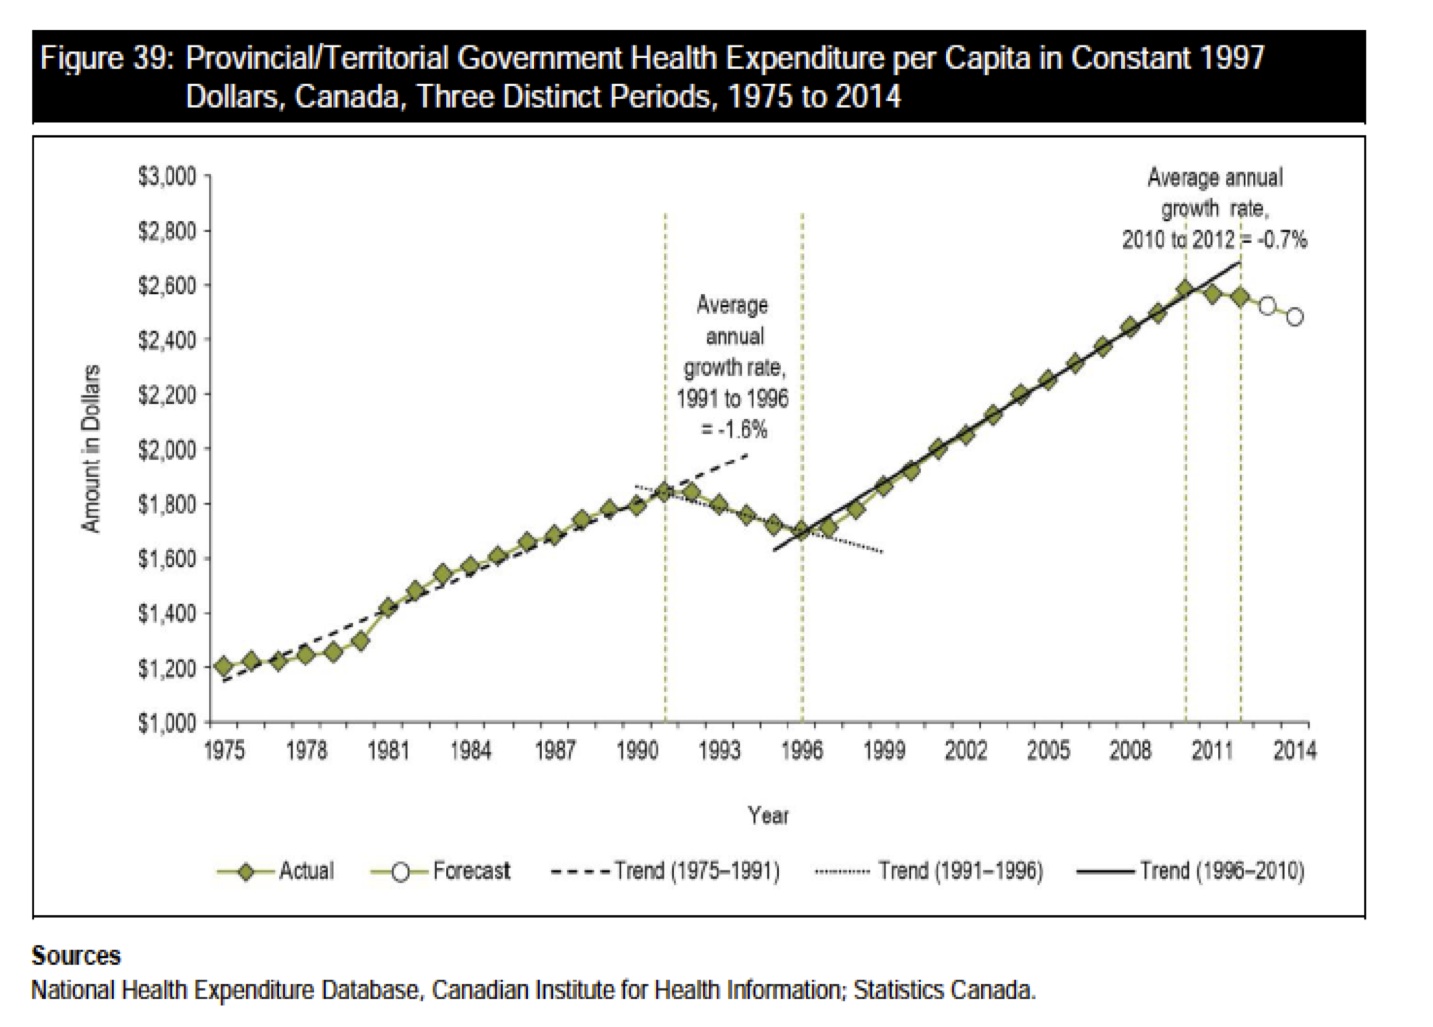
- 32. Health expenditures are falling, but for how long?Livio Di Matteo, Lakehead University
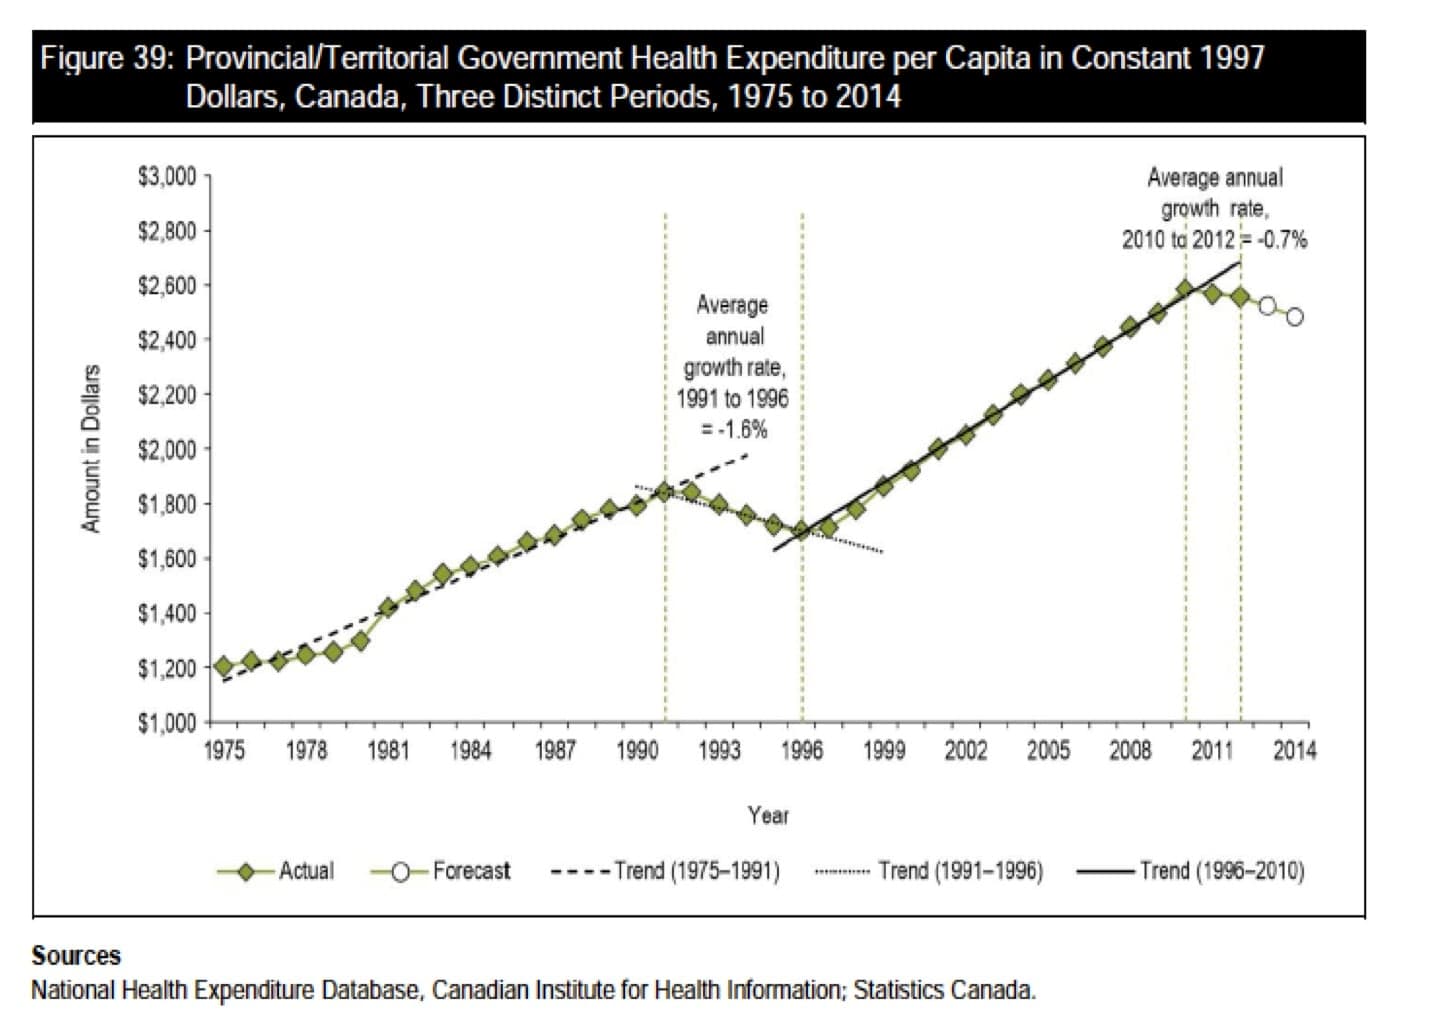
- This chart, from this year’s CIHI 2014 National Health Expenditure Report, shows per-capita provincial-territorial expenditure spending in 1997 dollars from 1975 to the present. It is important for two reasons. First, it shows that per-capita provincial government health expenditures are going down, which suggests that governments are succeeding in bending the health-care-cost curve. Second, we have seen this before, from 1991 to 1996, when real per capita spending also declined. The 1991-96 period of decline was followed by years of consecutive increases. If the past is an indicator of the future, it suggests that, despite the current period of decline, a decade from now, we will likely be spending more.
- 33. Private- versus public-sector borrowingHilliard MacBeth, Richardson GMP
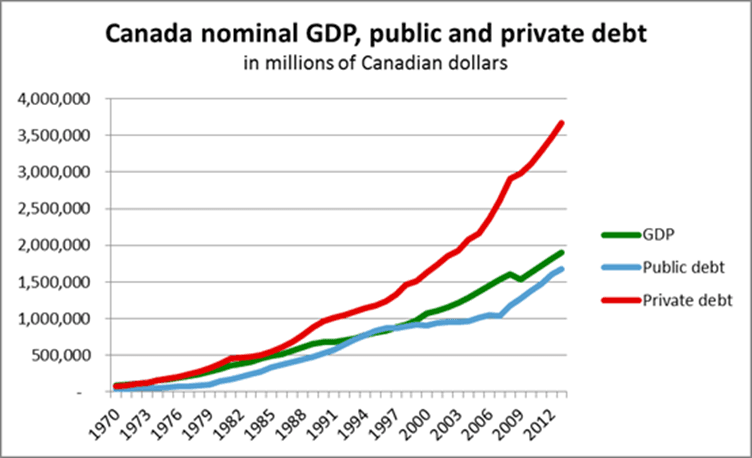
- Canadian private sector debt, which includes household debt and non-financial corporate debt, has received little attention so far. When the housing bubble bursts, Canadian households will save more of their income, and the federal government will have to increase its borrowing substantially or there will be a severe recession.
- 34. The need for export growthLarry Macdonald, independent economist

- We need to find sources of export-led growth to take over from the domestic sources of growth that have carried the economy in recent years. As highlighted by historical highs in the proportion of residential construction to GDP, these domestic sources are reaching their limits, and there is a need to pass the baton to export-led growth. Failure to do so could bring severe downward adjustments in jobs, incomes and house prices in some regions.
- 35. Canada’s consumer-debt crunchTom Bradley, Steadyhand funds
- Canadian consumers are the most indebted in the world. Lines of credit, home-equity loans, car leases, credit cards, high-ratio mortgages—they’re well-versed in them all. The level of consumer debt will make it difficult to attain the growth and employment levels of previous cycles; past purchases were borrowed from the future. Extensive use of leverage will also make Canadian families and the overall economy vulnerable in the next economic slowdown.
Jason Kirby is a Toronto-based editor and journalist. Follow him on Twitter: @jason_kirby
Related Posts

The ’safe bets’ and ’wild cards’ needed to meet Canada’s net zero emissions target

The working class has had enough

Capitalism’s connection to our ever-worsening mental health

Mark Carney sits down with Paul Wells: Maclean’s in Conversation
Get the Best of Maclean’s straight to your inbox.
Sign up for news, commentary and analysis. Join 60,000+ Canadian readers.