The mystery behind Canada’s shrinking deficit
A fact check on the following: “The Government remains on track to balance the budget in 2015”
Share
 ”
”
The Government remains on track to balance the budget in 2015.”
This sentence appears in the press release announcing the publication of every issue of the Fiscal Monitor since August 2013: it first appeared at the end of the release and now appears in the title. Curiously enough, the arrival of this talking point coincides almost exactly with an improvement in the federal government’s budget balance. What is not clear is how it’s happening, or why we should expect the trend to continue for another year.
All the data here are taken from the Fiscal Monitor. I use 12-month moving sums, because there are significant seasonal variations—the surge in personal income tax revenues in April, the “March Madness” surge in spending as managers spend the rest of their annual budget before the end of the fiscal year, etc.
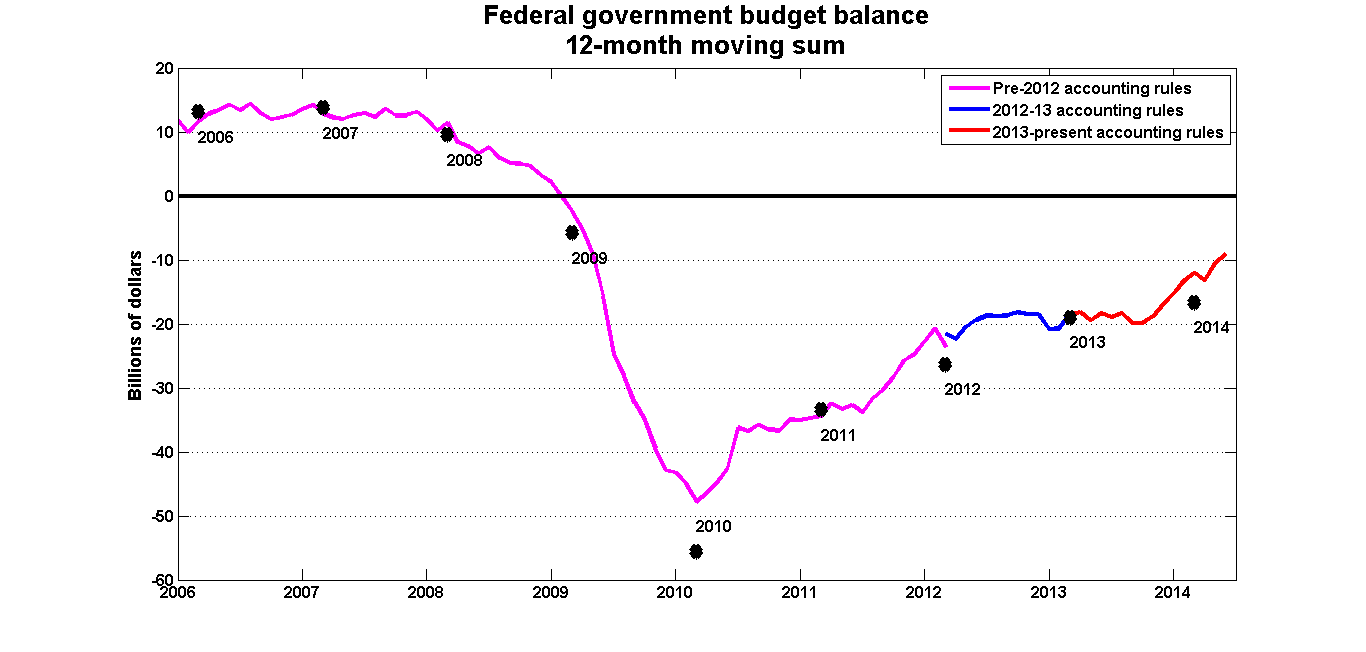
The black dots are the budget balances as recorded in the annual budgets. They mostly line up with the 12-month moving sums, but in some years there are items included in the annual accounts that are not charged to any particular month: a recent example is the charge taken to reflect increased federal liabilities for AECL. The three different colours pick up the changes in Finance’s accounting rules that were made in April 2012 and again in April 2013. I’ll get to these shortly; they don’t affect the overall budget balance.
The deficit fell steadily as the stimulus program wound down and as the economy improved, but it got stuck at an annual rate of about $20 billion in early 2012, where it stayed for the next 18 months. Then three things happened in the latter half of 2013:
1. On Oct. 25, the August 2013 Fiscal Monitor was published, along with the first appearance of the “on track to balance the budget” talking point.
2. On Nov. 12, the 2013 Fiscal Update revised upwards the Department of Finance’s projection for the path of the budget balance.
3. The budget balance began to improve. The 12-month deficit went from $20 billion to about $10 billion as of the June 2014 Fiscal Monitor.
It wasn’t clear to me at the time just how and why this improvement would occur. Until then, the Conservative government had contented itself with a policy of holding the line on direct program spending, while letting transfer payments to persons and the provinces grow with GDP. It seemed that the government was going to tighten this even further to hold the line on all spending, and that seems to have been the case:
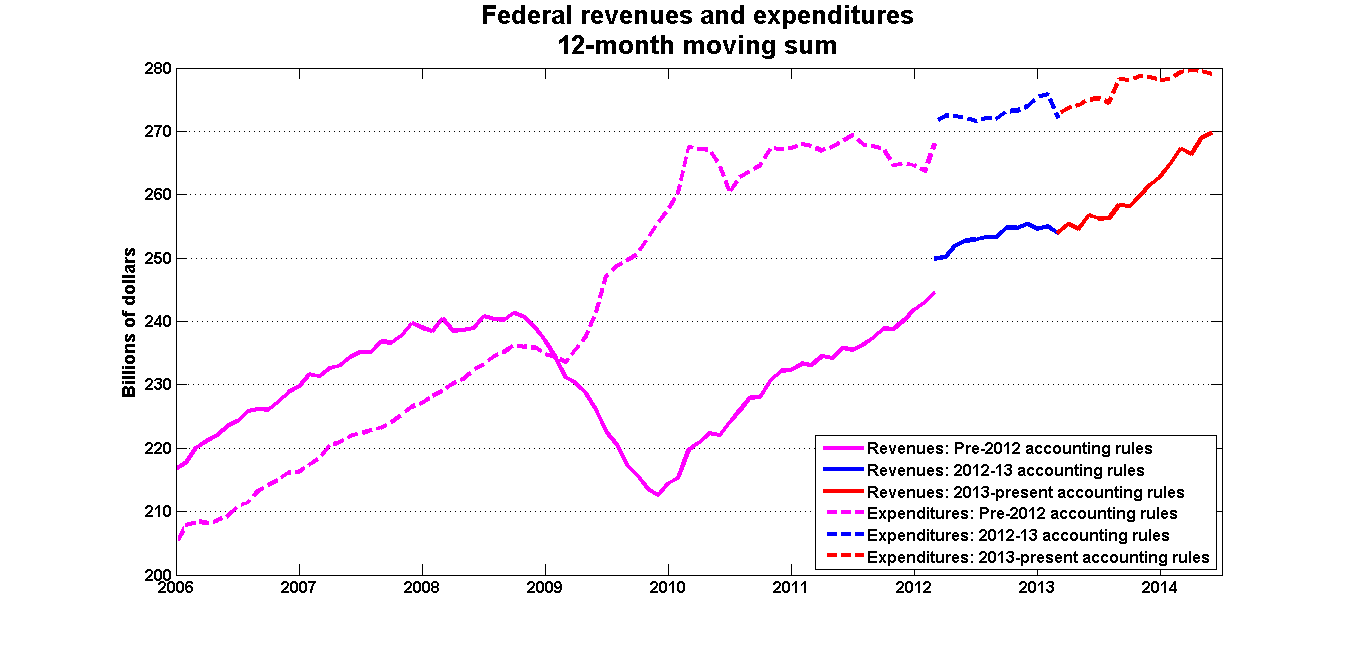
You can see the effect of the 2012 accounting change here: some tax expenditures were (sensibly) re-classified as spending, so both spending and revenues increased, leaving the balance unchanged. I would very much like to tell you what has been going on on the expenditure side, but two accounting changes in two years have clouded the situation. For example, here’s the graph for direct program spending:
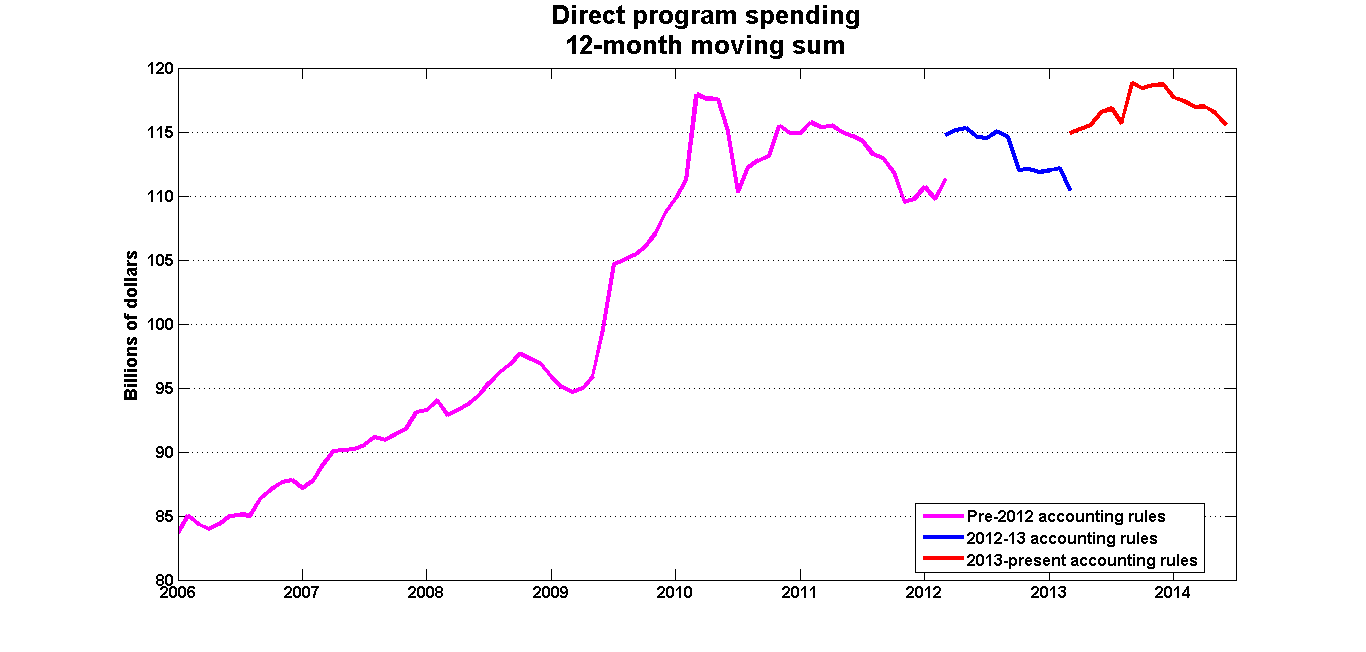
I have no strong views about what accounting rules the Department of Finance should use; all I ask is that the historical series be restated using the current rules. This is something that they won’t do (I asked), and they probably believe that changing the definitions and not revising past data is accepted practice—after all, Statistics Canada does it all the time.
Anyway, the effect of changing the accounting rules twice in two years is that I cannot tell you with any confidence what has happened to direct program spending since 2012. This state of affairs may not entirely displease the Conservatives.
What about revenues? It looks as though sluggish revenues explain why the budget balance didn’t improve for that 18-month span, and that a surge in revenues—combined with holding total spending constant—accounts for reducing the 12-month deficit from $20 billion to $10 billion in the past year.
This raises the question of where those extra revenues came from. The narrative coming out of the most recent budget was built around personal income taxes: since the tax structure is progressive, personal income tax revenues would increase faster than the growth in incomes. But this hasn’t been the case, at least, not so far:
Federal government revenues Revenues:
August 2013Share of total:
August 2013Increase since
August 2013Share of total
increasePersonal income taxes $126.6b 49.4% $4.63b 34.4% Corporate income taxes $34.3b 13.4% $1.15b 8.6% GST $28.3b 11.0% $2.88b 21.4% EI premiums $21.1b 8.2% $0.81b 6.0% Other revenue $46.0b 18.0% $4.01b 29.7% Total $256.3b 100% $13.49b 100%
Personal income tax revenues have increased, but their share of the total has decreased, the same for corporate income tax revenues and EI premiums. The main drivers behind the surge in revenues have been the GST and the “other revenue” category—revenues other than those accounted by the four other items.
I can’t tell you what is going on in that “other revenue” category. It may simply represent the income from newly installed fees, or perhaps the proceeds from asset sales. There’s no way of knowing. All I can say for sure is that the revenue story does not appear to be following the path set out in last spring’s budget.
If the trends over the past few months can be maintained, the federal government will almost certainly achieve its goal of balancing the budget for 2015. And it’s quite likely that this goal will be achieved. We just won’t know how or why it happened, or if the combination of austerity and gains in “other revenue” can be sustained past the current fiscal year.