
The cost of carbon pricing in Ontario and Alberta

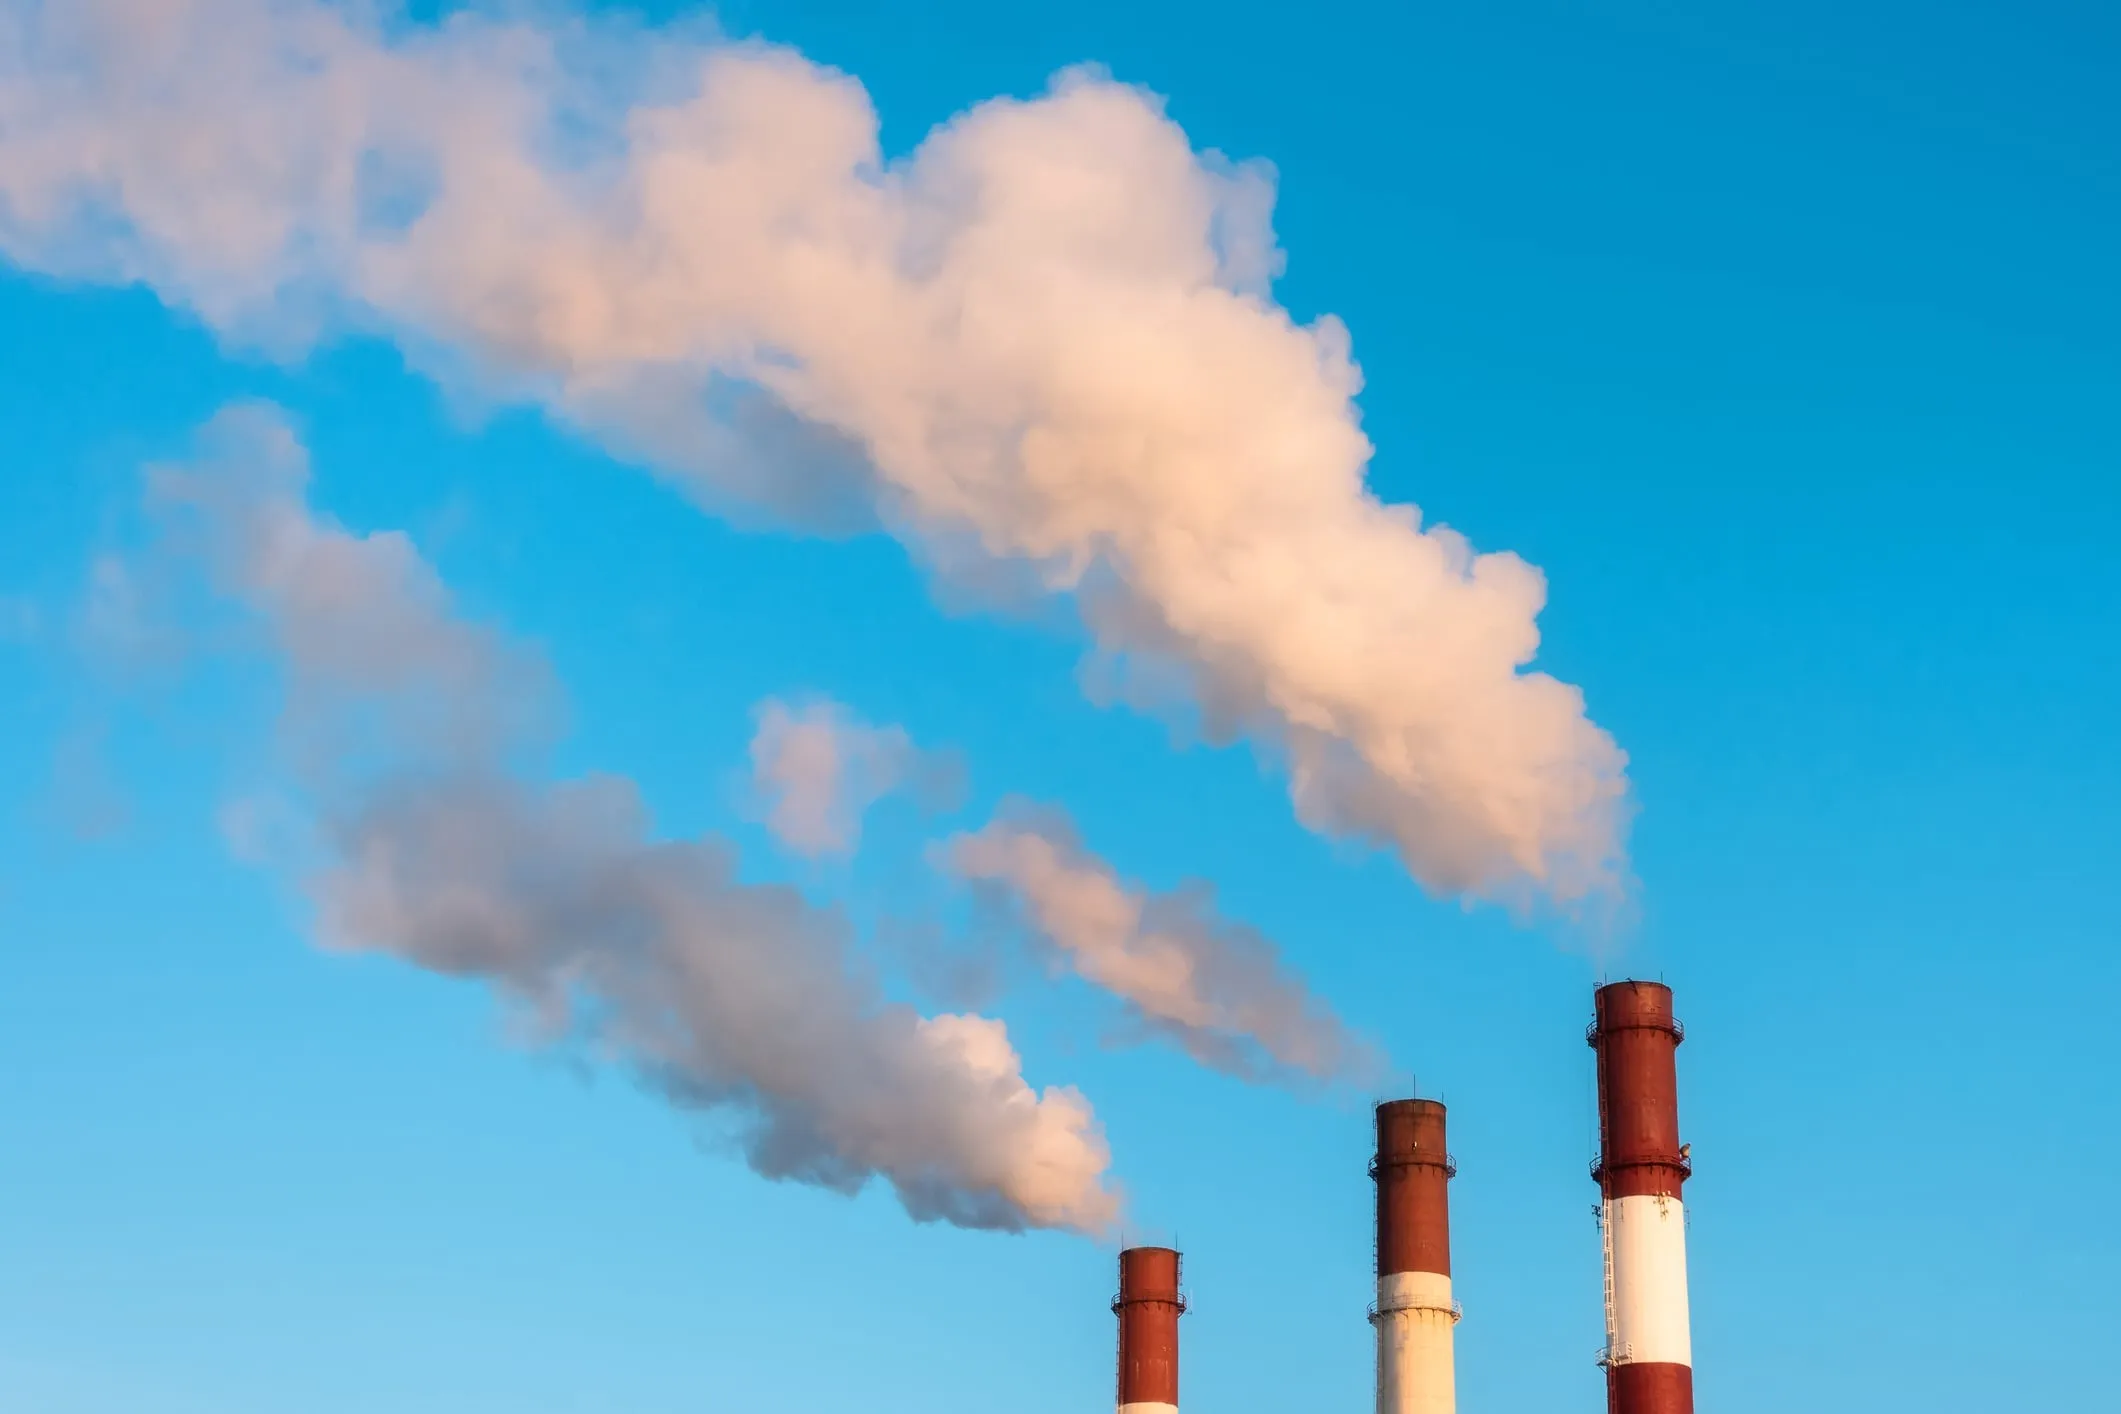
On January 1, Ontario and Alberta adopted broad-based carbon pricing policies. Alberta opted for a carbon tax while Ontario chose a cap-and-trade system. Alberta’s carbon tax is $20/t of carbon dioxide in 2017, while permits in Ontario’s cap and trade system currently trade at about $18/t of carbon dioxide. The idea behind these policies is to better align the prices of goods that cause greenhouse gas emissions with the social costs of producing those goods. The expectation is that, as the price of emissions increases, firms and individuals will emit less. However, many share an important concern that the policies will increase prices of goods for households, and reduce their standard of living.
Broadly, the policies affect prices in two main ways. First, they directly increase the price of gasoline, natural gas, and similar goods that are themselves a direct source of emissions. Second, the resulting increases in trucking, heating, and other input costs will propagate throughout the economy, indirectly slightly increasing the price of (almost) everything we buy. In this post, we provide estimates for these costs, discuss how such estimates are made, and explore some empirical evidence for recent policy changes in B.C. (their carbon tax) and Newfoundland (a significant gasoline tax increase).
Overall, for the average Alberta and Ontario household in 2017, direct costs will likely be on the order of $150 to $200 annually and indirect costs will add an additional $80 to $100 or so. To see how we came up with these figures, let’s start with something relatively simple: the direct costs.
Direct costs
Fossil fuels contain a known amount of carbon, so it is relatively straightforward to predict how much the prices of these goods will change when a carbon price is introduced.
Each litre of gasoline produces about 2.2kg of carbon dioxide when burned in an engine, and each gigajoule of natural gas produces about 50kg of carbon dioxide. (For emissions factors, see Table 1 of this.) With these, we quantify the effect of a $20/t carbon price on these two fuel sources. For a typical household that heats with natural gas, gas bills will increase by about $100 per year, and gasoline expenditures will increase by about $90 per year.
Related Posts

The working class has had enough

What Canada’s economic recovery might look like
We can see an example of these price changes in action in two provinces. B.C. currently has a $30 per tonne carbon tax, so we can simply look up the effect of this on prices: for natural gas it’s $1.49/GJ; for gasoline, 6.7 cents/L.
In Quebec, which currently has a cap-and-trade system, things aren’t so simple. A cap-and-trade system does not explicitly tax gasoline like a carbon tax does. Instead, the price is reflected in a higher wholesale price that retail stations must pay. We can illustrate by looking at Quebec around January 1, 2015—when the cap-and-trade system first applied to fuel distributors there.
For natural gas, Quebec consumers pay $0.93/GJ to cover carbon emissions in natural gas. That’s roughly equivalent to just over $18 per tonne of GHGs—the current prevailing permit price. Depending on the permit price, the cost of gasoline and natural gas can vary over time. So, based on these calculations, and the experience in B.C. and Quebec, we know how much prices will change in Alberta and Ontario.
How much will this cost a typical household? That depends on how much fuel is consumed. With data on average gasoline and natural gas use, we construct estimates of the annual total direct costs below. (For details, see this.)
The average household in Alberta faces just over $200 in new direct costs starting at the beginning of this year, while an average household in Ontario will pay about $150. The higher costs in Alberta are due to a combination of a higher carbon price and greater fuel use.
Indirect costs in our interconnected economy
While direct costs are most obvious, other prices in the economy will also change when these policies are implemented. Carbon pricing will raise the price of many other goods and services throughout the economy. Few concerns surrounding carbon pricing are as broadly shared and as poorly understood as this. To help inform the debate, we hope to carefully explain and quantify these costs below.
Our economy is a highly interconnected and complex web of activity. Output from any one sector is used as an input by many others. To help build intuition, we visualize these interconnections with the latest data from Statistics Canada. Below, each sector of Canada’s economy is a circle, and what they buy from each other are the lines. The bigger the circle, the larger the sector, and the thicker the line, the more flows between them. We further arrange the sectors according to their importance as input suppliers. At the center are sectors that are critically important suppliers to almost every other sector.
Not surprisingly, we see Wholesale and Retail Trade are both large and central—cost changes in those sectors will therefore quickly cascade throughout the rest of the economy. They also serve as conduits that propagate cost changes in one area of the economy through to another, even if the two are not themselves directly connected. We illustrate the path of two shocks, one to residential construction (for fun, given concern around Canada’s housing market) and another to truck transport (more relevant for this post).
We explained earlier how carbon pricing increases the price of goods like gasoline (and diesel). These increased fuel costs may cause truckers to raise their price; for example Alberta’s truckers have already announced a 1 per cent price increase in part to offset increased fuel costs. This increased trucking cost indirectly affects sectors that use trucking as an input. For example, for each dollar we spend on food, roughly four cents goes to transportation. So, 1 per cent higher transport costs will directly raise food costs by about 0.04 per cent. Trucking cost increases also cascade through to other sectors and this feeds back upon itself through the economy’s web of interconnections. Adding this all up, food costs rise nearly 0.1 per cent for each 1 per cent increase in transport costs. (For math, see this.)
So, back to carbon pricing: How large will the indirect costs be? Conveniently, Statistics Canada maintains a social policy simulation model known as SPSM/D (details here). It combines tax details, household spending data, and a model featuring rich input-output relationships in Canada’s economy. Even better, the latest version incorporates Alberta’s upcoming carbon tax, making our job easy. Here’s the result.
Overall, the average household in Alberta may face just over $100 in indirect costs in 2017, rising to nearly $160 by 2018. Ontario faces lower indirect costs due primarily to its lower carbon price.
Of course, these are model-based estimates with important shortcomings. For example, the model assumes that households and businesses continue to consume the same basket of goods before and after the policy change, and it imposes the strong assumption that all cost changes are passed forward to consumers as price changes. Nevertheless it provides useful guidance on the likely size of indirect cost impacts, though they should be viewed as upper bounds.
Beyond models, two real-world examples are useful to see how the policies may play out in practice. Both suggest the resulting indirect costs will be difficult to see—either in our day-to-day lives or in the data (absent more sophisticated analysis).
Example 1: The Newfoundland Gas Tax Increase
Newfoundland provides a unique opportunity to study the effect of a large gasoline tax change on the price of goods and services elsewhere in the economy. Effective June 2, 2016, Newfoundland and Labrador raised its gasoline excise tax from 16.5 cents per litre to 33—a 16.5 cent/L increase.
The SPSM/D model from Statistics Canada predicts that non-gasoline prices in the province should rise by roughly 0.14 per cent. A 0.14 per cent price increase is sufficiently small that it may be hard to see in the data. But let’s look anyway. With Statistics Canada’s consumer price data, we look at prices before and after the tax increase, relative to the rest of the country. Below, we see Newfoundland saw no price increase relative to the rest of Canada in the months following the large gas tax increase. (We use SPSM/D to correct for the July 1 HST increase.)
So, the effect of a large 16.5 cent per litre increase in gas prices is hard to see on the price of goods elsewhere in the economy. That doesn’t imply there wasn’t an effect, as we don’t know from this analysis how prices would have otherwise evolved in Newfoundland, but it is illustrative nonetheless.
Example 2: B.C.’s Carbon Tax
Next, consider B.C.’s carbon tax. Beginning in July 2008 at $10 per tonne, and rising by $5 each subsequent July until reaching $30/t by 2012, it provides an opportunity to explore the effect of broad-based carbon pricing.
Below, we plot the average change in consumer prices for all items excluding energy (gasoline, natural gas, electricity, etc.) for the months surrounding each carbon tax increase. We then average those changes across years to plot the overall effect.
This interactive graphic shows the change in consumer prices for all years, individually reported.
Overall, B.C. systematically has lower consumer price increases than the rest of Canada in the months following carbon tax increases. Again, this doesn’t prove the carbon tax didn’t increases prices, as many other factors are also at play and the modest price increases might have been even smaller but for the carbon tax. But what it does show is that the dramatic price increases that some fear carbon pricing will cause are unlikely to be salient for most households.
In these early days of carbon pricing, detailed empirical analysis is necessarily limited. Our brief analysis shows that the direct effect of carbon prices will be about $150 (Ontario) to $200 (Alberta) per year for an average household. The indirect effect on carbon pricing on the goods and services we buy will be on the order of $100 for the typical household in 2017. Of course, even modest cost increases may be challenging for many households but rebates can effectively mitigate these concerns. In Alberta, lump-sum rebates will be sufficient to ensure low- and middle-income households aren’t (on average) made worse-off by carbon taxes. Ontario meanwhile has no explicit support program, but has a variety of other initiatives.
While more detailed analysis is certainly needed, many researchers will take close looks at the experiences in Alberta, Ontario, and other provinces in the months and years to come. In the meantime, heated political rhetoric that suggests carbon pricing will lead to skyrocketing price increases throughout the economy is misplaced at best and misleading at worst. Climate change, and policies to cost-effectively lower emissions, is such a critical policy area that cooler heads will hopefully prevail.
Nicholas Rivers is an Associate Professor at the University of Ottawa. Trevor Tombe is an Assistant Professor at the University of Calgary and Research Fellow at the School of Public Policy.
Related Posts
Mark Carney sits down with Paul Wells: Maclean’s in Conversation

Capitalism’s connection to our ever-worsening mental health
The ’safe bets’ and ’wild cards’ needed to meet Canada’s net zero emissions target

What Canada can learn from Germany’s mass, unplanned migration
Get the Best of Maclean’s straight to your inbox.
Sign up for news, commentary and analysis. Join 60,000+ Canadian readers.