Why has federal tax revenue exceeded projections?
While it makes sense that weakened economic growth would lower government revenues, it’s getting harder to make that story fit the data
Share

These passages are from the Update of Economic and Fiscal Projections released by the Department of Finance a few weeks ago:
[P]rojected tax revenues are being dragged down by lower expected nominal GDP, while projected expenses are being driven up by higher expected Employment Insurance claims…
These developments have reduced the projected budgetary balance by about $6.0 billion per year, on average, relative to Budget 2015, resulting in deficits of $3.0 billion in 2015–16…
These are the fiscal projections inherited by this Government.
As I noted at the time, this narrative didn’t pass my sniff test: the year-to-date budget balance through September was actually running ahead of Joe Oliver’s projection. Moreover, when you broke down the new Finance projections, the main factors driving the downward revision to the budget balance were “other revenues” and three impenetrable sentences about pension liabilities. Tax revenues in 2015-16 were projected to come in only $600 million below the estimate in last April’s budget.
But even that may be too pessimistic. The October Fiscal Monitor was released near the end of December, so we now have data for the first seven months of fiscal year 2015-16. And while a story in which weakened economic growth has resulted in weaker growth in government revenues still makes sense, it’s getting harder and harder to make that story fit the data.
I’m going to use two sources of data here: the monthly Fiscal Monitor (FM) and the annual Fiscal Reference Tables (FRT). Both report federal revenues and expenditures. In principle, the 12-month sums from the FM from April to the following March should correspond to the annual totals for the fiscal year. In practice, they don’t: often there are budget items that end up being added to the annual totals without being attributed to a particular month. But the FM numbers track the annual numbers closely enough that they still give us a good idea of where the annual numbers are going to end up. In the charts below, the lines represent the 12-month moving sums from the FM, and the dots are the annual numbers. The accounting rules were changed twice recently, and that complicates things. It looks as though the historical annual numbers have been revised to correspond with the current rules.
Here is the budget balance:
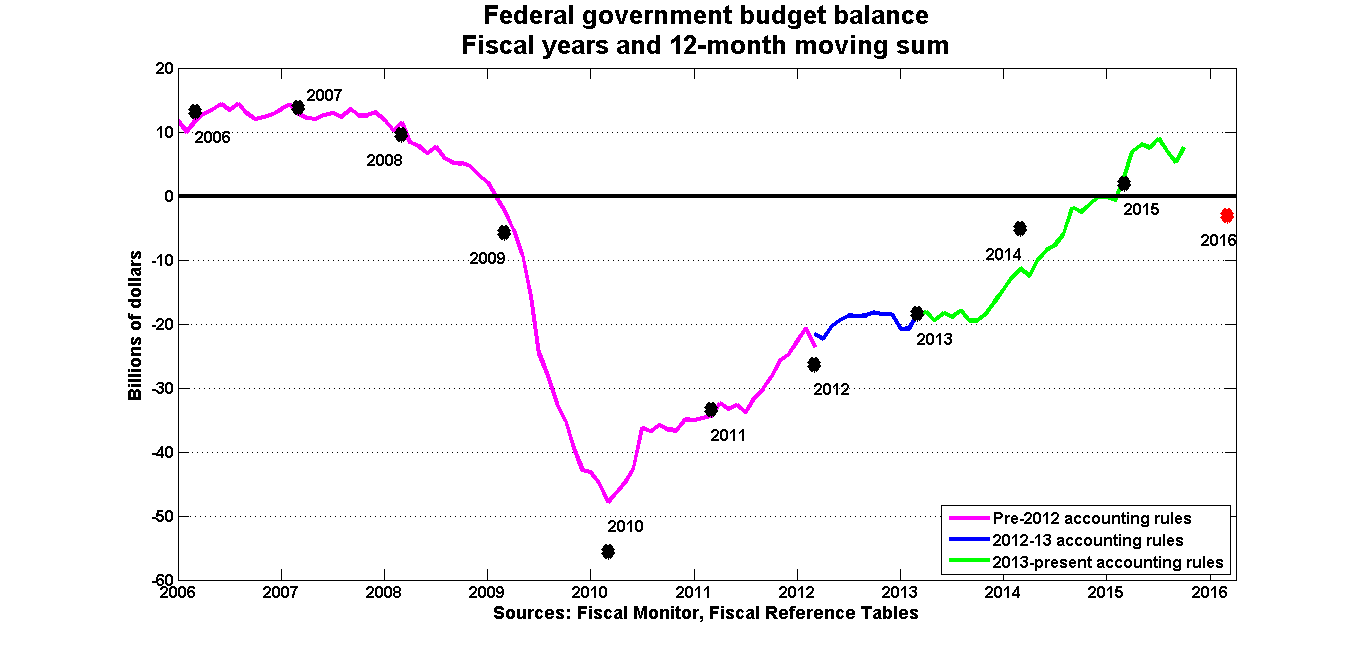
The accounting changes do not appear to have affected how the budget balance is calculated. With a few exceptions (notably 2010 and 2014), the monthly numbers generally match the annual FRT data.
In the 12 months through to October, the federal government ran a surplus of $7.5 billion. In order to bring that down to a deficit of $3 billion by March, the budget balance would have to drop at a pace similar to what we saw at the onset of the 2008-9 financial crisis. This could still happen, but how?
Here are program expenditures:
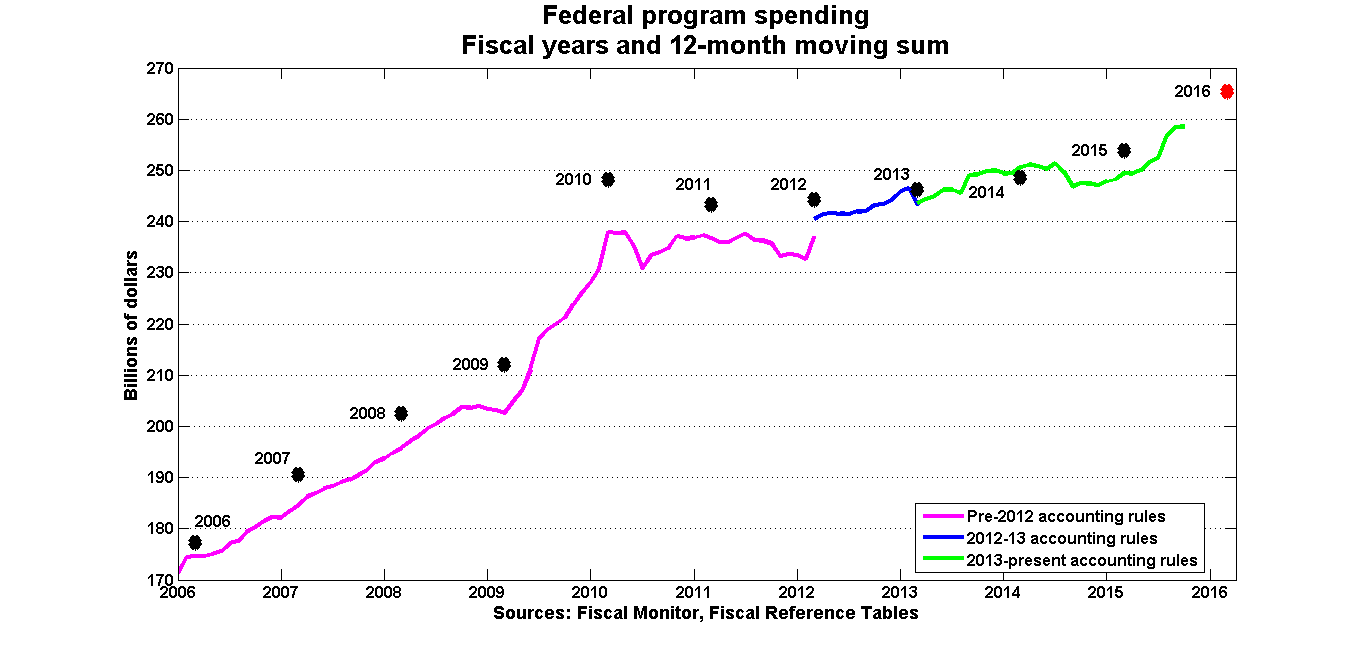
You can see the effect of the accounting changes here. One of the things that happened in 2012 is that certain tax treatments such as the GST rebate were re-classified as spending, instead of being subtracted off of revenues. This had the effect of increasing both stated revenues and expenditures, leaving the balance unchanged.
Program spending is still below the projection, but it’s increasing. On current trends, it’s not unreasonable to believe that spending will come in as projected. A story in which a deficit in 2015-16 is caused by higher-than-expected spending would be driven by a spike in the last 5 five months of the fiscal year. This could still happen, but it would be something new.
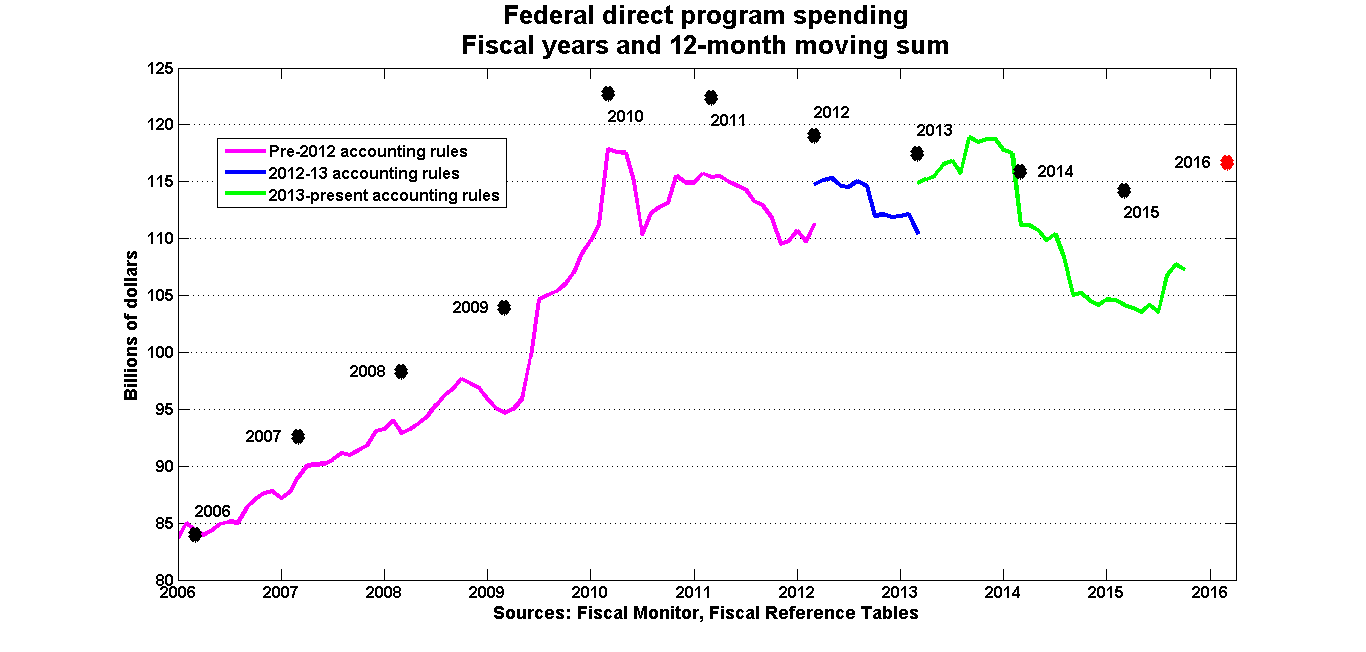
This next chart doesn’t tell you much, and I include it as a reminder of how hard it was to track direct program spending when the Conservatives were in power. I can’t make head nor tail of this:
On to Employment Insurance:
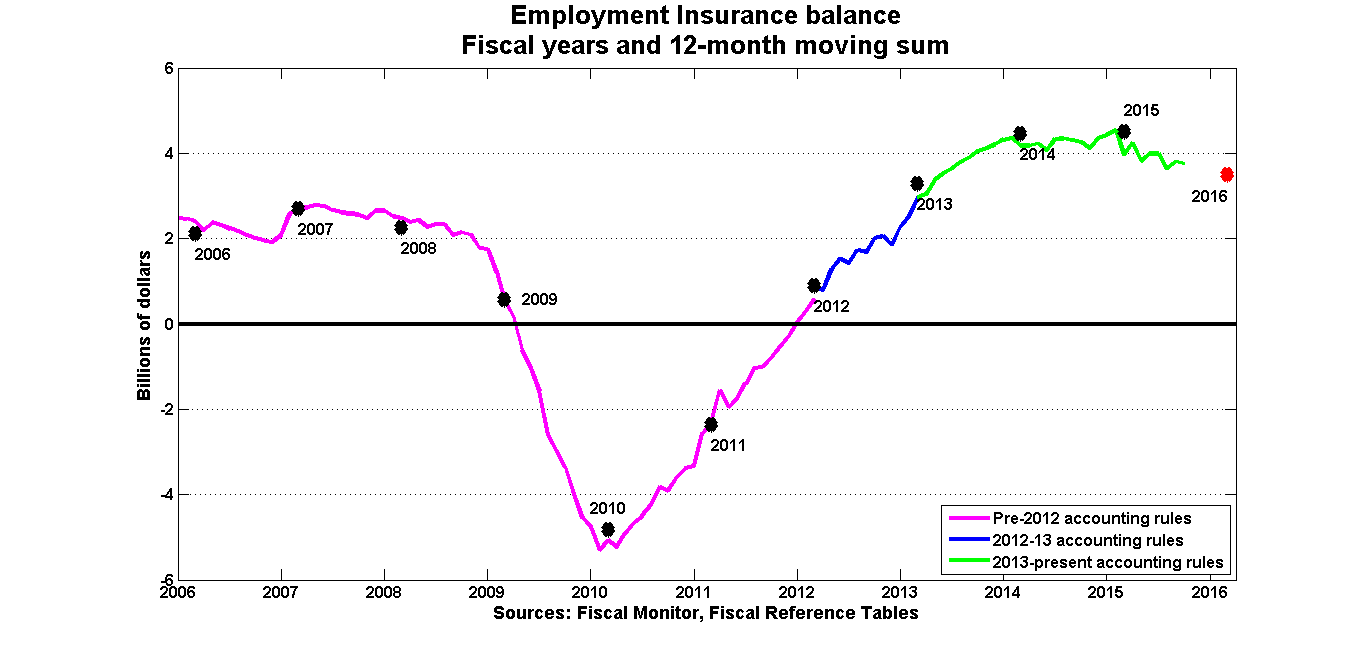
Once again, it looks as though the EI balance is on track to hit the Department of Finance’s projection.
The surprise is on the revenue side. Here again, you see the jump after the 2012 accounting change, and it looks as though the annual FRT data have been revised to reflect this change in order to maintain comparability across time.
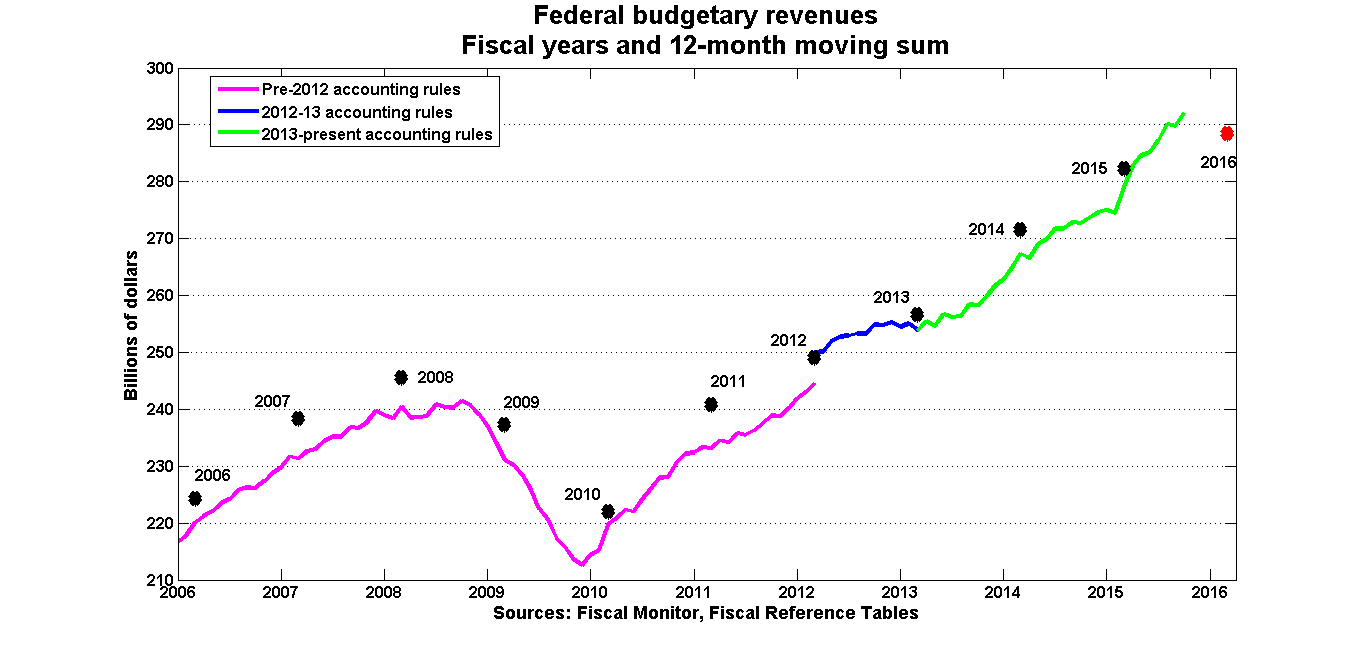
The April budget projected budgetary revenues of $290.3 billion, and Finance revised this down to $288.4 billion in November. The PBO, for its part, revised the projection up to $291.6 billion in its November update. From this, I infer that the PBO gives more weight to the Fiscal Monitor than does Finance, because the 12-month moving sum through October for budgetary revenues was $292.1, which is higher than even the PBO revision. It’s possible that revenues could go sideways for the next five months, but then again, if they increased steadily through the bad news of the first half of the year, why would they suddenly change course now?
We all know about how the Conservatives juiced the revenue numbers for 2014-15 with one-time sales of assets such as their holdings in GM, so let’s look at some of the more important tax revenue items. Changes in economic activity should show up there.
First is personal income tax (PIT) revenue:
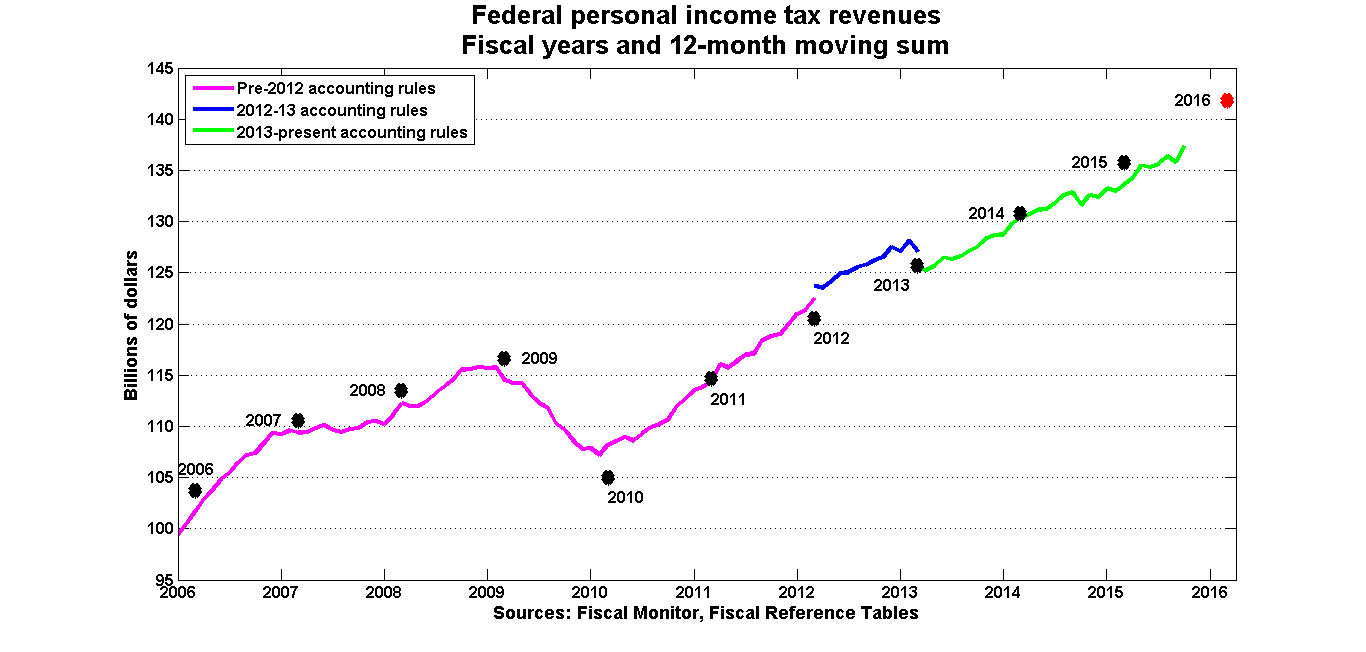
Both Finance and the PBO expect personal income tax revenues to come in below the April budget estimates, and that assessment looks plausible. On current trends, it’s unlikely that PIT revenues will overshoot those projections.
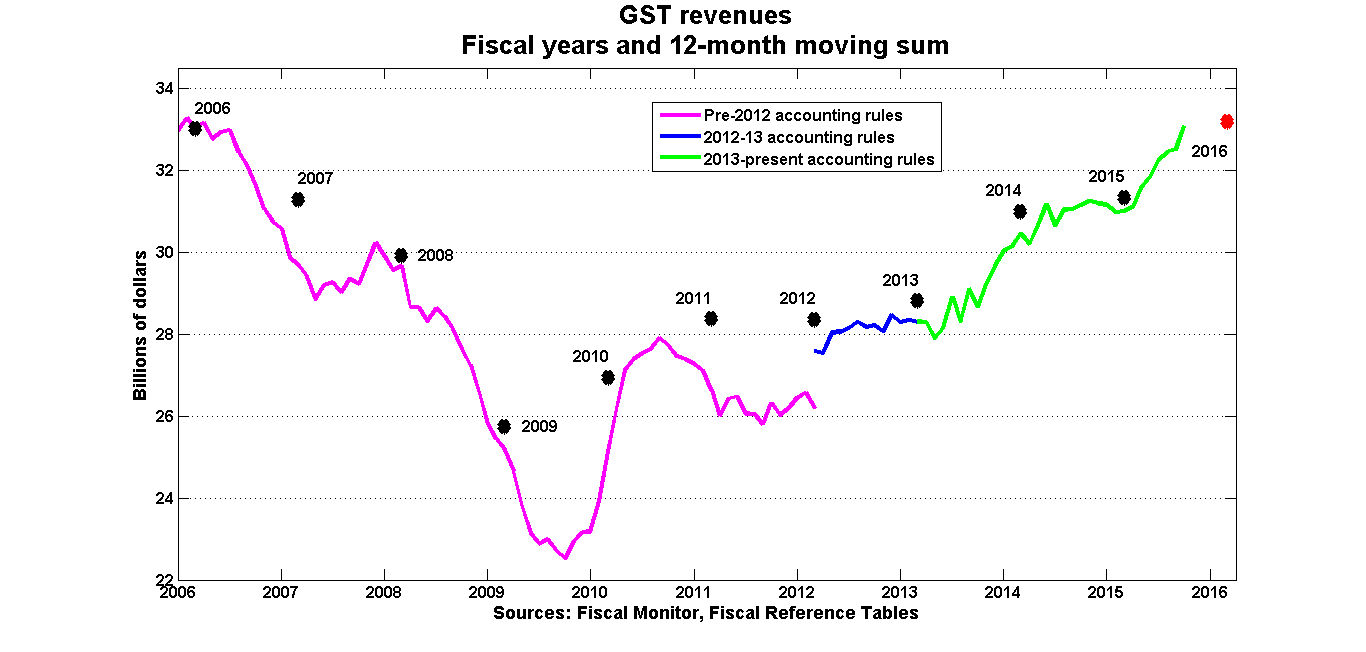
The GST is another story. Both Finance and the PBO have revised estimates for GST revenue up since April, but hitting that projection now looks to be a matter of GST revenues suddenly abandoning the recent upward trend and heading sideways until March. Again, it could happen, but again, it would be something new.
The real surprise is corporate income tax (CIT) revenues:
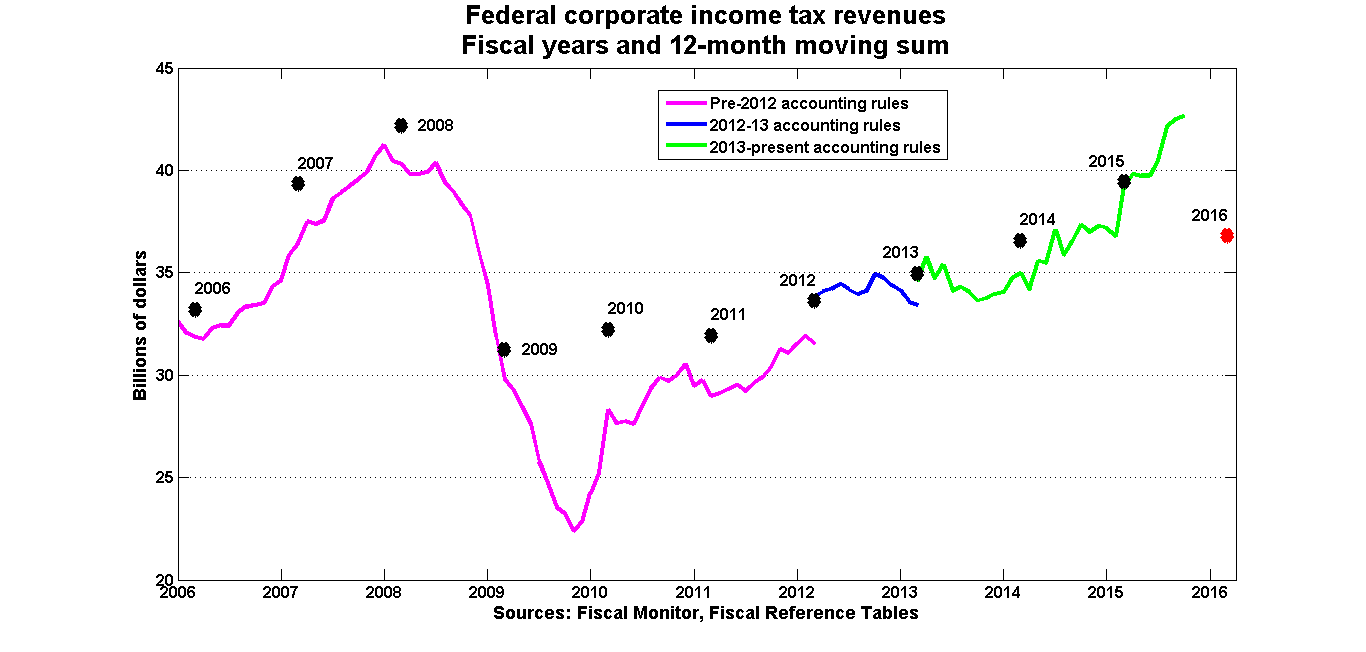
Finance’s November projection for CIT was unchanged from April at $36.8 billion and the PBO’s estimate is $37.8 billion: both numbers are down from $37.9 billion that the CIT generated in 2014-15. But CIT revenues through the 12 months through October were $42.6 billion. Hitting those projections would require a crisis-style meltdown. It’s reasonable to expect that an economic slowdown would show up in CIT revenues with a bit of a lag, but the last time we had that kind of a crisis, the effect on revenues was immediate.
Finally, this last chart puts the PIT, the GST and the CIT together:
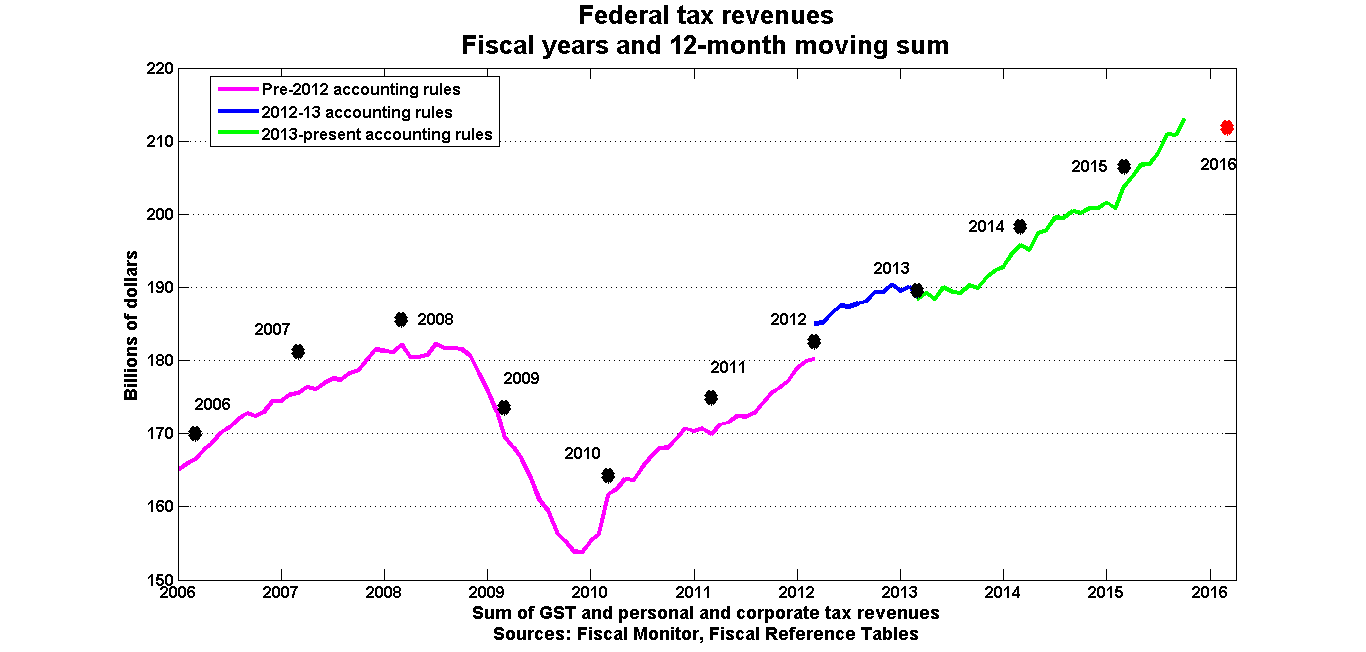
There may be some broader implications of this apparent disconnect between what’s happening in the economic accounts data (GDP and so forth) and what you’d expect these developments should have on the ground. It’s not as though economic growth and oil prices have exceeded forecasts; they haven’t. So why has tax revenue come in ahead of what was projected? If it’s a modeling issue, then maybe those forecasts for future years should be revisited. Or are we experiencing one of those Wile E. Coyote moments in which we are momentarily suspended in mid-air before the inevitable plunge?
Either way, I don’t see how you can tell a story in which slower-than-expected economic growth and lower-than-expected oil prices have resulted in slower-than-expected tax revenue generation. At least, I don’t see how you can use the past tense while telling it.