
Why this oil crash could be worse for Alberta than the one in 2008
In hindsight, I wish I’d have made use of the word yet when I claimed, in an article not so long ago, that the current oil price crash wasn’t anything like 2008, or in two others that Alberta Premier Jim Prentice and the oil sands industry had no need to panic. Both time and the continuing crash of oil prices, which reached lows in the low $40s this week, have given me pause, and I’ve become a lot more bearish. I now wonder if, for three key reasons, this oil crash could be more painful for Alberta than 2008-09 was.
First, while the oil price drop to date has been smaller than the drop in the lead-in to the Great Recession, I think the drop from expectations has been larger.
Second, this time, we had no run-up of any importance before the fall, so corporate balance sheets and government budgets won’t have the luxury of a buffer.
Finally, I think the nature of both the crash and the circumstances in Alberta’s oil sands sector before and during the crash should give us pause. Let me go through each in turn.
First, the crash. On paper, oil (using West Texas Intermediate prices in U.S. dollars unless noted) has dropped from its June 20th high of $107.26 to close last week at $45.29. Prices for Canadian crudes, either synthetic crudes or Western Canada Select, have largely mirrored this overall decline, with synthetic peaking in April at almost CAD$120 and Western Canada Select peaking in early June at just over CAD$94. Both ended last week down well over 50 per cent from those peaks, ending the week at CAD$55 and CAD$40, respectively. On this basis alone, 2008-09 was a steeper drop. From an early-July peak of $147 per barrel, WTI prices fell to close at $33.98 on Feb. 12, 2009. The 2009 drop saw crude lose more than 75 per cent of its peak in a little over six months while, this time around, crude has only lost about 57 per cent in the same amount of time. That said, if you look a little deeper, this is a bigger hit.
The reason I think this price crash may be worse is how it looks when measured against expectations. A year before the 2008 peak, oil prices were at a little more than $70 per barrel, and you could buy or sell a barrel for delivery in a year, i.e., hedge your costs or revenues, for about $75 per barrel. The market was betting on a small uptick, but nothing like what we ended up seeing. Average prices tell a similar story: Over the year before the peak, the average price of a barrel of crude was about $100 per barrel. Compare that to similar measures for this year: A year before the peak, prices were almost exactly the same, at around $105, and the forward market was building in a small discount, with futures trading around $96 per barrel. The annual average was also in the same range: about $100 per barrel. All signs were that crude at, or a little below, $100 per barrel was the new normal. Goldman Sachs was confident in early 2014 that we would not see a material decrease in oil prices due to supply increases. So, the reduction relative to expectations, from mid-2014 to present, is larger.
You can also see differences in the long view looking at the forward market. The graph below shows the change in the forward curve (the price you have to pay today for oil to be delivered in the future) from one year before the crashes of 2008 and 2014 to six months after. In 2008, within six months of the crash, the long-run outlook for oil was already better than it had been a year before the crash and, while the near-term prices were still down in both 2009, and now in 2015, relative to a year prior to the peak, the 2008 crash was not as dramatic on that measure.
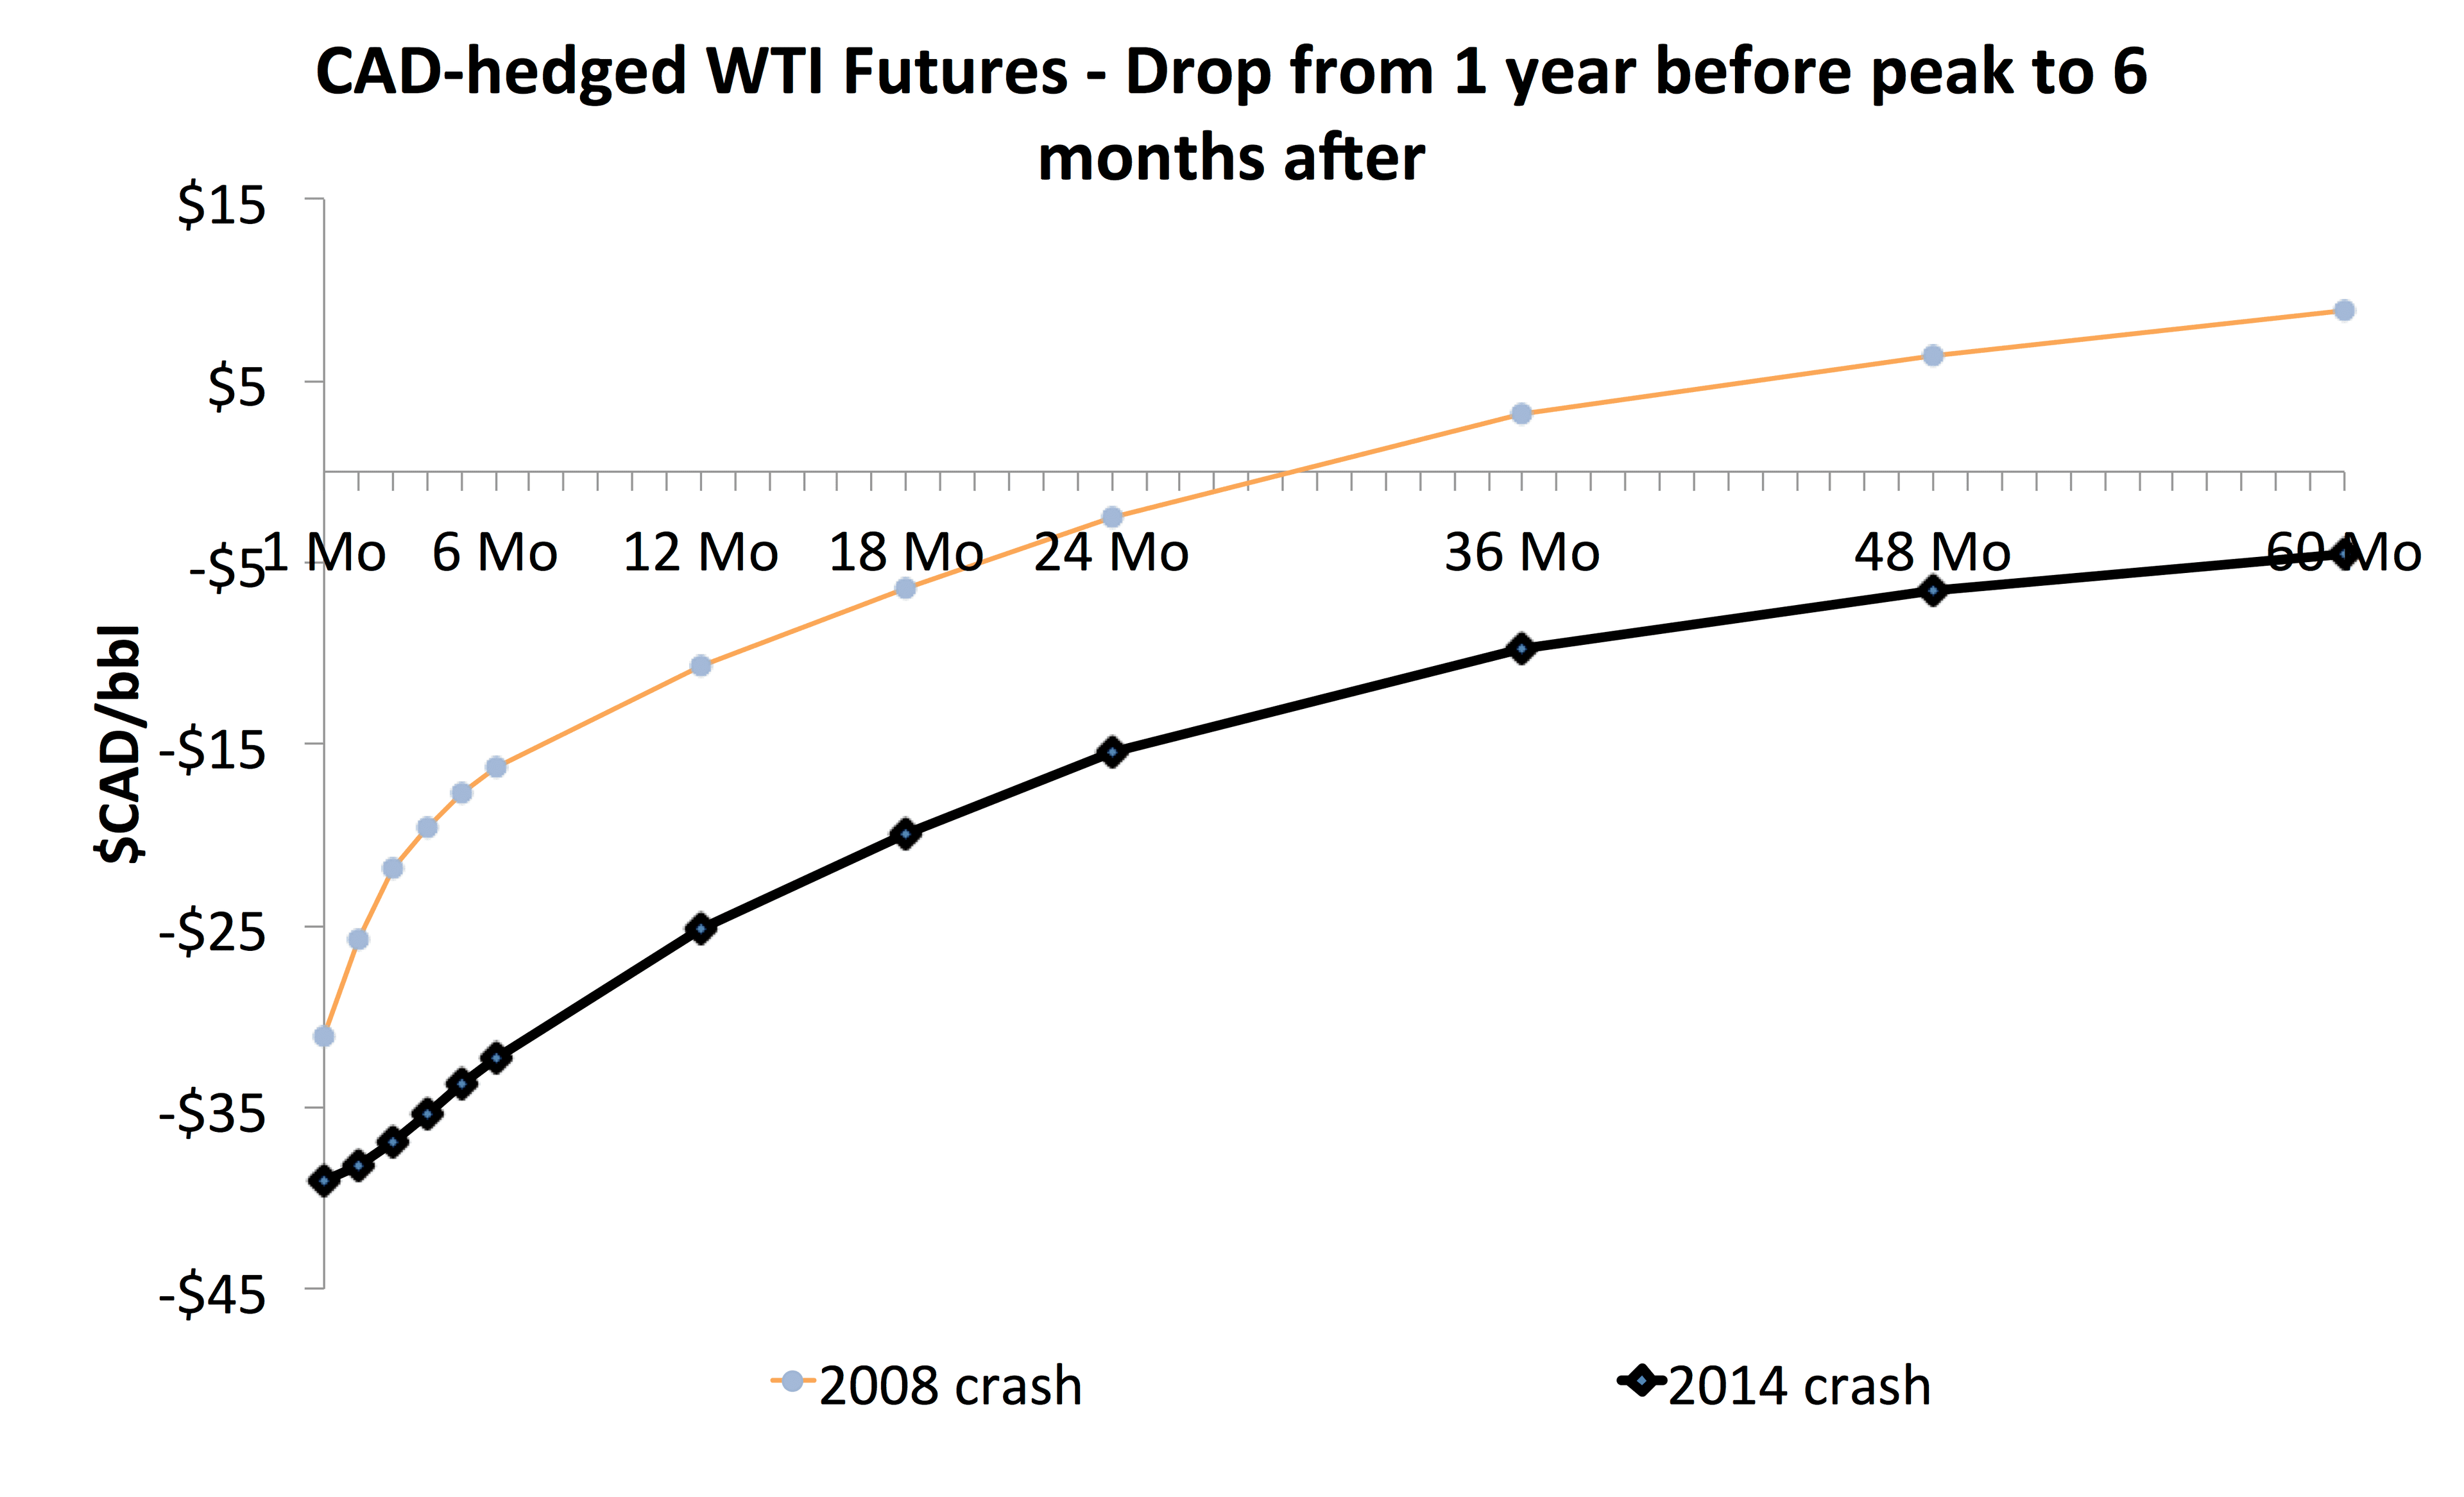
The long-run view is of particular importance for oil sands projects. As Canada emerged from the depths of the recession in May 2009, we saw Imperial oil green-light the Kearl project, which was seen as bucking the trend in a reeling oil sands sector. By that point, the futures price for oil five years out, when the project would be completed, was almost $10 per barrel higher than it had been in the boom times of 2007. Long-run expectations matter a lot for oil sands projects, and the long-run view on oil has fallen further and hasn’t recovered as quickly to previous expectations this time around compared to 2008-09.
The second key difference with this oil crash is in the lack of a run-up before the fall, and how this matters for both corporate earnings and balance sheets, as well as for government budgets. In 2008, the run-up in oil prices was such that, even though West Texas Intermediate prices closed the year below $50 Canadian, the annual average price was well above $100—much higher than would have been expected early in the year when projections and budgets were set. The story is similar for the fiscal year pictures for governments. In 2008-09, the average price for WTI in Canadian dollars over the fiscal year was $93.59, while the Alberta government had forecast oil prices just under $79 for the year. For 2008-09 overall, the Alberta budget had forecast total oil royalties (oil sands and conventional) of just over $5 billion, and ended up collecting $4.7 billion, and the government actually exceeded by a small amount its forecast of total non-renewable resource revenues. That will not be the case this year, with Alberta headed for a significant deficit. Forecast prices, in particular for light oils, have not materialized. With no run-up in prices before the fall, both corporate balance sheets and government budgets will show the full impact of the crash in the next couple of months, and the picture won’t be pretty.
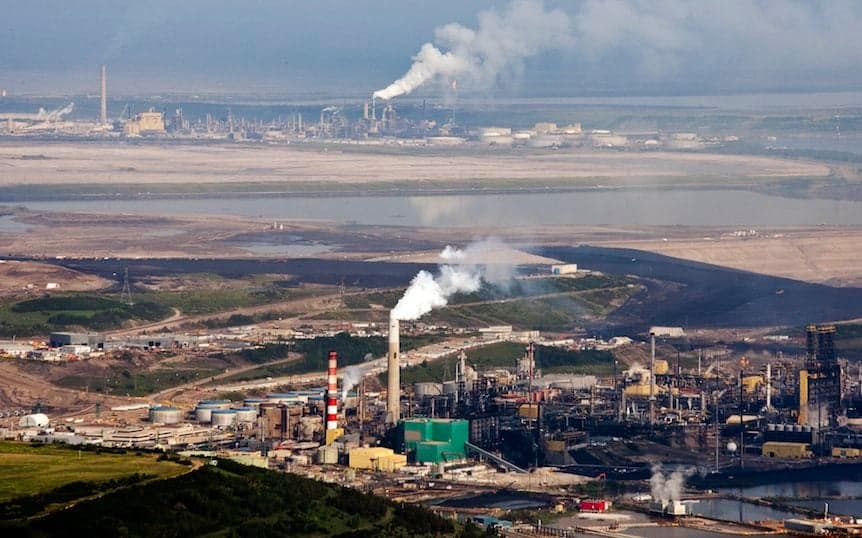
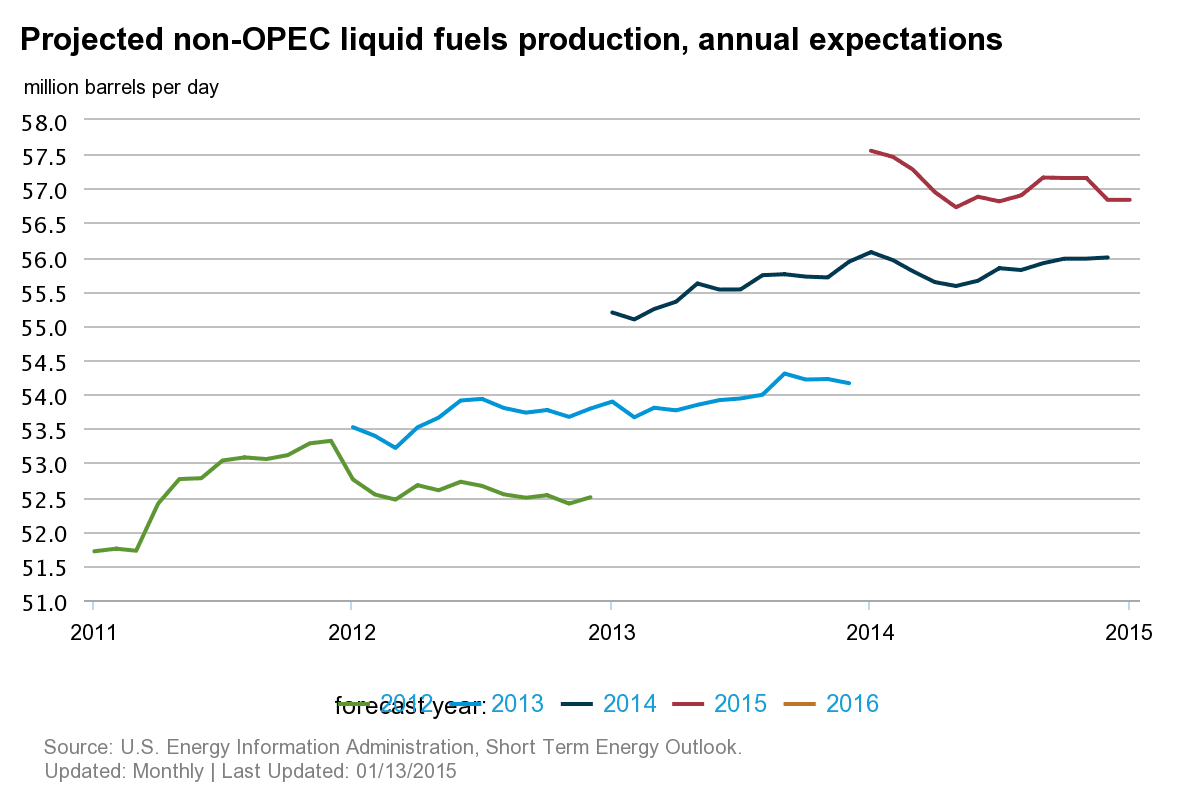
Finally, the third key difference between 2008 and today is where the oil sands sector sits as a whole. In 2008, the crash was largely demand-driven, with a global economic crisis, collapse of the U.S. housing market, and global credit constraints. The oil sands sector was also experiencing some of the issues we were hearing about this year—cost inflation, labour shortages, questions about greenhouse-gas emissions—in the lead-up to the crash, but costs were still relatively modest compared to today. We are looking at a very different shock—the world is awash in relatively cheap, light crude—and while there’s still a lot of uncertainty over what the new normal price will be, it’s become clear that it’s not $100 per barrel anymore, and the circumstances for the oil sands industry are worse today. As the graph below shows, we have consistently underestimated the availability of new supply at prevailing prices since the shale revolution began. The question now is how much this production will fall off, if at all, at lower prices, or whether continuing improvements in productivity will keep prices this low for a long period of time.
The industry also faces other pressures not present in 2008 and 2009. On pipelines, there was a general consensus coming out of the 2009 recession that Alberta had an overbuild of pipeline capacity. Today, Alberta will likely face a capacity shortfall and, thus, larger price discounts, even if no new oil sands projects advance beyond the planning phases. On costs, the recession is likely to ease pressures on the labour market in Alberta somewhat, but expectations for capital investment are still much higher than seen in almost every previous year, as more and more investment is required to sustain production from a larger set of existing projects. This is exacerbated by the fact that other labour markets in the country may see a resurgence due to the low Canadian dollar and growing U.S. economy. Finally, of course, there’s the pressure and uncertainty around greenhouse gas policy. Inaction by the federal government on standards for the oil and gas sector, while completing regulations on most other major sectors that yielded few reductions, has placed oil sands squarely in the crosshairs of Canada’s Copenhagen target. Any new regulations in the sector will now be judged not against our national commitment, and will likely fail that test, further cementing the oil sands’ poor global reputation. Finally, of course, there was a great deal of hope in 2009 that the industry had the technology to solve, or at least stop, the expansion of the tailings ponds in northern Alberta. Now, we know that the industry is not on track to meet targets and, with the drop in oil prices, the likelihood that the government will force rapid compliance is small.
Overall, I’m not sure panic helps anyone, but it seems that, after a long, second look, the industry may be in for a rougher ride from this oil crash than it took in 2008-09.
______
* This article is adapted from a lecture given at a University of Alberta alumni reception on Jan. 22 in Palm Desert, Calif.
Get the Best of Maclean’s straight to your inbox.
Sign up for news, commentary, analysis and promotions. Join 80,000+ Canadian readers.