Are you in the middle class?
From our friends at MoneySense, here’s the 2015 All-Canadian Wealth Test
Share
Appealing to the middle class has long been a favoured move by politicians. In the United States, 90 per cent of Americans self-identify as middle class; in Canada, with the election forthcoming, the middle class has proven a talking point for both the government (the finance minister believes middle class includes families with annual incomes as high as $120,000) and the opposition parties (Liberal Leader Justin Trudeau has made much hay in trying to champion that demographic.) Our sister publication MoneySense has put together this long explainer to sort out who precisely is middle class in Canada, including an interactive Net Worth Calculator to compare yourself to other Canadians. For more coverage like it, on financial issues and beyond, head to moneysense.ca.
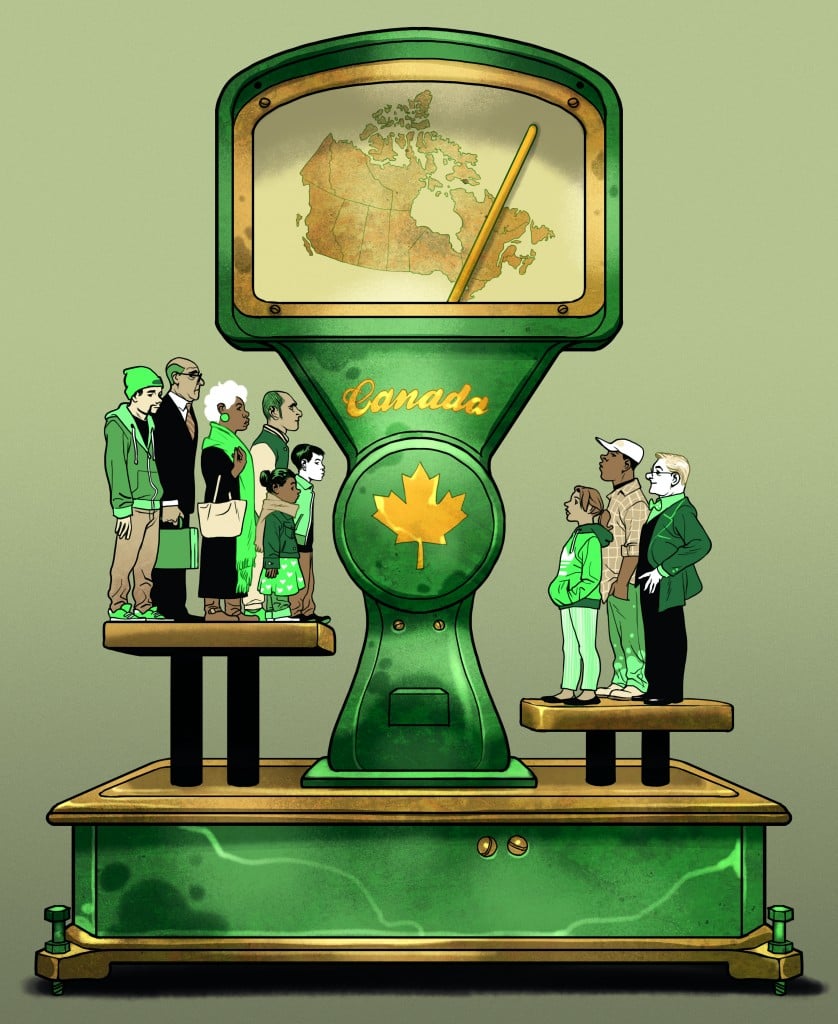
The last time that MoneySense published the All-Canadian Wealth Test—our detailed examination of how your personal finances stack up against others—was back in 2009. And boy, it would be an understatement to say things weren’t going well then. Our nation was reeling from the worst stock market crash since the Great Depression. In the recession that followed, job losses neared 500,000. Debt levels soared and bankruptcies became all too common. Things were brutal.
Here at MoneySense we were almost apprehensive about going through the exercise again—but we’re happy to report things have improved dramatically. Since 2008, incomes and net worths across the country have not only recovered, they’re better than before. Unemployment is down to 6.5% from a high of 8.7% in August 2009, our stock portfolios have bounced back thanks to a long bull market, we’re saving more and we’re taking on debt at a slower rate. In fact, when you think about how well Canada weathered the financial crisis, it’s hard not to be grateful—particularly when you think about the struggles endured by our neighbours to the south and across the pond.
That’s all fine and good for the country as a whole. But we’re guessing you’re more interested in knowing how you’re doing—and not just compared to the average Canadian. We know you’re curious about that hoity-toity neighbour across the street—you know, the one with the fancy new Beamer. Can he really afford it when you’re struggling to pay for your kid’s dance lessons? And what about that frenemy co-worker who brags incessantly about her investments—is it possible her returns are that much better than yours?
If you’ve been wrestling with questions like this, take a deep breath, relax, and keep reading. We’ve got all the answers in the pages ahead. In fact, this year’s version of the Wealth Test is our most comprehensive yet. As always, we’ll tell you if you’re earning more or less than your peers, if you’re wealthier or poorer than others, and whether your portfolio is outperforming. But with the assistance of our friends at Environics Analytics we’re now slicing and dicing the data in ways we’ve never done before. Not only will you know how you’re doing compared to the country as a whole and by region, but you’ll see how your finances and wealth stack up against those living in Canada’s biggest cities. We’re also drilling deeper to give you a better understanding of the levels of debt and accessible cash your neighbours have.
We’ve noticed some surprising trends that may improve your mood, too. For starters, the wealth divide in Canada is actually narrowing. So is the wage difference between the sexes.
Now, despite the prosperity Canada is experiencing, there are still some concerns. A lot of our wealth is tied to our homes: real estate now accounts for a staggering 49% of our net worth, compared to just 37% at the turn of the century. So far the Canadian housing market has remained strong, but if a major correction is around the corner—as experts have been predicting for, ahem, the last decade—many homeowners will experience some harsh financial repercussions.
But the point of the All-Canadian Wealth Test isn’t to strike fear in your heart, nor is it to get you crazy with jealousy over your friend’s paycheque, or to make you puff up your chest because you’re worth more than your annoying brother-in-law. Rather, it offers you a look at the true state of wealth in Canada—and it will hopefully reassure you that you’re doing just fine.
Wealth 101
Before we get into “who makes more, and by how much,” let’s make sure we’re all on the same page. There are two ways to measure wealth. The first is how much you earn annually—your income. The second is your net worth—that is, how much money you’d have if you sold all your assets and paid all your debts, including your mortgage. Together these measurements give you a much more reliable picture of how you’re doing financially than either could alone.
Consider a 32-year-old pediatric specialist at B.C.’s Children’s Hospital. She may be earning a lofty income, but her net worth is probably minimal as she’s burdened with student loans from medical school. Meanwhile, on the other side of the country, imagine a 62-year-old potato processing plant worker in P.E.I. is about to retire. He’ll only have a modest pension income, but he’s been a diligent saver and finished paying off his home years ago. His net worth is several hundred thousand dollars.
Income
How does your income stack up?
Have you ever wanted to know how much your neighbour makes but were too polite to ask? Here’s your chance to find out. We divvy up the population into five equal groups to show the range of incomes for both unattached individuals and families of two or more. For instance, if you’re single and making $30,000 a year before taxes, then you’d be ahead of the poorest 40% of Canadians, but behind the richest 40%.

Income Inequality
Forget the glass ceiling: when it comes to the salary gap between the sexes, women have hit a brick wall. Women between the ages of 45 and 54 earn on average about $23,600 less than men in that same cohort, which is virtually unchanged from where it was five years ago, but the gap is narrower than back in 2000.

Gettin’ paid
Our pre-tax income is the typical measuring stick of prosperity. All of us equate certain earning levels with being rich, middle-class or just scraping by. But to give you a more accurate picture of how your paycheque actually compares to others, we’ve broken down incomes into five equal groups calledquintiles. Each represents 20% of the Canadian population. The lowest quintile, for instance, represents the fifth of the population earning the lowest income, whereas the highest quintile represents the fifth of Canadians earning the most.
We then go a step further and determine the income quintiles for families of two or more people, as well as individuals. The table above, How Does Your Pay Stack Up?, lets you see you see exactly where you fit on Canada’s income ladder.
As you’d expect, family incomes are much higher than those of unattached individuals. A middle-class family of two or more earns between $61,929 and $88,074 per year, while a free-and-easy single only needs to earn between $23,357 and $36,859 to be considered part of that social class. In fact, a $56,000 salary will get you into Canada’s wealthiest income quintile of singles, while married couples need to pull in more than $125,000 to crack that elite demographic. Clearly you don’t need to be Heather Reisman or Justin Bieber—or even a doctor or lawyer—to be one of Canada’s top-tier earners. A nurse living on her own or two married high school teachers could fit the bill as well.
Location, Location, Location
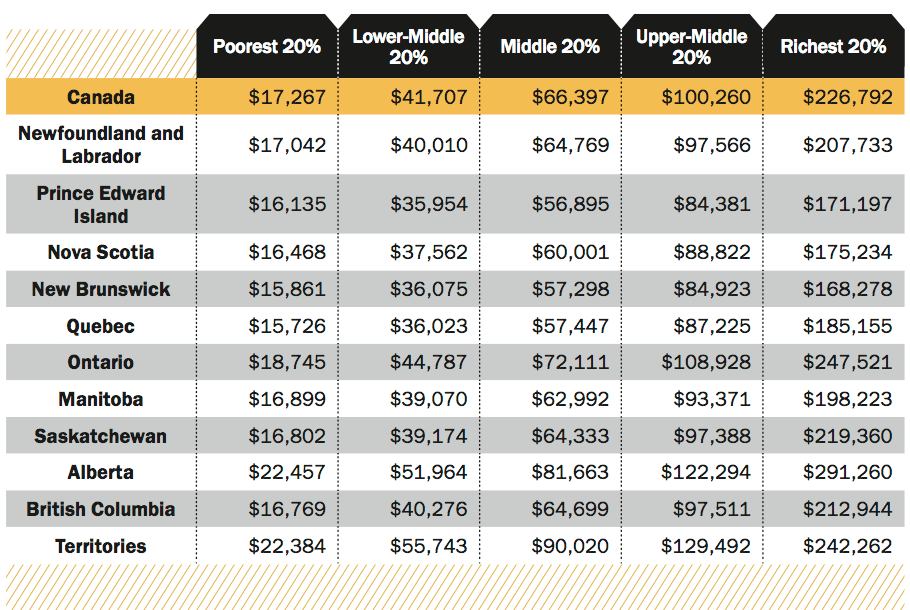
Where you live plays a big part in how much you earn, too. For instance, middle-class household incomes in P.E.I., Nova Scotia, Quebec and several other provinces are well below the national average of $66,397, as Bright Lights, Big Incomes (to the right) shows. That’s because the numbers are skewed by the much higher incomes in the economic powerhouses of Ontario and Alberta. That’s not just true for the middle class, but across every income quintile. For instance, the richest 20% of Alberta households earn an average income of $291,260, whereas New Brunswick’s top-tier households pull down $168,278.
Believe it or not, the territories jack up national averages across all earning levels as well. “They have a lot of well-paid geologists and natural resources workers who go up there and then migrate back to other parts of Canada,” explains Peter Miron, senior research associate at Environics Analytics. “It’s the same thing we’ve seen where people earn big salaries in Alberta but then go spend it where they actually live.”
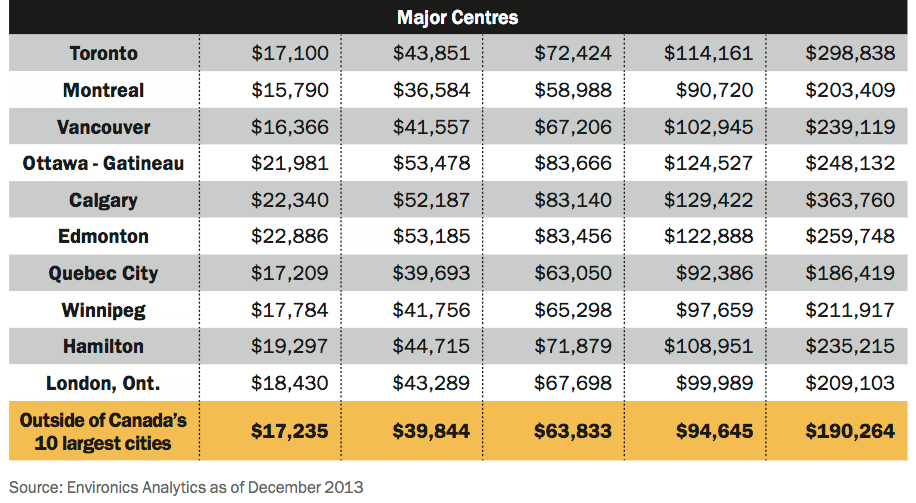
The takeaway here is that national averages don’t tell the full story. This is particularly evident when you look at household incomes in Canada’s 10 biggest cities. As the bottom table in Bright Lights, Big Incomes shows, earnings in these large urban centres almost always exceed those of smaller Canadian cities. Booming Calgary tops everyone: its wealthiest households rake in $363,760 a year on average.
Disparity and then some
Most women don’t need to be told they’re earning less than men—they’re painfully aware of that. AsIncome Inequality on the preceding page illustrates, women will make one-third less than men over their lifetimes on average. The disparity begins in adolescence but becomes significant once women hit their 30s and salaries for both men and women really start to grow. Then it tapers off slightly in the later working years and into retirement.
While there’s nothing to suggest this trend is going away anytime soon, you can take heart in knowing that the gender wage gap appears to be narrowing. Highlights from the Vanier Institute of the Family’s 2013–14 report, The Current State of Canadian Family Finances, shows a 17% and 9.7% increase in the average hourly earnings for women and men, respectively, between 2000 and 2013. It’s also encouraging that the proportion of dual-earner families in which women earned more than their husbands is up from 23.3% in 1994 to 30.4% in 2011.
Gender, however, is hardly the biggest indicator of how truly unbalanced incomes are in Canada. The wealthiest 20% of households account for about 43% of all income earned, while the poorest 20% take in a measly 4%. Being in the middle-class, which generates about 17% of all income earned, isn’t much to crow about either.
Bright lights, big incomes
How your income stacks up against the rest of Canada is one thing, but if you really want to see how well you’re doing it’s best to compare yourself to the people around you. The tables below break down incomes by province and for the 10 largest cities in Canada. It makes a difference. For example, a middle income in all of Ontario is about $72,000, but that’s about $11,500 less than a middle income in Ottawa and some $4,500 more than a middle income in London, Ont.
Net Worth
Losses, what losses?
Back in 2009 Canadian households saw their wealth dip by 10%. But the rebound was swift and complete: those net worths are 15% higher than they were five years ago. Since 2006, the average Canadian household has added about $75,000 to its net worth.  But am I rich?
Even if your income provides you with a comfortable lifestyle, that doesn’t necessarily mean you’re wealthy. Income doesn’t equate to wealth if you’re young and just getting established, or if you’re older and up to your eyeballs in debt. That’s why we consider net worth the true measure of wealth. It includes everything you own—your house, car, bank accounts, RRSP, stocks and bonds, your small business, and even your company pension. Once you’ve added up these assets, you subtract all your debts and liabilities—such as credit card balances, car loans and mortgage—to arrive at how much you’re actually worth.
If you’re single, it doesn’t take much to be wealthier than 40% of your peers, as Are You Rich? (to the right) shows. Since many unattached people tend not to purchase a home on their own, a net worth of $73,676 puts you squarely in the middle class. A middle-class married couple, on the other hand, has an average net worth of $427,271—slightly more than the average home price in Canada.
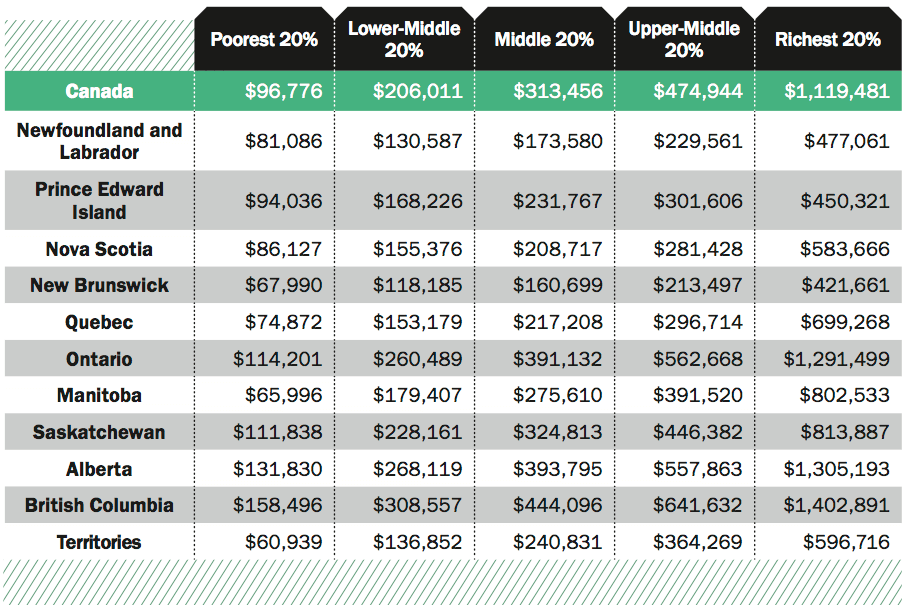
Once again, though, a closer look at net worth by region and city provides a far more telling picture. While the national average household net worth sits at $442,130 (see What’s the Source of Your Net Worth on page 55), it’s actually as low as $196,240 in New Brunswick and as high as $591,047 in B.C. As Being Rich is Relative (to the right) shows, net worth quintiles for these two provinces reveal even more disparity: middle-class net worth in B.C. ($444,096) exceeds the highest-tiered net worth in New Brunswick ($421,661).
It’s also interesting to note that the territories, while full of big earners, have much more meagre levels of net worth.
Are you rich?
You might be earning the big bucks, but income alone doesn’t make you wealthy. Your net worth is the best measure of overall wealth. It takes into account everything you own (real estate, pensions, RRSPs and other investments) minus everything you owe. When it comes to wealth, not surprisingly, families have the edge over individuals. The collective net worth of the lowest 40% of individuals wouldn’t match the poorest 20% of families.

Share the wealth
Families can build wealth faster than individuals because they’re able to pool their resources, which enables them to pay down debts faster and make larger purchases. And what a difference it makes: between ages 55 and 65 families are worth, on average, a whopping $670,000 more than unattached individuals in the same age group. 
Being rich is relative
What about Canada’s biggest cities? Typically, middle-class households—and even those in the second-highest quintile—have net worths that fall in line with the national averages. While there are some variations, only Montreal and Quebec City underperform, which is mainly because households in Quebec are younger than other provinces and so have had less time to build up net worth, says Miron. The average net worth in the wealthiest quintiles is far more robust: $1,813,261 for Toronto, $1,849,689 for Calgary and $1,759,204 for Vancouver.
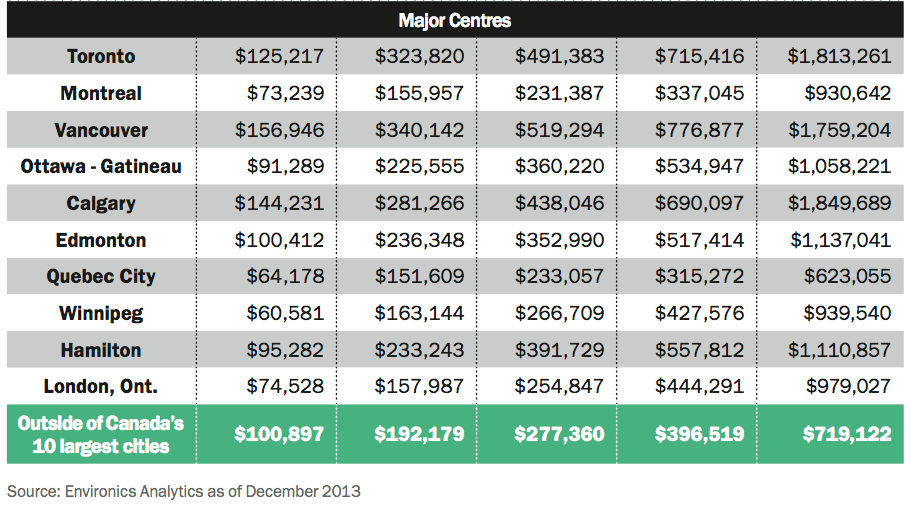
What’s the source of your net worth?
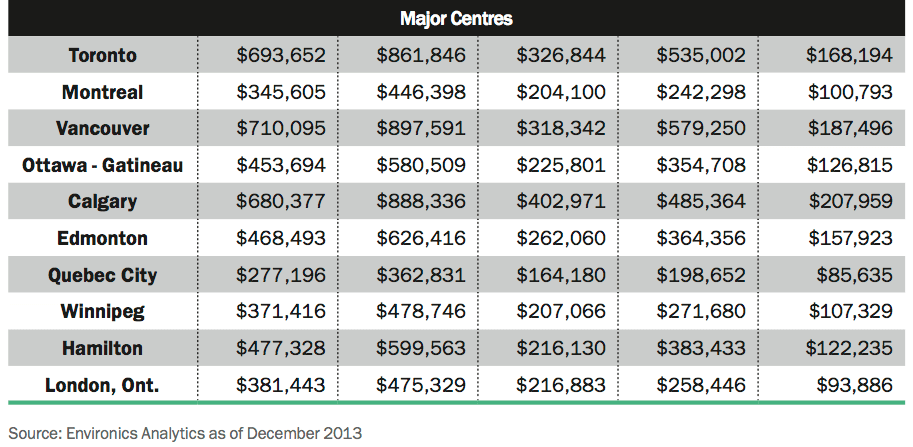
In Canada, home ownership is playing an increasingly large role in determining how wealthy we are—thanks to our seemingly bubble-proof housing boom. The tables below break down the average household net worth by province and by city, showing the true value of our assets minus our debt. Not surprisingly, in every region and major urban centre, the value of our real estate holdings outweigh our more immediately accessible liquid assets. Even economic powerhouse Alberta can’t buck this trend, nor can its shining star Calgary, the financial centre of western Canada.
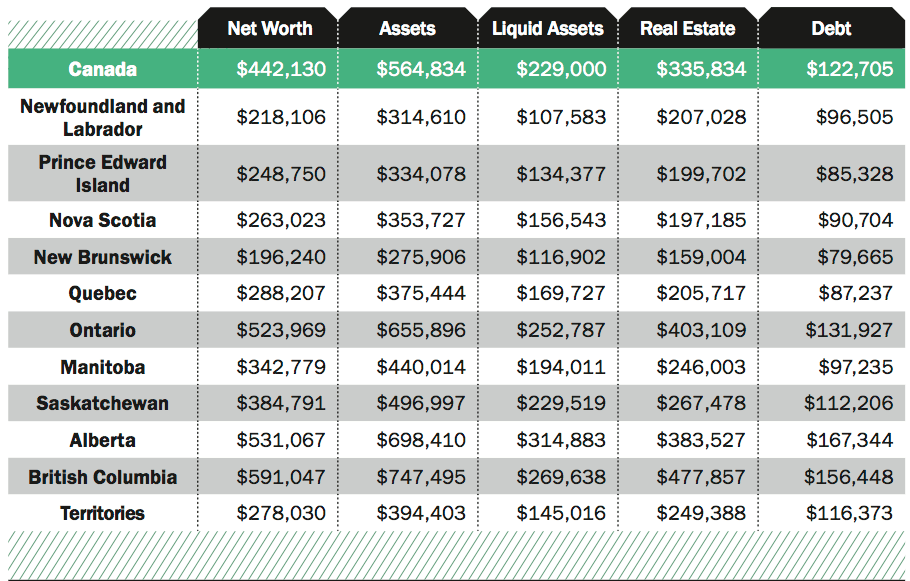
So while there is income disparity in Canada, the imbalance is even greater when it comes to net worth. Households in the highest quintile hold a staggering 67% of all wealth in Canada. But there is a silver lining: back in 1999, that figure was closer to 69%, so we’ve experienced a slight shift in wealth. That redistribution, however, isn’t going to any of the middle quintiles. “It’s all going to the bottom,” says Miron, meaning the poor are actually feeling “a bit more flush these days.”
Feeling wealthy depends on where you live. The richest 20% of households in New Brunswick, for instance, would be middle class in Vancouver. Similarly, middle class in Montreal would be poor by Toronto standards. The tables below break down the average household net worth by province and by city so you can see where you fit in.
So much house
About half of all Canadian households that own real estate are carrying a mortgage, and on average the value of our properties accounts for about half our net worth. But when you look at some of Canada’s largest cities these figures escalate, as What’s the Source of Your Net Worth? (to the left) shows. In Vancouver, for instance, real estate accounts for 55% of the average household’s net worth, and 65% of the average household’s assets before debt is deducted. “In B.C. a lot of wealth is tied up in real estate,” says Miron. “That’s great as long as the market stays up.”
Canadians in the lowest net worth quintile don’t worry about any of this because most don’t own a home. But homeowners in the second, third and fourth quintiles should be concerned, says Miron. Unlike their wealthier counterparts in the top quintile, they won’t have the liquid assets required to bail them out if the banks start calling in their debts.
The bottom line
We hope we’ve given you the tools you need to see how your finances compare with the people around you. Despite the income and wealth inequalities in Canada, chances are you’re discovering that it’s a great time to be Canadian and most of us have an awful lot to be grateful for, however we stack up to those around us.