Canada’s most dangerous cities
Canada’s most dangerous cities
Canada’s most dangerous cities
Click here for the most dangerous cities in Canada in 2016.
At their core, annual crime statistics are a snapshot of the year that was. The first year Maclean’s compiled its national crime rankings, Arthabaska, Que., was the murder capital, with a homicide rate 302 per cent above that of Canada as a whole. Yet in 2009, the region of 70,000 witnessed no murders. Last year, its two homicides put it 77 per cent above the national rate.
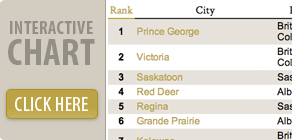
For all the annual variations, some cities are repeat offenders. Year after year, https://grademiners.com/ western cities dominate the rankings as the worst for crime. And, in reverse, the most populous cities in Ontario and Quebec consistently score well. Toronto’s overall crime score ranking is No. 52, exactly where it was in 2000. To see how well your community or province did in 2010, go to our interactive chart for a complete listing. Our interactive map of Canada’s safest and most dangerous cities allows you to quickly zoom in and see how cities stack up against one another. You can also click on assignment writer the buttons below to see the rankings for each of the six criminal offenses included in the overall rankings.

 Aggravated assault |  Robbery |  Homicide |
 Breaking and entering |  Auto theft |  Sexual assault |
READ MORE:
Canada’s most dangerous city: Prince George
Gang wars, drug abuse and a serial killer guaranteed Prince George, B.C., the top spot
Vancouver’s crackdown on crime is paying off
Police chief Jim Chu on his six-step approach to a safer city
Newfoundland’s other boom
The prosperity and good jobs lifting the province’s fortunes have also attracted more criminals
The good news
Yes, there’s been an overall decline in crime levels in Canada—but some areas stand out as especially safe
Methodology: Maclean’s obtained annual crime data from Statistics Canada for municipal case study writers police services serving the nation’s 100 largest populations, each encompassing a city or town of at least 10,000 people. Using 2010 rates per 100,000 people for six crimes—homicide, sexual assault, aggravated assault, vehicle theft, robbery plus breaking and entering—Maclean’s calculated the percentage difference from the national rate. The overall crime score ranking for the 100 communities was created in consultation with StatsCan, using its Crime Severity Index (CSI) score and calculating the percentage difference from the national score. Maclean’s calculated the ratios by dividing population of the area by the raw number of crimes.