The Canadian economy 101: A primer from Kevin Page
Seven charts with audio briefings on the federal budget
Share
Finance Minister Joe Oliver’s budget speech, his parliamentary salesmanship of his party’s latest economic plan, will no doubt paint the rosiest possible picture of federal finances. Whatever he tells his colleagues in the House of Commons, and whatever the broader public gleans from the speech, one thing is certain: There’s much more to Oliver’s words than meets the eye. Oliver’s Department of Finance prints reams of Economic Action Plans, voluminous tomes that identify many of the government’s spending priorities, tax plans and economic forecasts.
Maclean’s Ottawa Bureau Chief John Geddes enlisted Kevin Page, the former Parliamentary Budget Officer and now a public finance professor at the University of Ottawa, to make sense of all those numbers. Page broke down the Harper era in federal budgets into seven charts.
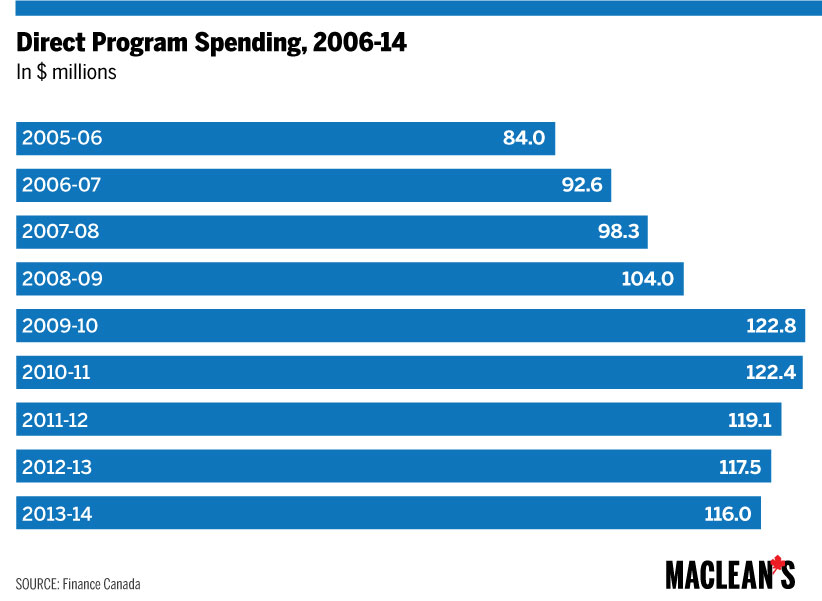
1. Harper spending in a word: volatile
Page describes federal spending as volatile under Prime Minister Stephen Harper’s Conservatives. Big increases in total program spending from when they took power in 2006, then huge stimulus spending in 2009-10, then followed by restraint up to now.
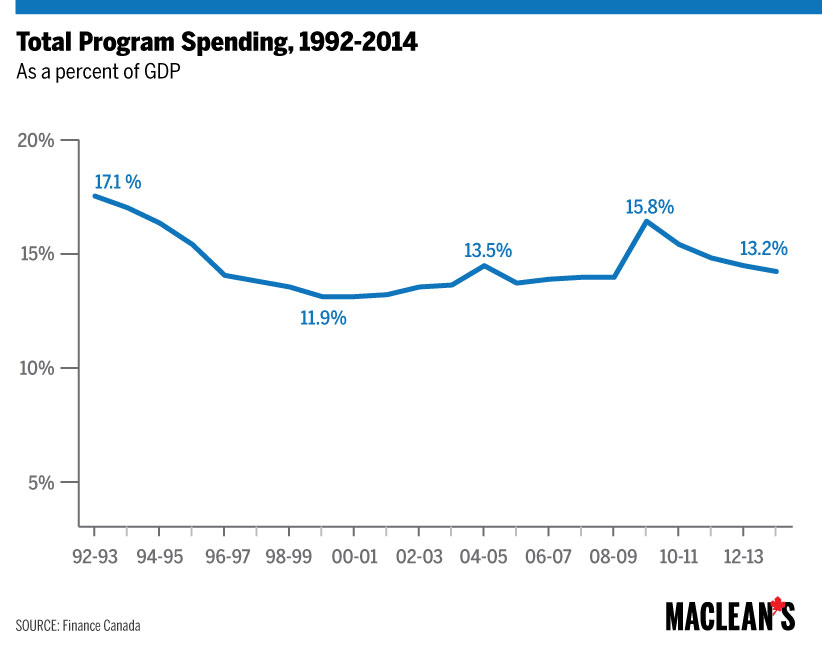
2. Liberals are conservative, Conservatives are liberal
Page points out that federal spending as a slice of the whole Canadian economy, or a percentage of gross domestic product, fell under the previous Liberal regime, from 17.1 per cent GDP in 1992-93 to 12.6 per cent GDP in 2005-06, and then rose under the Conservatives.
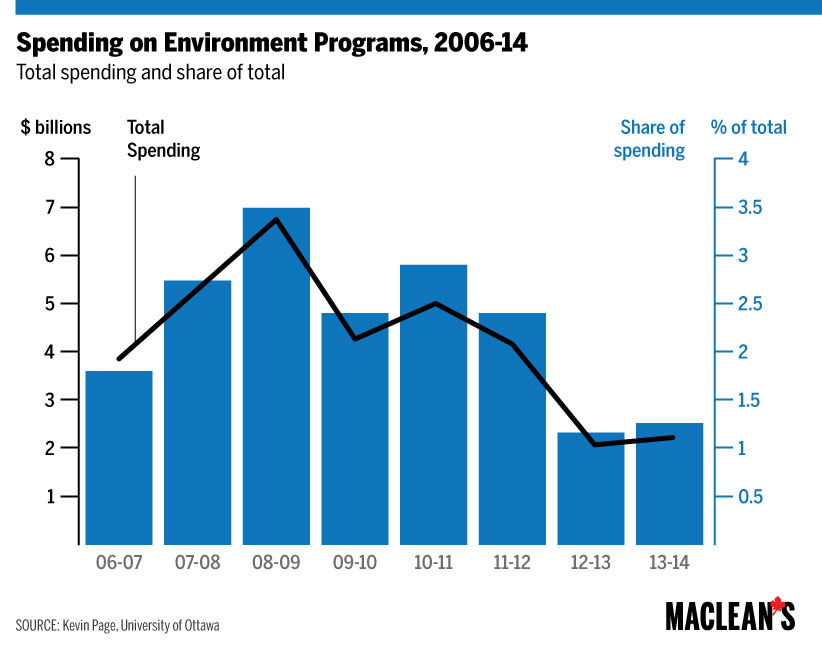
3. Less green for green programs
Restraint in the years since the recession-fighting stimulus spending of 2009-10 ended has not been even across all government operations. Spending on environment programs, for example, has dipped sharply.
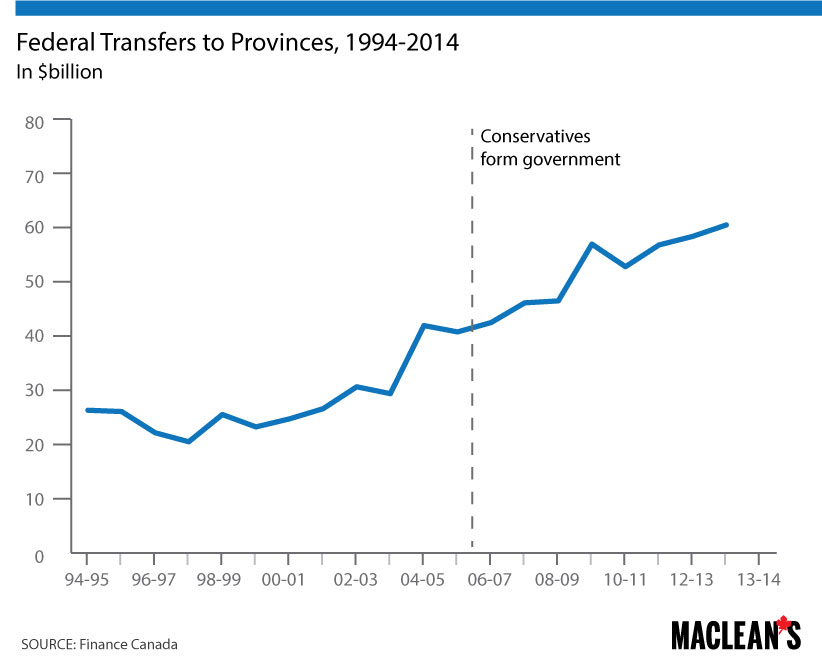
4. Transfers to the provinces: Harper’s calling card
A signature aspect of Conservatives spending, Page notes, is allowing transfer payments to individuals and provinces to increase while the rest of spending—what Ottawa spends on its own programs—has been held restrained in the post-stimulus years.
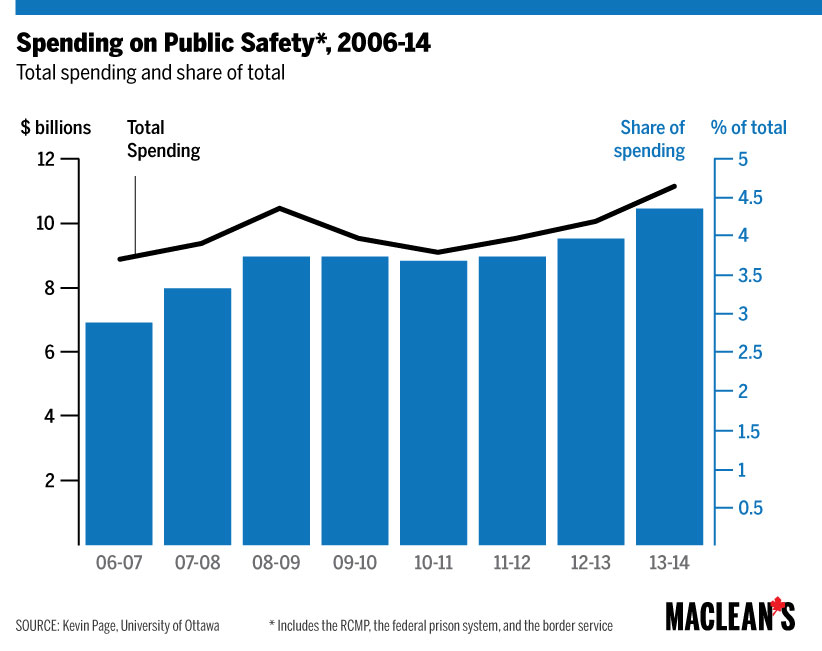
5. Public safety is a spending priority. . .
One area where spending has gone up is public safety, including on the RCMP and the federal prison system, and the border service.
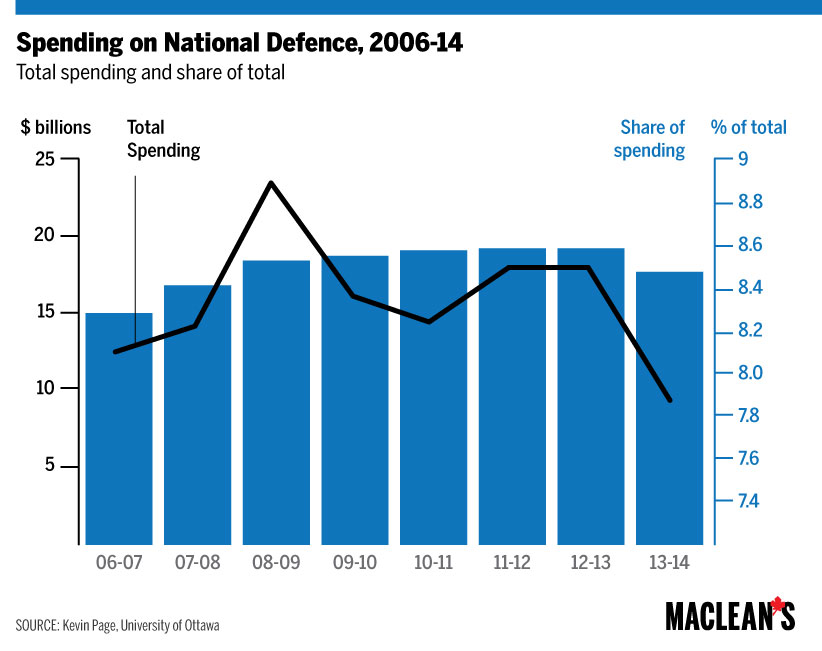
6. . . . but the military has felt the pinch
The Harper government has always made supporting the military a pillar of its messaging, but, in very recent years, at least, the spending track suggests a waning enthusiasm.
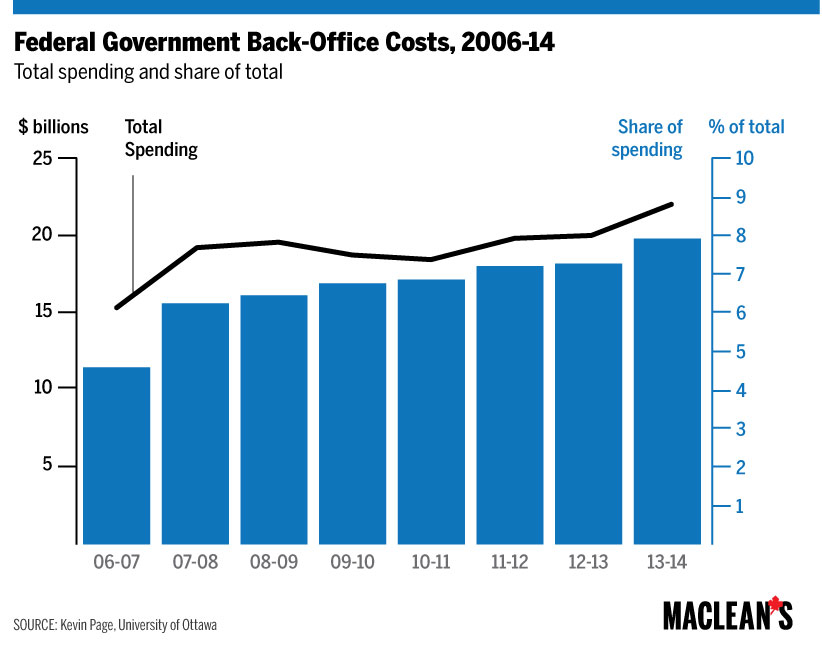
7. The back office, flush with cash
Back-office operations—functions such as information technology, human resources and contracting out—are supposed to be a target for Conservative restraint, as the government vows to make sure cuts don’t hit front-line services to Canadians. But Page’s data show those administrative functions getting more money, even as overall direct program spending is being squeezed.
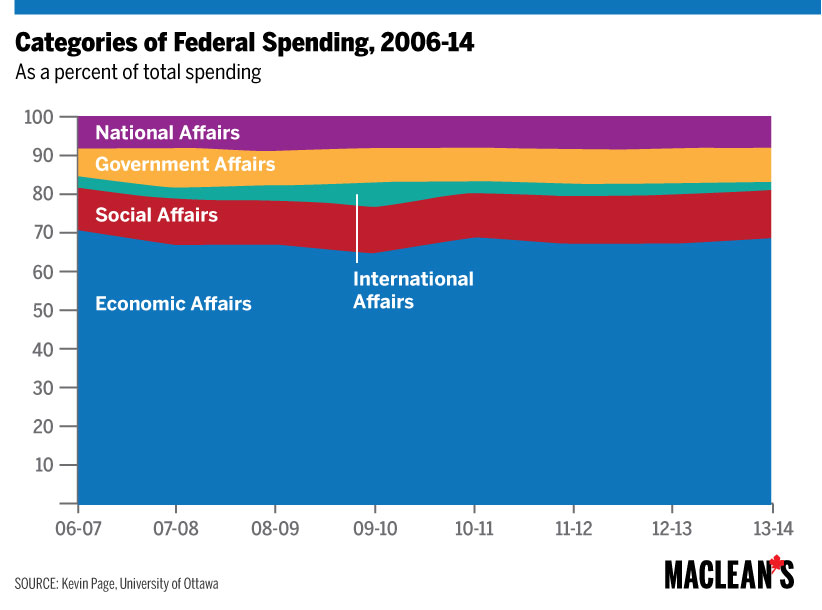
8. The bedrock beneath the volatility
Despite all these fascinating fluctuations in narrowly defined areas of spending, the biggest big-picture look at categories of federal spending shows what looks like rather static strata of spending—like the bedrock under the operations of government.
—with files from Amanda Shendruk