Why the Canadian labour market is already back to normal
The bathtub theory of unemployment
Bathtub filling up with water
Share
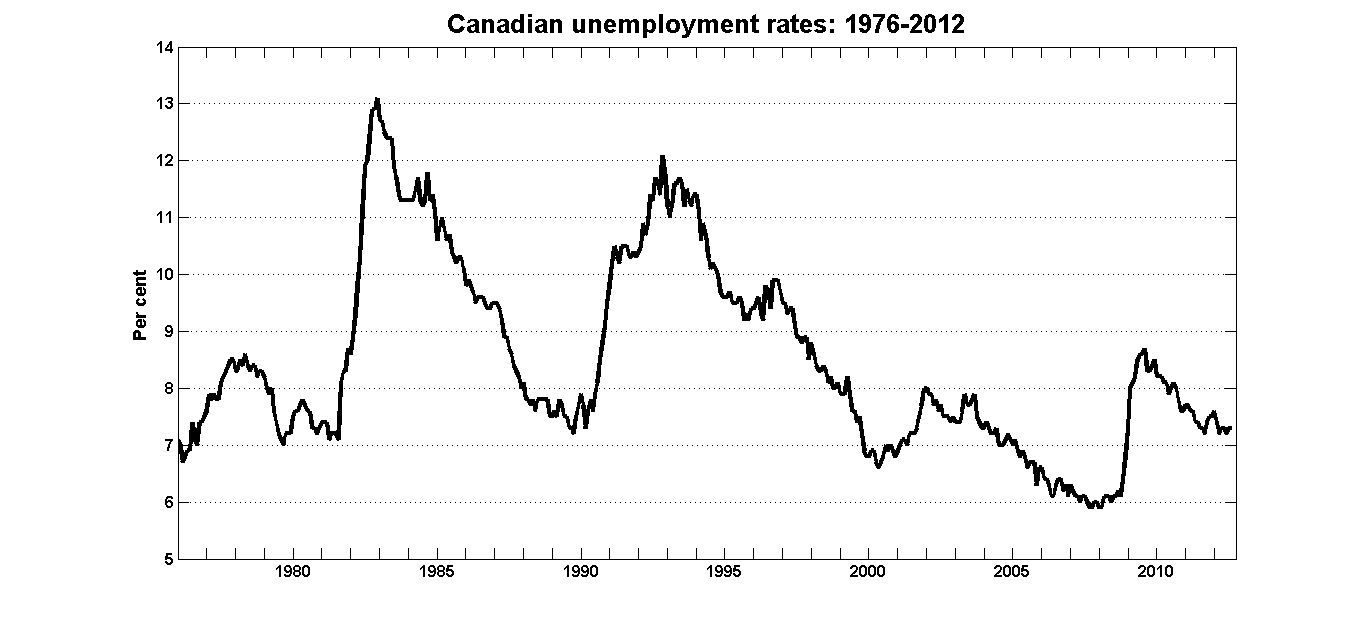
The Labour Force Survey release for August was typical of LFS releases since the recession ended three years ago: modestly good news, but not enough to put a serious dent in the unemployment rate. When will things get back to normal?
The answer is “things are already back to normal.” Canadian unemployment rates simply don’t fall quickly back to pre-recession levels during a recovery (click on the graphs to open a larger version in a new window):
To understand why unemployment jumps up quickly but declines slowly requires looking at the dynamics of the labour market.
There are two things to consider when thinking about fluctuations in employment: hires and separations (i.e. layoffs plus quits). Hires represent the flows of workers employment, and separations are the flows out of employment: the changes in the levels of employment are the differences between inflows and outflows:
Changes in employment = Hires – Separations
The number of people employed is best thought of as a bathtub with a continual flow of hires pouring in the top and a continual flow of separations draining out the bottom. If the inflow in is greater than the outflow, the bathtub fills up. If the flow out of the drain is greater than the inflow, then the bathtub empties.
The scale of the flows in and out of employment dwarf the changes in employment that dominate the headlines. This graph complied from data published by the US Bureau of Labor Statistics’ Job Openings and Labor Turnover Survey —for which there is sadly no Canadian counterpart— illustrates how and why U.S. employment fell during the recession and why it is taking so long to recover:
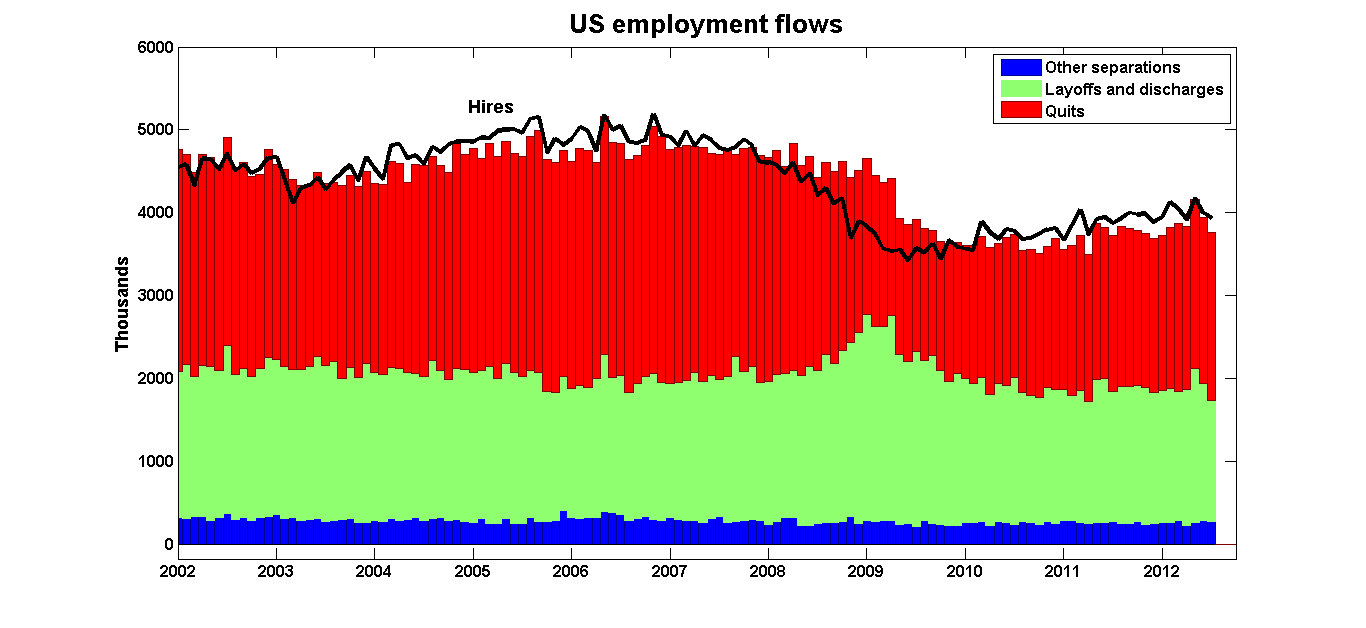
The change in employment is the difference between hires (the black line) and separations (the tops of the bars). The absolute size of these changes is measured in the tens and occasionally hundreds of thousands, compared to roughly four million people starting and leaving jobs per month.
Two things happened to the U.S. labour market in 2008. First, hiring dropped off. Then the financial crisis provoked a wave of layoffs. The combination of the two effects meant that net changes in employment were negative for a little over a year. The increase in employment in 2009 was brought about not by a rebound in hiring, but by a reduction is separations. Layoffs returned to their usual levels, but that wouldn’t have been enough to turn employment around. The key was that quits fell enough to offset the fall in hiring. U.S. hiring rates have still yet to return to pre-recession levels.
So even though U.S. employment may be increasing, the U.S. labour market is a long way from functioning normally. Firms are still reluctant to hire, and many workers are clinging to jobs they might have otherwise quit.
That’s the story in the U.S. What about in Canada? Although Statistics Canada doesn’t have a counterpart to the BLS’ JOLTS, it is posible to tease some information on labour market flows from the LFS public-use micro data files:
- Hires: Respondents who are employed are asked to report how long they’ve been at their current job. A reasonable proxy for hires in a given month is those who report being at their current job for one month.
- Layoffs: These are people who report being unemployed for four weeks or less, and who were laid off from their previous job.
- Job leavers: These are people who have been unemployed for four weeks or less, and who left their previous job for an unspecified reason.
An asterisk should be added to the last two series: some of these newly-unemployed are not people who lost or left their jobs in the previous month. They also include those making the transition from being not part of the labour force (not working and not looking for a job) to being unemployed (not working and looking for a job). But as we’ll see, it looks as though the fluctuations in these numbers are being driven by the business cycle.
The data are not seasonally adjusted, so I’ve calculated 12-month moving averages as a crude but quick way of dealing with the important seasonal cycles in hiring patterns. In addition to the totals, I’ve also added the data for full-time private sector employees. It turns out that almost all of the business cycle variation comes from this group: variations in public sector and in part-time employment play only a minor role. In each graph, the vertical axes have the same scale, but the axes for the private sector full-time employment data are shifted up to make it easier to compare the variations.
Here are hires:
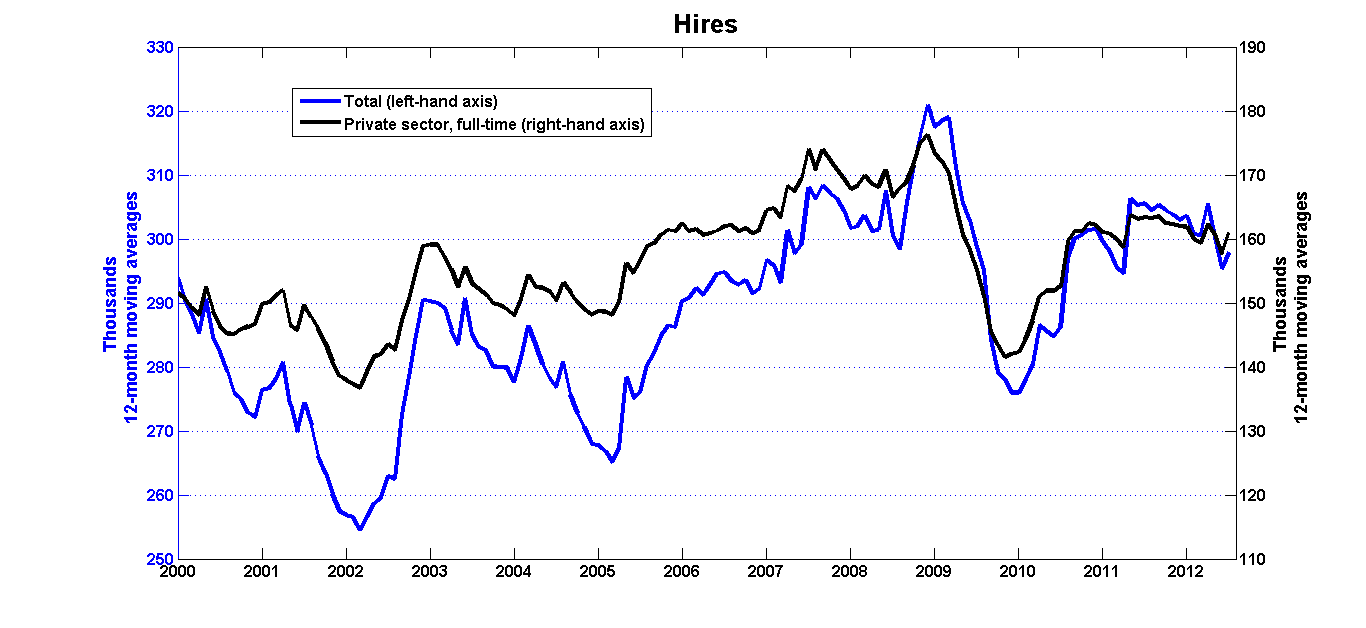
Again, it’s worth looking at the scale of hiring activity. The average monthly change in employment during 2000-2012 was about 20,000 workers; hiring rates were more than ten times as large. When the recession hit, monthly hiring fell by about 30,000-40,000. But unlike in the U.S., Canadian rates of hiring have pretty much re-established pre-recession patterns.
The drop in hiring was aggravated by a surge in layoff on the order of 50,000-60,000 per month:
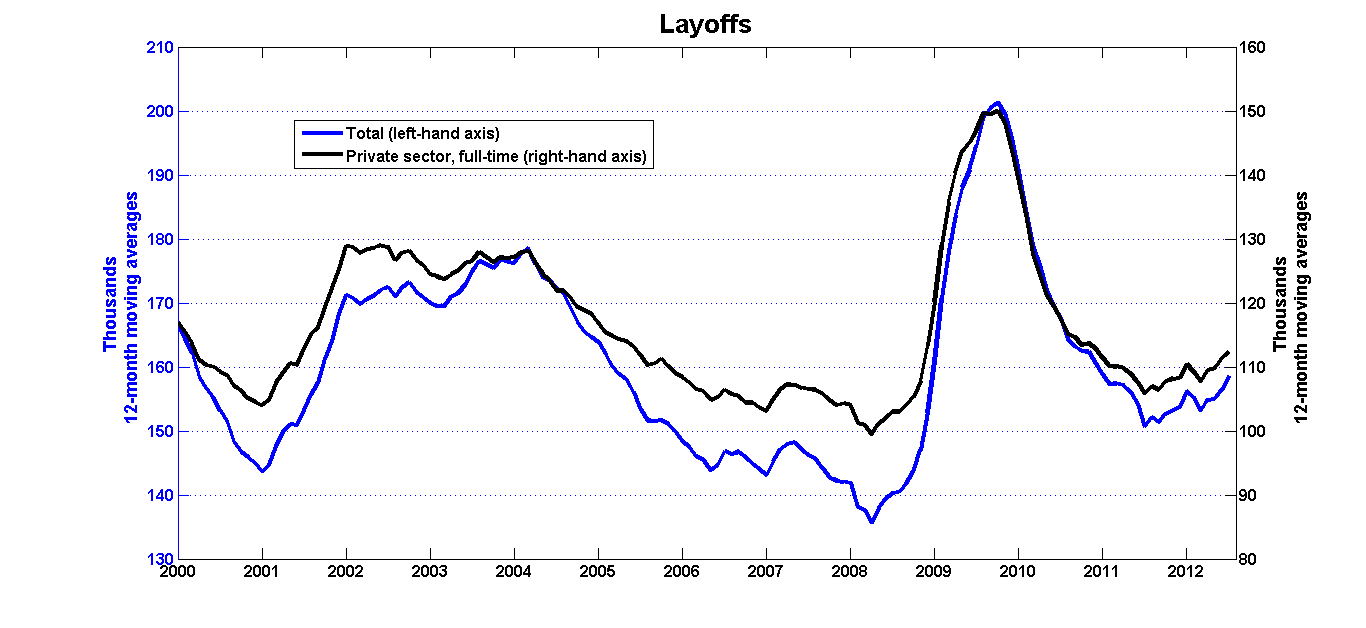
When you put a fall in hiring of around 30,000/month together with a 50,000/month jump in layoffs, you end up going a long way towards explaining the 80,000/month average loss in employment in the first four months of the recession. As in the U.S., the surge in layoffs ended sometime in 2009, and pre-recession patterns have pretty much been re-established.
The fall in employment would have been worse if workers hadn’t held on tighter to the jobs they already had:
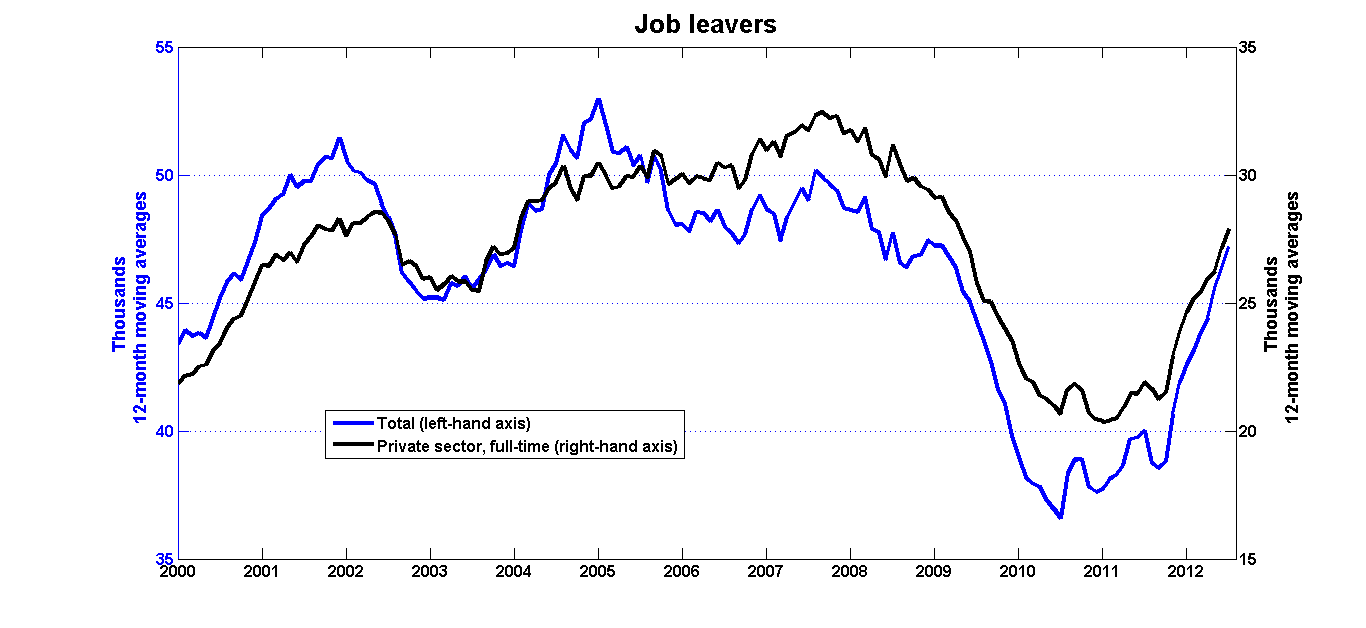
Job leaving rates stayed depressed for more than two years after the recovery started, but they’ve recently returned to normal. I interpret this as good news: fewer workers are hanging on to jobs that they would rather leave.
Connected to the employment bathtub is another one for unemployment (then there’s another yet for people who aren’t in the labour force, but we’re going to ignore it here). The mechanics are the same: separations are flows into unemployment, and hires are flows out. The difference is that the unemployment bathtub is smaller, so it fills up more quickly. When the recession increased the flow of layoffs and reduced the flow of hires, unemployment jumped from 1.1m to 1.6m between October 2008 and August 2009. Since then, it’s been slowly draining at the rate of about 4,000/month—roughly the same as before the recession.
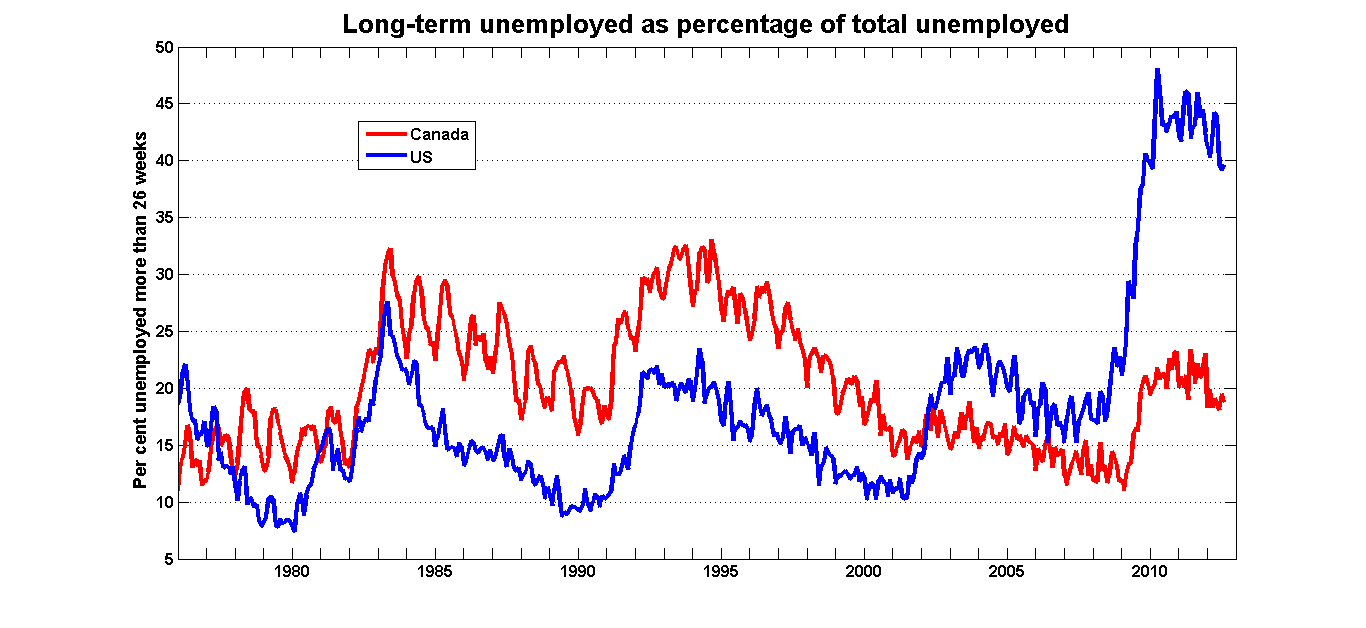
So the Canadian labour market has more or less resumed its normal flows in and out of employment and unemployment, while flows in the U.S. have not. Even if the net changes to U.S. employment are improving, the fact that labour turnover remains sluggish generates other problems. To push the bathtub analogy further, reduced flows in and out increase the likelihood of stagnation, in the form of a high number of long-term unemployed:
When the Canadian labour market is functioning normally, there are large flows of hires into employment and not-quite-so large flows of separations out of employment: the relatively small difference between the two is the change in total employment. And that’s what we’re seeing.