Charts to watch in 2021: The most important Canadian economic graphs for the year ahead
As we prepare to leave this surreal year behind, experts share charts showing what they’ll watch for in the economy in the coming year
Share
When it came time to compile this year’s collection of charts to watch, our seventh annual year-end chartstravaganza, it was obvious the elephant in the room would be 0.125 microns in size. COVID-19 has left its mark on every facet of our lives and by extension, the economy. The disruption to how we live, work and interact with each other caught the entire world off guard. As one economist remarked when approached for a chart this year, “perhaps an epidemiologist would have more insight into 2021 than an economist.”
Still, the struggle to make sense of this pandemic economy and its many contradictions continues. Against this backdrop we reached out to scores of economists, business leaders, investors and analysts and asked each to chose a chart that will be important to Canada’s economy in 2021 and beyond, and to explain why in their own words.
Some chose to focus on the the direct impact of COVID-19 in terms of caseloads and deaths, while others examined its effect on jobs, incomes, government and household finances—even the pressing problem of where to go when you’ve got to go.
Once again, thanks to everyone who contributed a chart this year. Join the conversation on Twitter with the hashtag #Chartapalooza.
- COVID-19
- Jobs and work
- Government finances and monetary policy
- Households
- Housing market
- Businesses, growth and competitiveness
- Energy and environment
- Markets
COVID-19
A world on vaccine watch
Stephen Gordon, professor of economics, Laval University (@stephenfgordon)
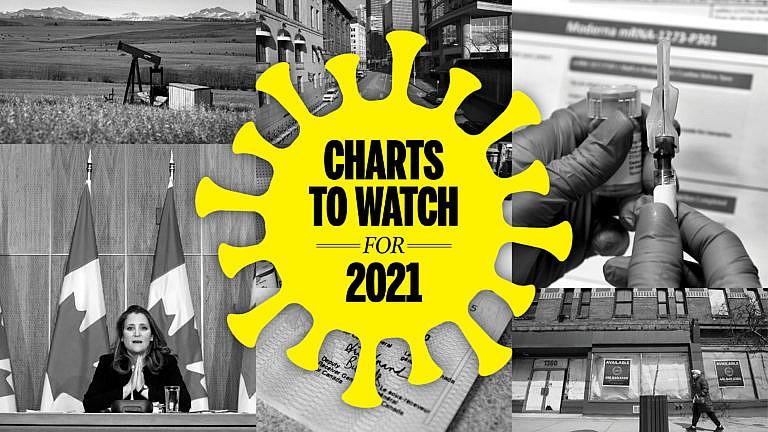
There are many indicators to keep track of over the next few months, but all recovery scenarios come down to when — or indeed, if — a COVID-19 vaccine will be made widely-available. Until that happens, we’re all stuck in the half-life of navigating a pandemic. There is no path to normalcy without a vaccine.
This is a chart of the probability that a coronavirus vaccine will be approved by the US Food and Drug Agency before April 2021, calculated from the Hypermind prediction market, which lets people wager on event outcomes. A few month ago, investors were fairly confident that a vaccine would be approved before April; the probability fluctuated between 65 per cent and 75 per cent during August and September. Market participants become markedly less optimistic after that, giving vaccine approval only a 50 to 55 per cent chance. The news in November that several vaccines saw promising results in trials revived optimism — the probability of a vaccine being approved by the end of March stood at 80 per cent as of the first week of December.
Atlantic Canada at risk from worsening worldwide COVID-19 cases
David Chaundy, CEO of the Atlantic Provinces Economic Council
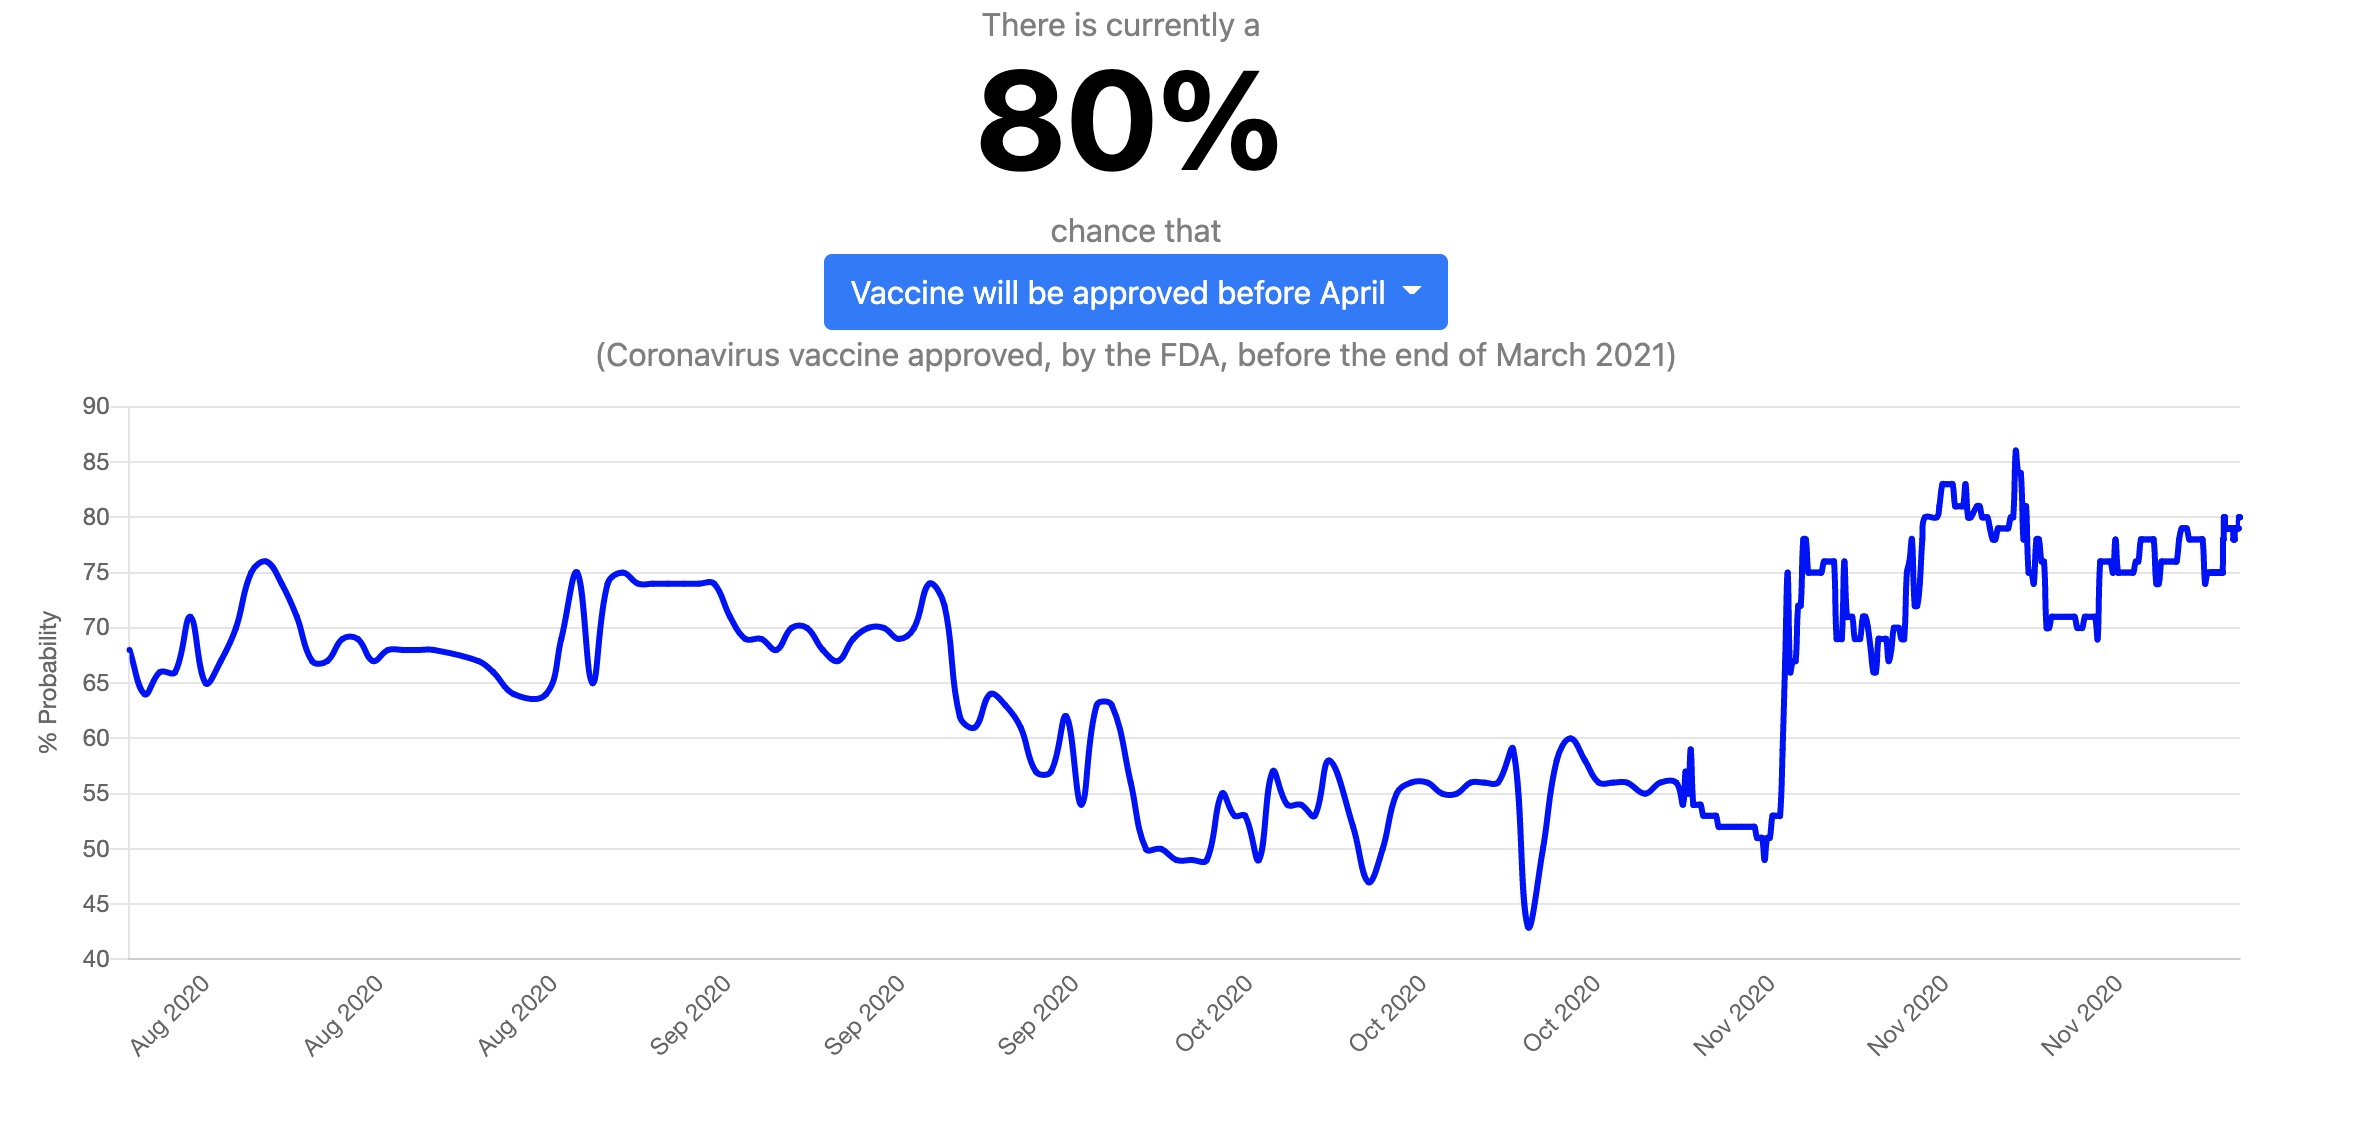
Atlantic Canada’s economy is recovering from the COVID-19 shutdowns imposed earlier in 2020. However, travel-related industries and those affected by physical distancing policies, such as restaurants, continue to struggle. Their recovery depends upon finding innovative solutions that allow for an easing of travel and physical distancing restrictions that minimize health risks and restores consumer confidence.
The biggest immediate risk to the Atlantic region’s outlook is the struggle facing other provinces, the U.S. and the EU – all key export and tourism markets – as COVID-19 surges and renewed lockdowns are imposed. The Atlantic region needs to remain diligent in following existing health protocols to avoid a similar fate and work on plans to allow a safe reopening of its borders for families, business and tourists in 2021. While an effective and widely-available vaccine will help accelerate the recovery, its timing remains uncertain. A vaccine should therefore not be used as the baseline planning scenario for policies to nurture the recovery next year.
COVID-19 death rates and job losses
Mike Veall, professor of economics, McMaster University
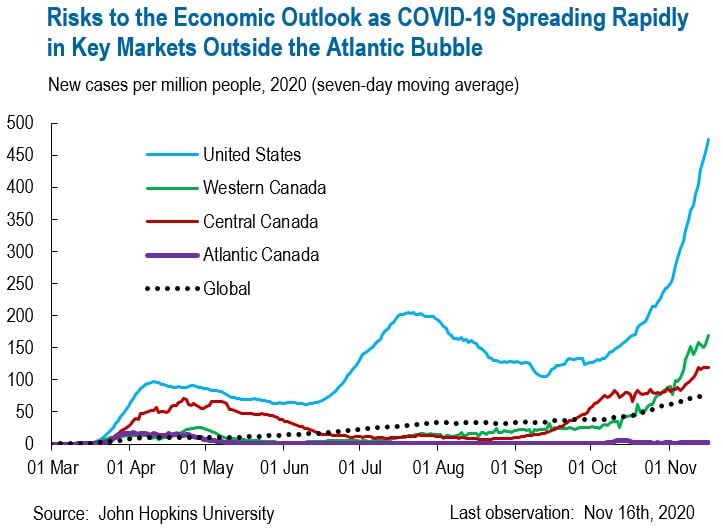
Besides emphasizing the size of the Ontario and particularly the Quebec COVID-19 death rates, this chart (with Daniel Tingskou) shows that among the other provinces that had lower death rates, job loss rates varied substantially
The vaccines are coming
Derek Holt, head of Capital Markets economics, Scotiabank

Under present guidance, 6.1 billion doses of COVID-19 vaccines will be produced by three western companies and one Russian firm from now to the end of 2021. Given multiple doses, that will be enough to inoculate 3.6 billion people as shown in the chart, or almost half of the world’s total population. Fifteen other vaccine candidates remain under possible development which could further inflate coverage alongside potentially further production scaling. Material challenges remain, including distribution, acceptance, inequality, how long antibodies last and whether the COVID-19 virus will be stable. Advance commitments by countries to companies may have gone a long way to settling distributional challenges. If the other risks prove to be manageable, then while years of scarring effects will persist, a strong economic rebound could be just around the corner and fed by vaccines, pent-up demand and a stimulus overshoot. This could buoy stock markets and bring back prematurely written-off activities.
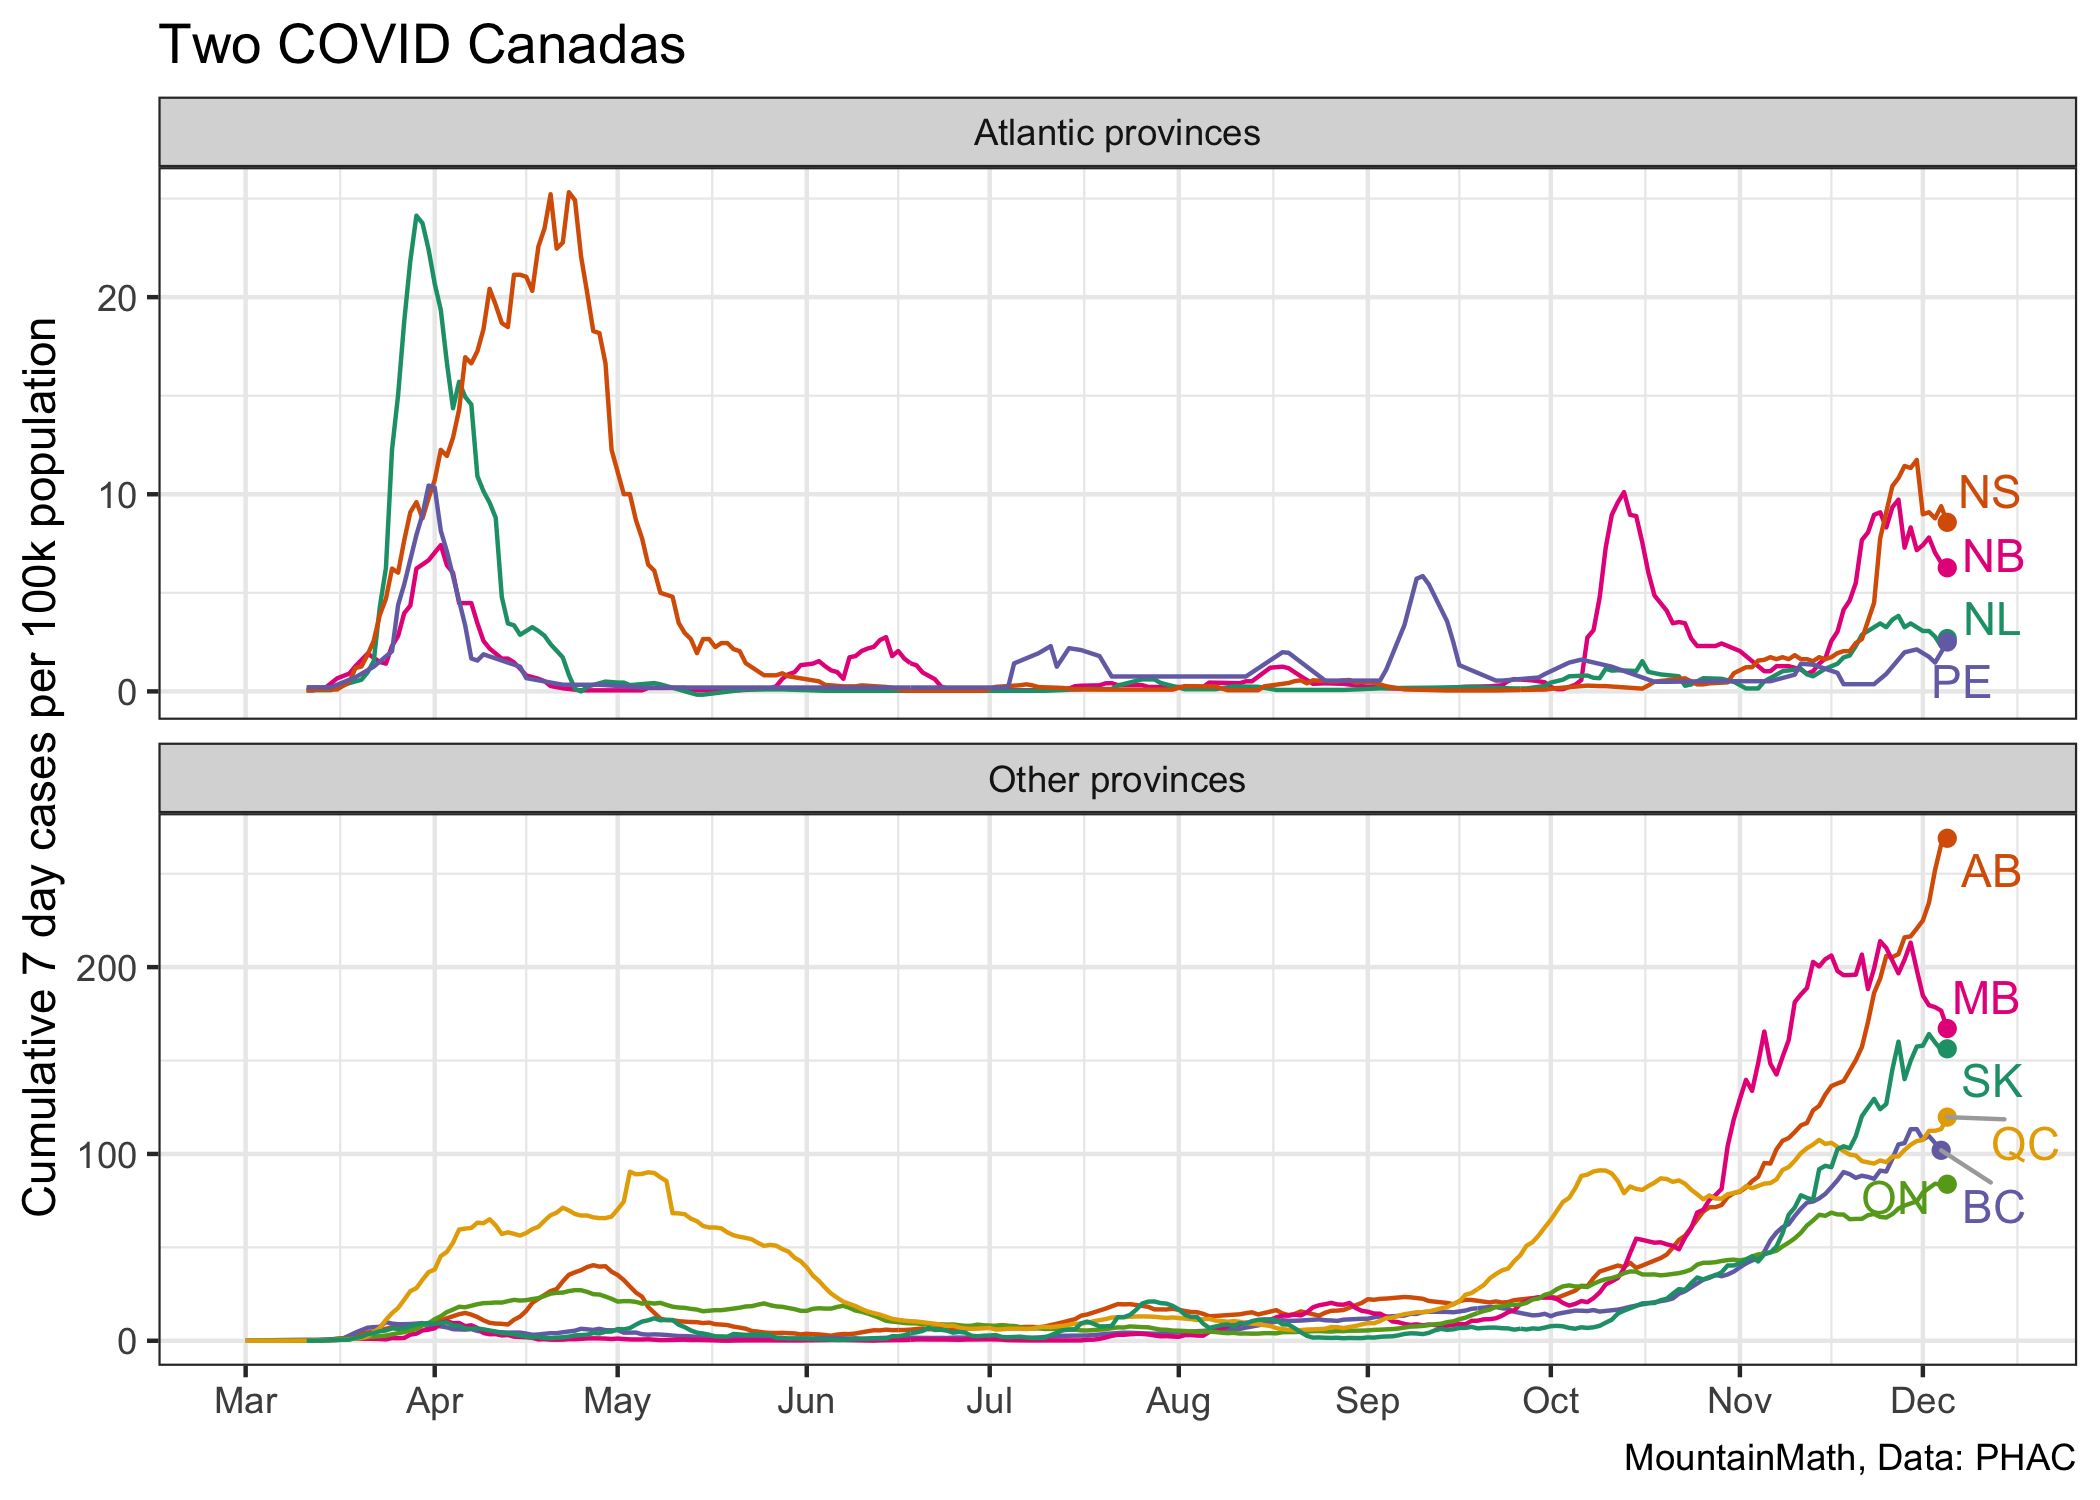
A tale of two COVID Canadas
 Jens von Bergmann, founder of Mountain Math Software and (CensusMapper, @vb_jens)
Canadian provinces have adopted two distinct strategies on how to respond to the COVID-19 pandemic, with the Atlantic provinces aiming to keep local transmissions near zero while the other provinces focused on managing hospital capacity. Atlantic Canada also saw high case counts during the first wave, but have managed to successfully suppress local transmissions since then. The other provinces have seen rising transmissions throughout late summer and fall. Atlantic Canada’s COVID death toll per population stands at one tenth of that of the other provinces. While the relative isolation of the Atlantic provinces does offer some advantages, the actual differences to the rest of Canada are less stark than one might expect. The Atlantic provinces had the same rate of automobiles border crossings per population coming in from the US as the rest of Canada, although their incoming truck traffic per population was only about of that of the rest of Canada. Similarly, the rate of people (excluding crew) coming in by plane is comparable.
It remains to be seen how the Two Covid Canadas will fair over the coming months and what will ultimately prove to have been the better strategy.
Canada not immune from vaccine skepticism
Danielle Goldfarb, head of global research, RIWI Corp. (@DIGoldfarb)
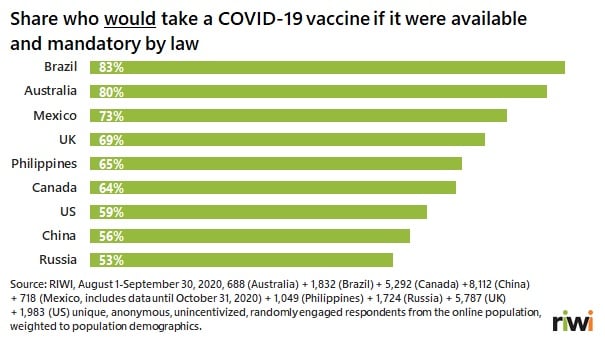
Perhaps the most important factor determining the shape of the economic recovery will be whether and when enough people take a COVID vaccine to achieve herd immunity. Canada has a strong economic stake not only in its own citizens getting vaccinated but in global vaccination and global economic recovery. With a relatively small domestic market, Canadian livelihoods depend heavily on U.S. and global exports, international students, and tourists.
Vaccines on their own don’t save lives; widespread vaccinations do. The data in this chart show notable skepticism about vaccines in Canada, the U.S., and other countries, even in the face of the pandemic’s major economic and social disruptions. They reflect broad-based sentiment including opinions of those who are not typical survey takers nor express their pro- or anti-vaccination views on social media, and they were collected anonymously to maximize the chances of honesty on such a sensitive topic.
Excess deaths during the pandemic
Miles Corak, professor of economics, City University of New York (@MilesCorak)
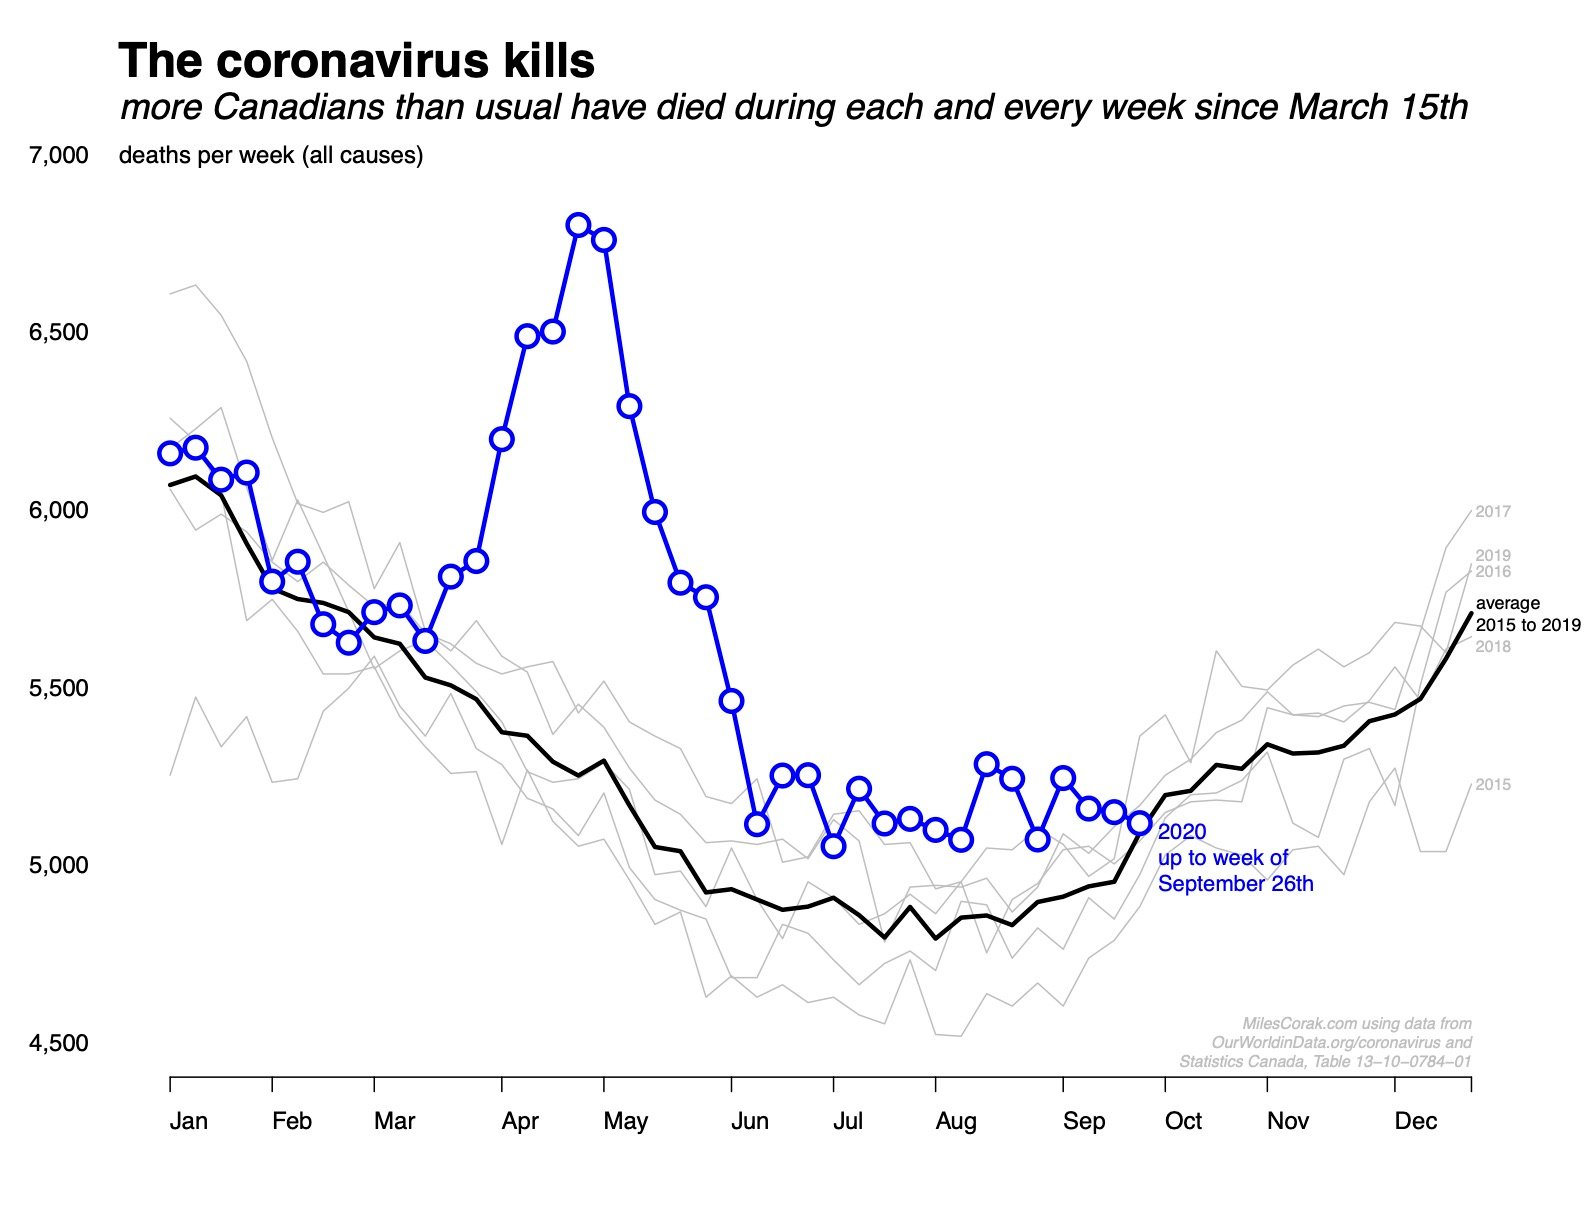 Statistics Canada recently reported that there “were more than 7,500 excess deaths across Canada from March to the start of June 2020, which aligns closely with the 8,345 deaths caused by COVID-19 over that same period.”
The Coronavirus kills.
But the decisions we make can do something about it. Excess deaths disappeared by September, but we should remember as our politicians have increasingly talked about having to “balance” economic activity with health, it is death that is on the other side of the scale.
Jobs and work
The long-term unemployment scar won’t heal easily
David Rosenberg, chief economist, Rosenberg Research (@EconguyRosie)
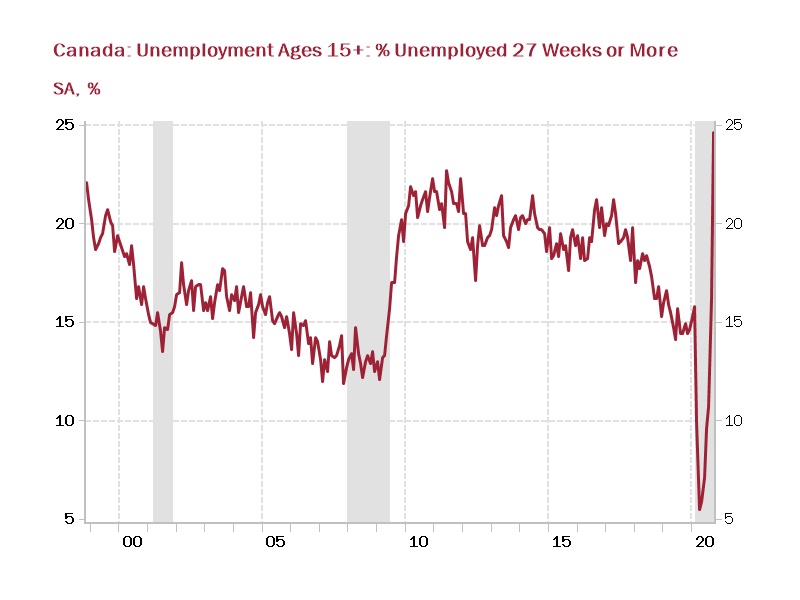
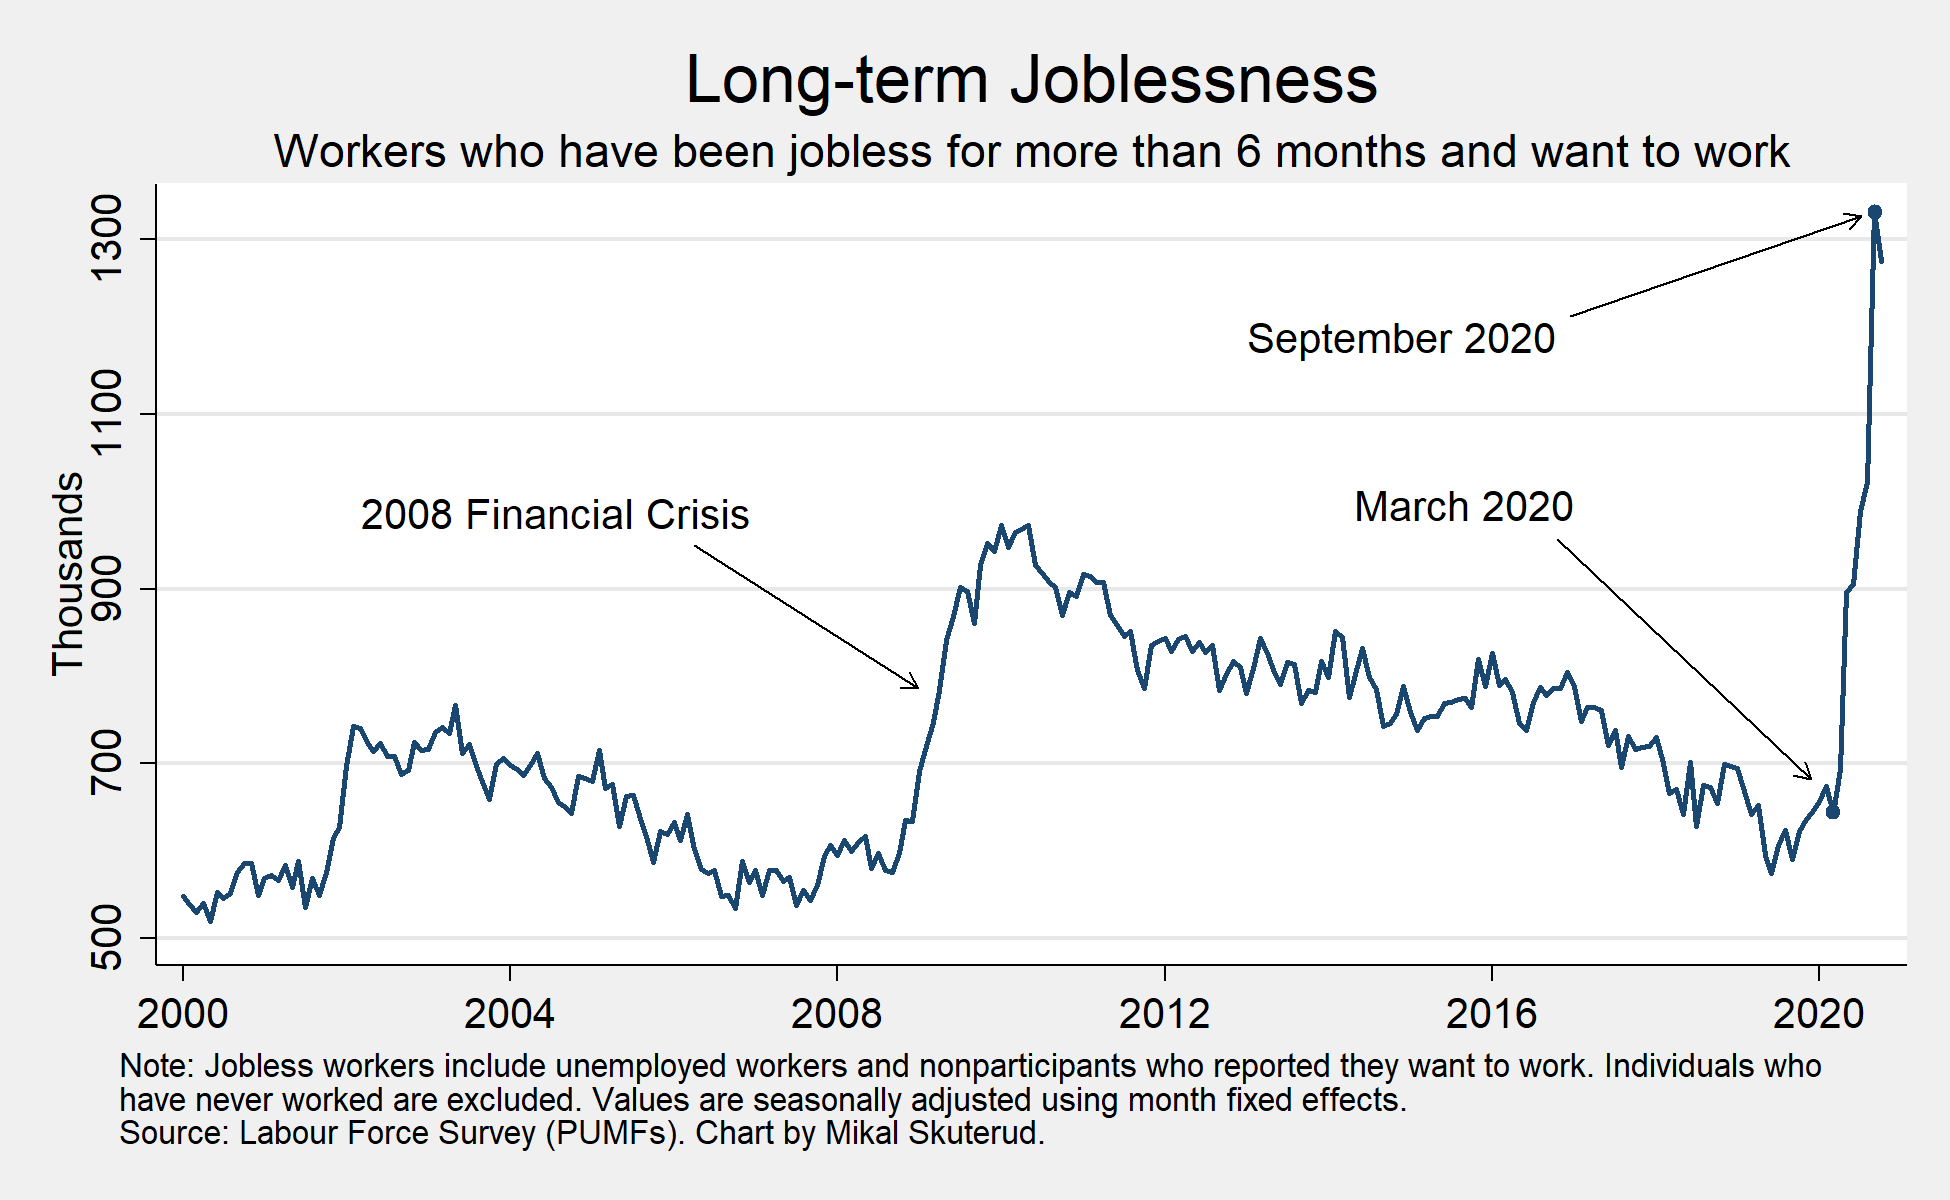
The road to recovery will be bumpy for Canada. Even with steady employment gains for six months-running, hundreds of thousands of Canadians remain locked out of the labor market as cases of COVID-19 rise in major centres. One-in-four Canadians are now long-term unemployment, which speaks to a persistent impact from this pandemic that will leave scars on labour markets for years to come. Further government support will likely come, but as is the case in the U.S., the deferral period for mortgages and household debt payments (credit cards, lines of credit, etc.) is ending, and the Federal coffers aren’t bottomless. Which means that we are bound to see defaults ahead, with repercussions for consumer spending and service-sector jobs that depend on people’s disposable incomes.
Stronger employment growth needed
Brendon Bernard, economist, Indeed Canada (@BrendonBernard_)
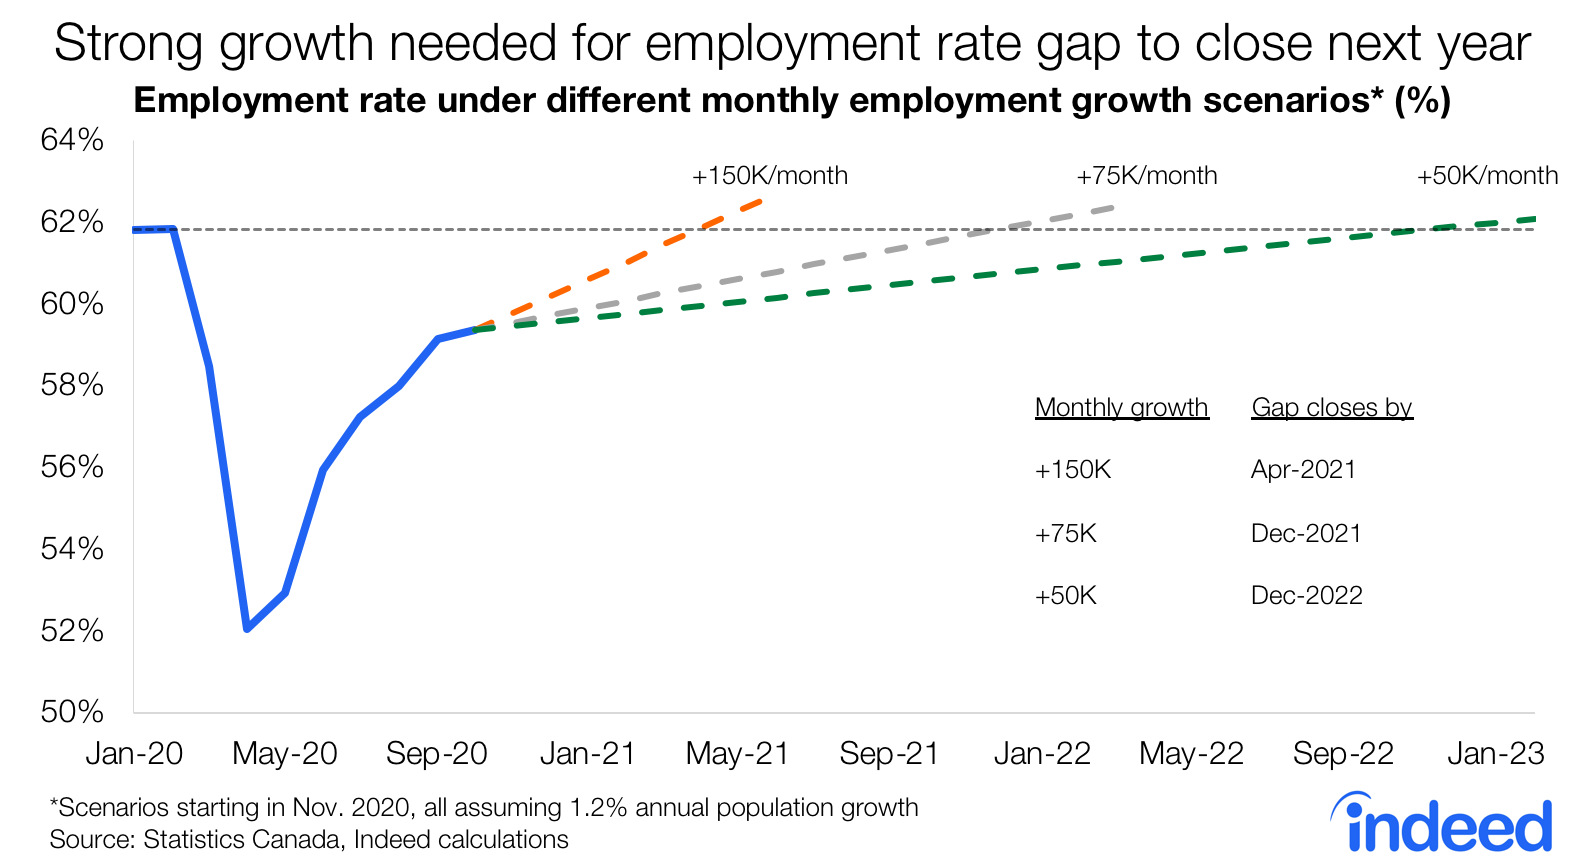
Despite recouping nearly 80 per cent of its early-pandemic losses, as of October, Canadian employment remains further from its February level than its peak-to-trough decline during the 2008-2009 recession. What sort of potential time-range are we looking at for getting back to normal?
If employment growth can sustain a rate at the lower-end of recent months, around 100 thousand per month, the share of the adult population with a job should return to its pre-pandemic level next year. However, such a pace would be quite rapid compared to a typical expansion. At a more modest (though still strong) 50 thousand per month, it’ll take until the end of 2022 for a full employment rate recovery.
What plays out will hinge on numerous factors, a swift end to the pandemic being most important. It’ll also depend on how quickly those permanently laid-off, some who’ve been jobless for extended periods, can find new work. The good news for job seekers is that job postings on Indeed Canada are returning to last year’s trend across an increasing number of sectors.
The uneven hit to self-employment from COVID-19
Stéphanie Lluis, professor of economics, University of Waterloo (@StephanieLluis)
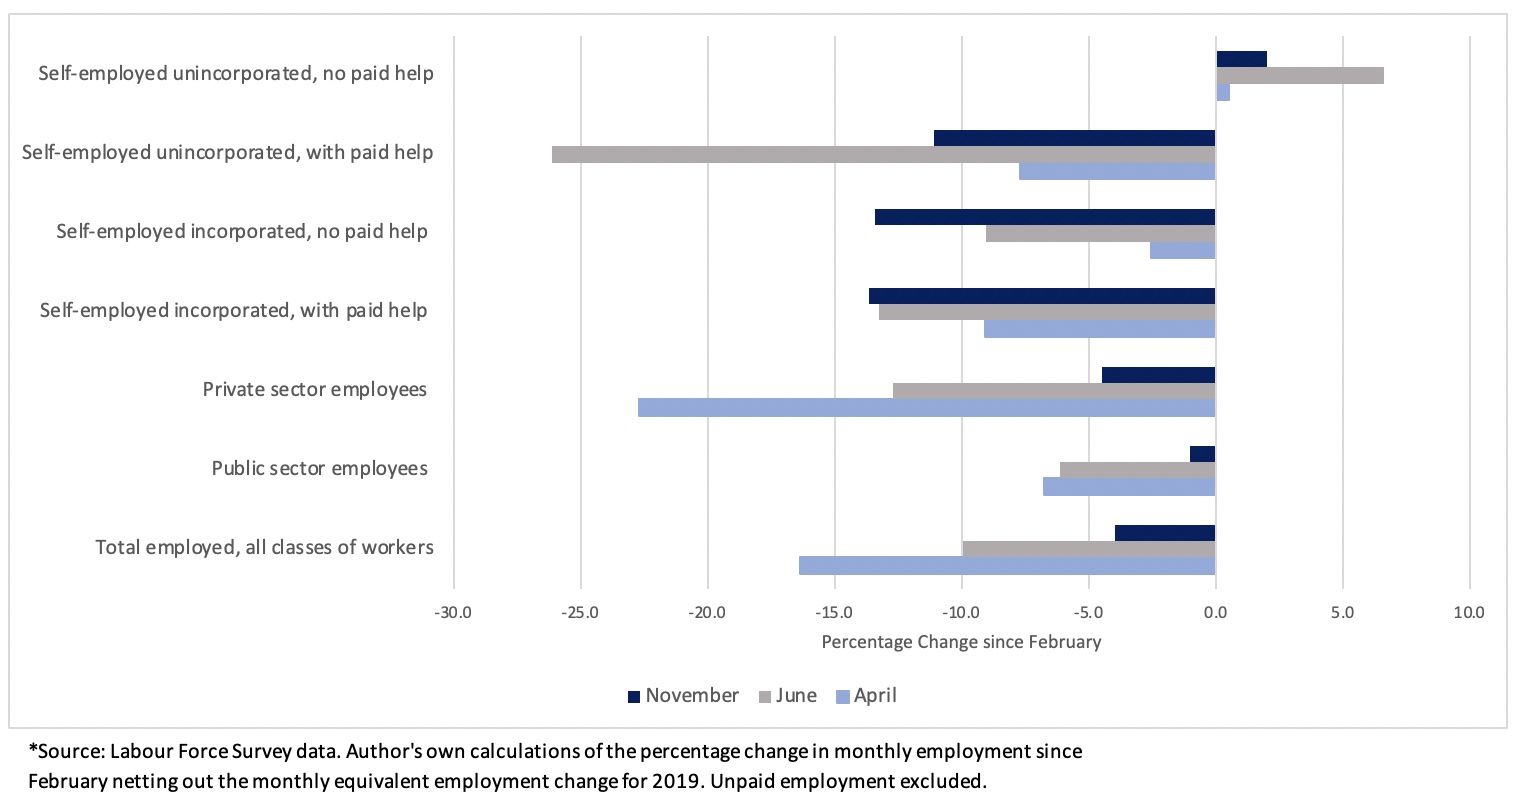
The early phase of the pandemic created an unprecedented decline in total employment levels of 16 per cent. In April, the health crisis hit private sector workers the most with a drop in employment levels of 22 per cent relative to seven per cent for public sector workers and under 10 per cent for the self-employed.
By November, following the gradual reopening of the economy over the summer months, total employment partially recovered and currently sits around four per cent below its February level but the employment recovery has been highly uneven especially among the self-employed. While total self-employment in November is six per cent below its February level, employment for the incorporated and unincorporated self-employment with paid help representing entrepreneurs and small business owners – and typically about half of the self-employed – continues to fall, and is currently below its February level by double digits. In contrast, the unincorporated self-employed without paid help, the other half of the self-employed, engaging in gig employment have not experienced any decline in employment.
While income support programs for the self-employed, such as the Canada Recovery Benefits, provide crucial assistance during the pandemic, given the current compositional shift in self-employment, particular attention needs to be paid to ensure financial support is provided to all the self-employed.
Measuring the she-cession in Canada
Armine Yalnizyan, economist, Atkinson Fellow on the Future of Workers (@ArmineYalnizyan)
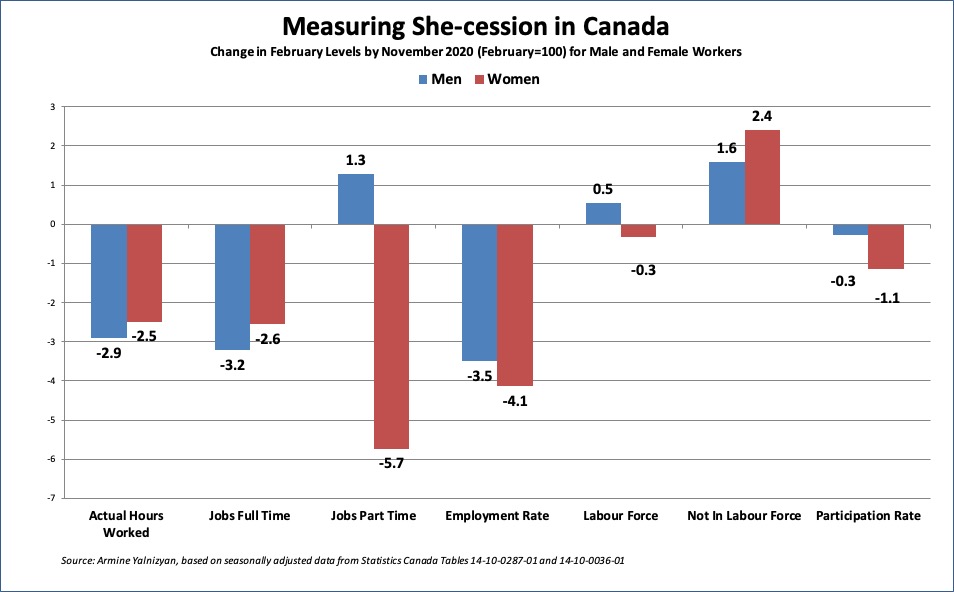
The world’s first recession that hit women (and low-paid, racialized and young) workers first continues to hit women hardest. In February, before the pandemic hit, women made up half of payroll, but – except for the levels of part-time employment – women’s metrics were lower than men’s on virtually all paid-work parameters (average actual hours worked, employment rates, full-time employment, participation rates). By November, women had fallen even further behind on every front, notwithstanding a labour market that had recovered 76 percent of hours worked. The last Labour Force Survey results for 2020 showed that employment growth was slowing, as contagion rates accelerate. We are flattening the wrong curves.
The most troubling trend is that, between February and November, 58,000 more men joined the labour force despite the pandemic’s economic impact, while 31,000 women left it. The ranks of those who are no longer in the labour force grew twice as fast for women as men (147,000 more women were added to the “not in the labour force category” from February to November, compared to 74,000 more men). This includes retirees, and women who cannot get back into the job market or have thrown in the towel because of lack of childcare. Simply put: there will be no recovery without a she-covery, and no she-covery without childcare.
This is not just a woman’s problem; it’s a macroeconomic problem. Household spending accounted for 57 percent of GDP before the pandemic hit; the biggest block of spenders are households with young children; and women make up 40 percent of the incomes of such households. The longer women don’t recover paid work, the slower will be recovery, for all.
Armine Yalnizyan is an economist, Atkinson Fellow on the Future of Workers, and the person who coined the term “she-cession”, in March.
Women in the workforce have fared far better in Canada
Beata Caranci, chief economist, TD Economics
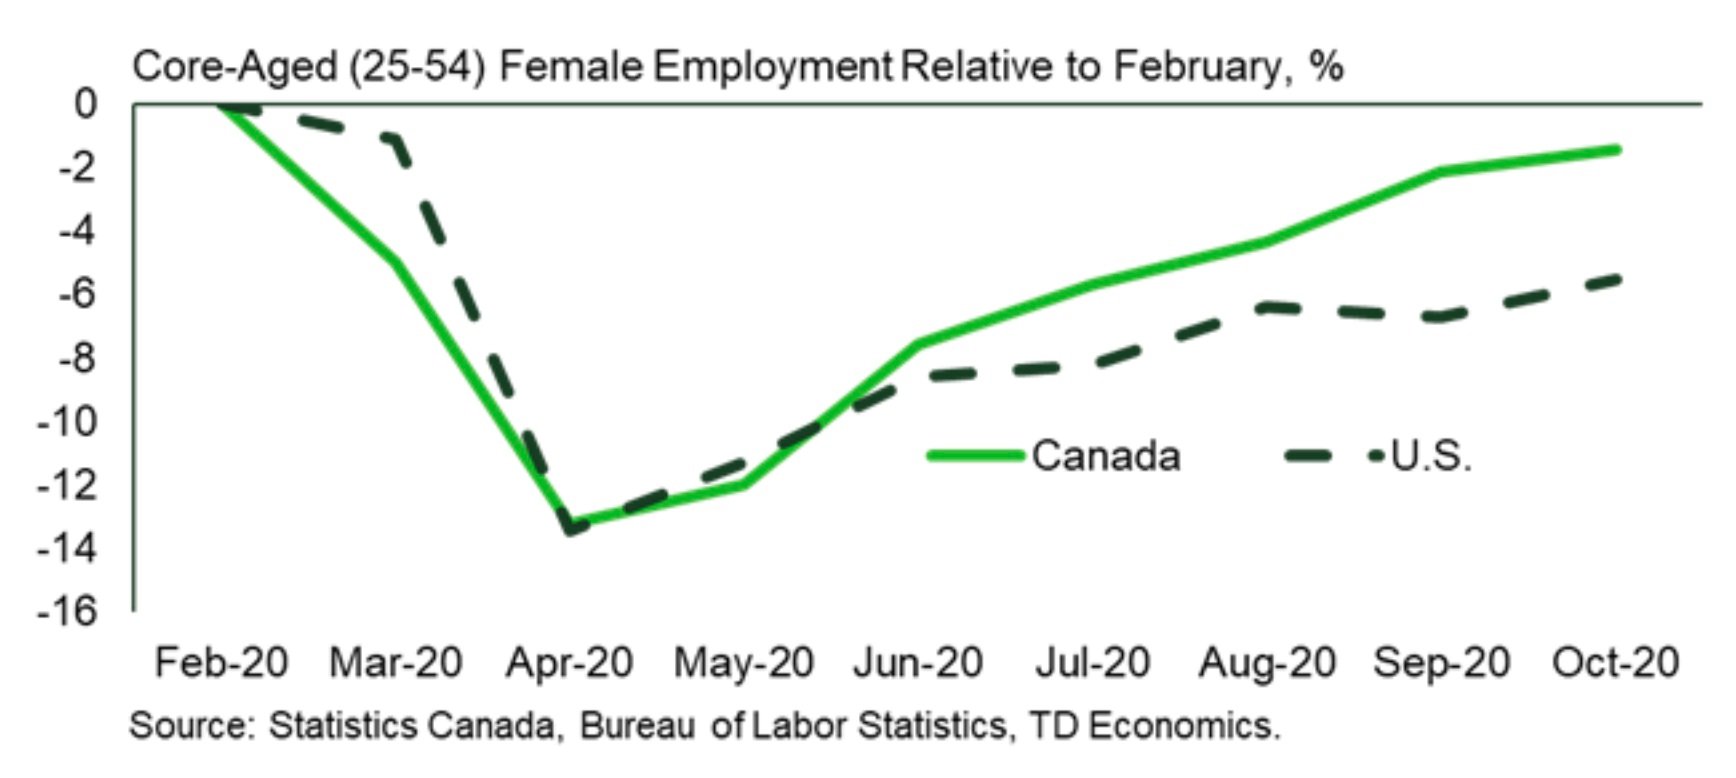
“Just what makes that little ‘ol ant, think he can move that rubber tree plant”. Remember that childhood song of hope? Well, hope can sometimes turn to reality. Ants can also lift 10-50 times their weight, and that seems to be what Canada’s labour market did relative to its much larger peer to the south. Many factors stand behind this, including Canada placing more resources towards health and education, showing much stronger policy support for women in the workforce, and businesses having fewer fits-and-starts in reopening. Canada’s second inflection wave is already a third for the U.S. And the scale of hospitalization rates in the U.S. doesn’t bode well for job market outcomes, regardless of whether regional governments put in place formal business restrictions. Even with a vaccine arriving in the U.S. ahead of Canada, a short advantage in timing won’t cause Canada to mirror the U.S. labour market outcomes. Likewise, Canada is more likely to exit the pandemic with less structural headwinds. This is not unfamiliar territory for a country that’s already done it twice before, when Canada outperformed the U.S. labour market in 2008/09 and 2001.
A long way back for low-income workers
Dawn Desjardins, deputy chief economist, RBC
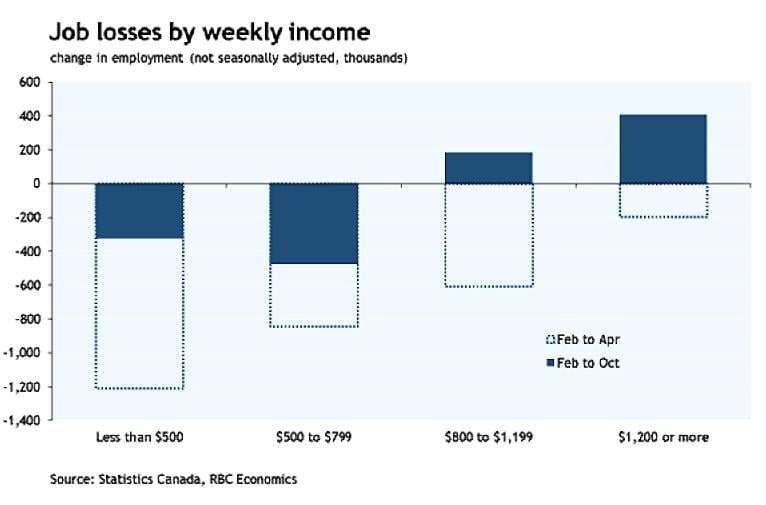
Three million Canadians lost their jobs in March and April when severe containment measures were in place. By October with parts of the economy having reopened, 2.2 million workers got their jobs back. However the labour market recovery is far from complete and the jobs that have yet to be recovered are concentrated at the lower end of the wage scale. Further these are jobs in sectors that will face a more difficult time coming back until there is a widely distributed vaccine.
Skills training a needed fix for long-term unemployment
Mikal Skuterud, professor of economics, University of Waterloo (@mikalskuterud)
Extensive research has shown that the longer jobless workers are out of work, the harder it is for them to get back. There are three explanations for this phenomenon. First, employers may discriminate against job applicants whose resumes show long gaps in work history. Second, workers’ skills may atrophy or become less relevant over the course of their jobless spells. Third, job loss and loss of income is stressful, can adversely impact workers’ self-esteem, create mental health challenges, and force workers to find alternative sources of income, all of which can result in workers disengaging from formal employment. Initial COVID-19 shutdowns in March and April saw large increases in layoffs, many of which became permanent job separations by summer 2020. The ability of the Canadian economy to recover from this crisis depends in large part on the extent to which these workers successfully return to employment, which in many cases will require skills training investments and transitions to new sectors and occupations of employment.
A ‘new normal’ in the making
Sébastien Lavoie, chief economist, Laurentian Bank Securities

2021 will bring additional signs of changing people’s habits in a post-COVID world. In a way, consumer and business surveys will be more useful than high-frequency, traditional economic data. Current surveys asking for preferences once herd immunity is reached indicate a preference for a work hybrid model including more teleworking, more space at home and more e-commerce. The reshape of housing conditions under way is poised to continue as technology adaptation favours time and costs savings. Growingly popular outskirt areas could come further at the expense of rental, condo, office and commercial markets in expensive core urban centres, particularly for millennials. This is one of the multi-potential changes in consumerism. The 2021 transition year will bring more clues about the new version of the Roaring 20s. A mix of autonomy, socialization and decadence could take the form of excessive demand for local entertainment activities and premium leisure activities including travel starting in late 2021, both supportive for consumer credit activity. Advertising will contribute to guide consumers in new iconic symbols as the automobile and glamour clothing fashion emerged as favourites of the middle-income class in the 1920s.
A unionization rebound
Jim Stanford, director, Centre for Future Work in Vancouver (@JimboStanford)
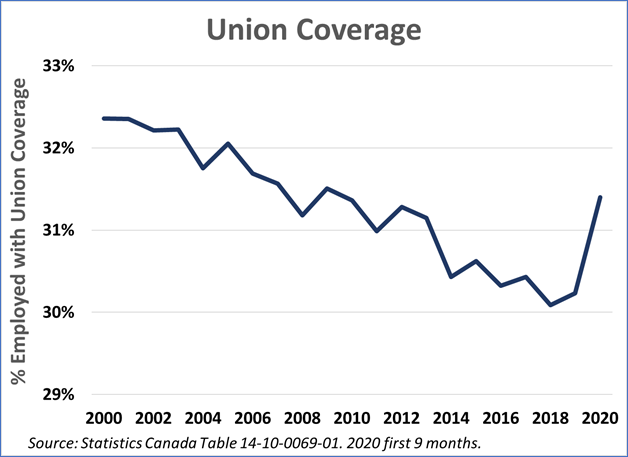
Canada’s trade unions have fought for years to maintain their foothold in an economy being reshaped by global competitive pressures, smaller workplaces, and the rise of precarious work. Now, however, there are early signs that union power may be turning around – and the COVID-19 pandemic is part of the story. This chart shows union coverage in the overall labour market: the proportion of all employed Canadians (including self-employed) covered by union contracts. Union coverage eroded gradually since the turn of the century, from around 32 per cent down to just over 30 per cent. Canadian unions have hung onto their members better than in most industrial countries, but the trend was still negative. In 2019, however, union coverage ticked slightly upward. And this year, with the pandemic, coverage increased sharply: to 31.4 per cent over the first nine months of the year, the highest in a decade.
The pandemic has had several effects that boost union coverage. Public sector jobs have become relatively more important; union coverage is higher in these jobs. Workers with union protection were less likely to lose their jobs during the COVID-19 shutdowns (thanks to stronger job security provisions), so they make up a larger share of remaining employment. Finally, new health risks and other challenges of working in a pandemic have spurred many workers – in long term care centres, restaurants and cafes, grocery stores, and more – to seek protection of a union. Renewed union influence would help to improve wages, conditions, and job security as Canada’s labour market builds back after COVID-19.
Alberta’s employment troubles felt well beyond its borders
Rob Roach, managing director, ATB Economics (@RobRoachCalgary)
When it comes to economic statistics, the number one thing people want to know about is not capacity utilization rates, GDP growth, or even interest rates. It’s jobs. This is where economic statistics get personal for most of us. Will I have a job? Will my kids get good jobs? Will my friends and neighbours stay employed?
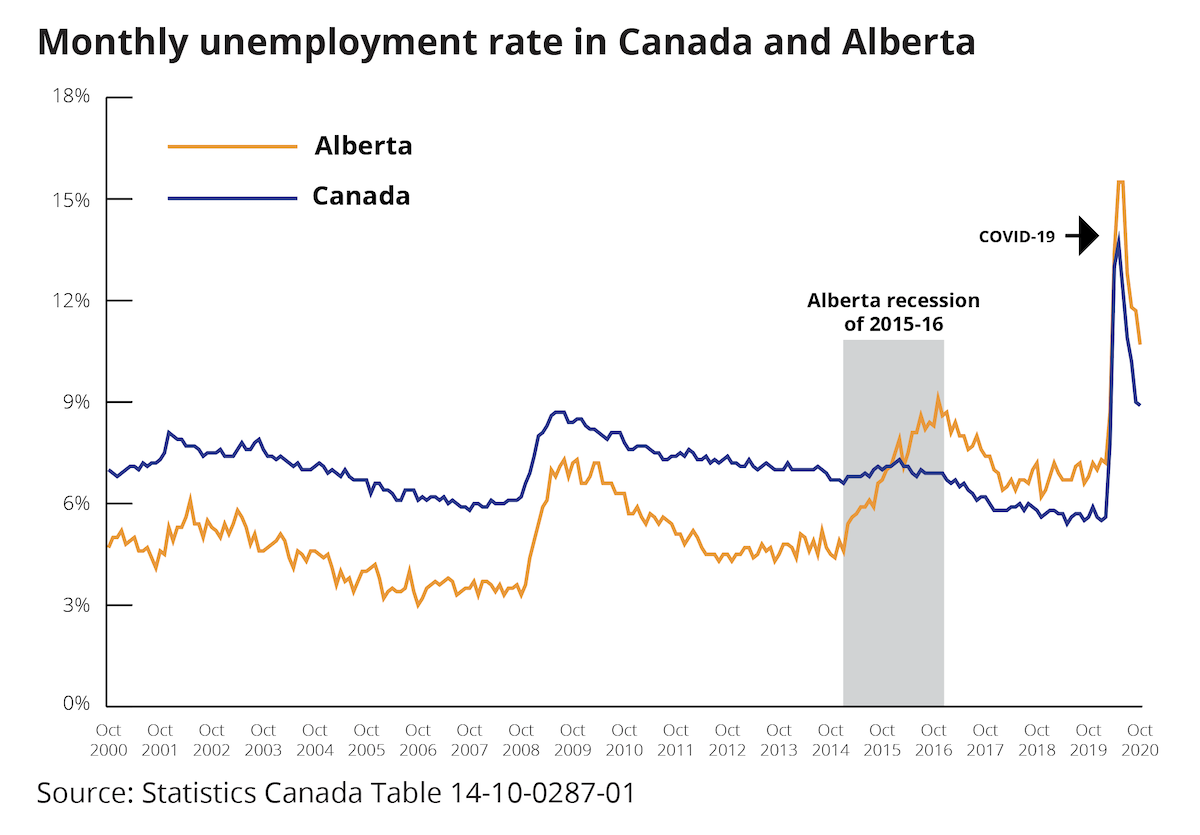
The pandemic pushed the national jobless rate to its highest point in decades in May. Even though the rate has fallen, it remains elevated, and Canadians are anxious about when and if all of the jobs will come back. This is especially true in Alberta where the unemployment rate has been unusually high since the provincial recession of 2015-16. Alberta’s unemployment rate averaged just over five per cent between 2010 and 2014. It improved after the recession but was still high by Alberta standards, averaging around seven per cent before COVID hit.
In fact, Alberta has been on a different track than the country as a whole when it comes to unemployment for the last five years. The former job creation powerhouse has been hamstrung by oil price crashes and insufficient pipeline capacity. As a result, Alberta’s unemployment rate has been above Canada’s every month since January 2016.
If Ontario is known for producing lots of auto parts, Alberta is known for producing lots of jobs. Or at least it was. This is concerning to us in Alberta, but it’s also bad for the thousands of Canadians and immigrants who would normally find work here. There is still a lot of economic opportunity in Alberta, and job creation will bounce back—to some degree. In the meantime, Albertans and Canadians alike will be watching the unemployment rate, hoping that it comes down sooner rather than later.
Permanent damage
Brendan LaCerda, economist, Moody’s Analytics Canada
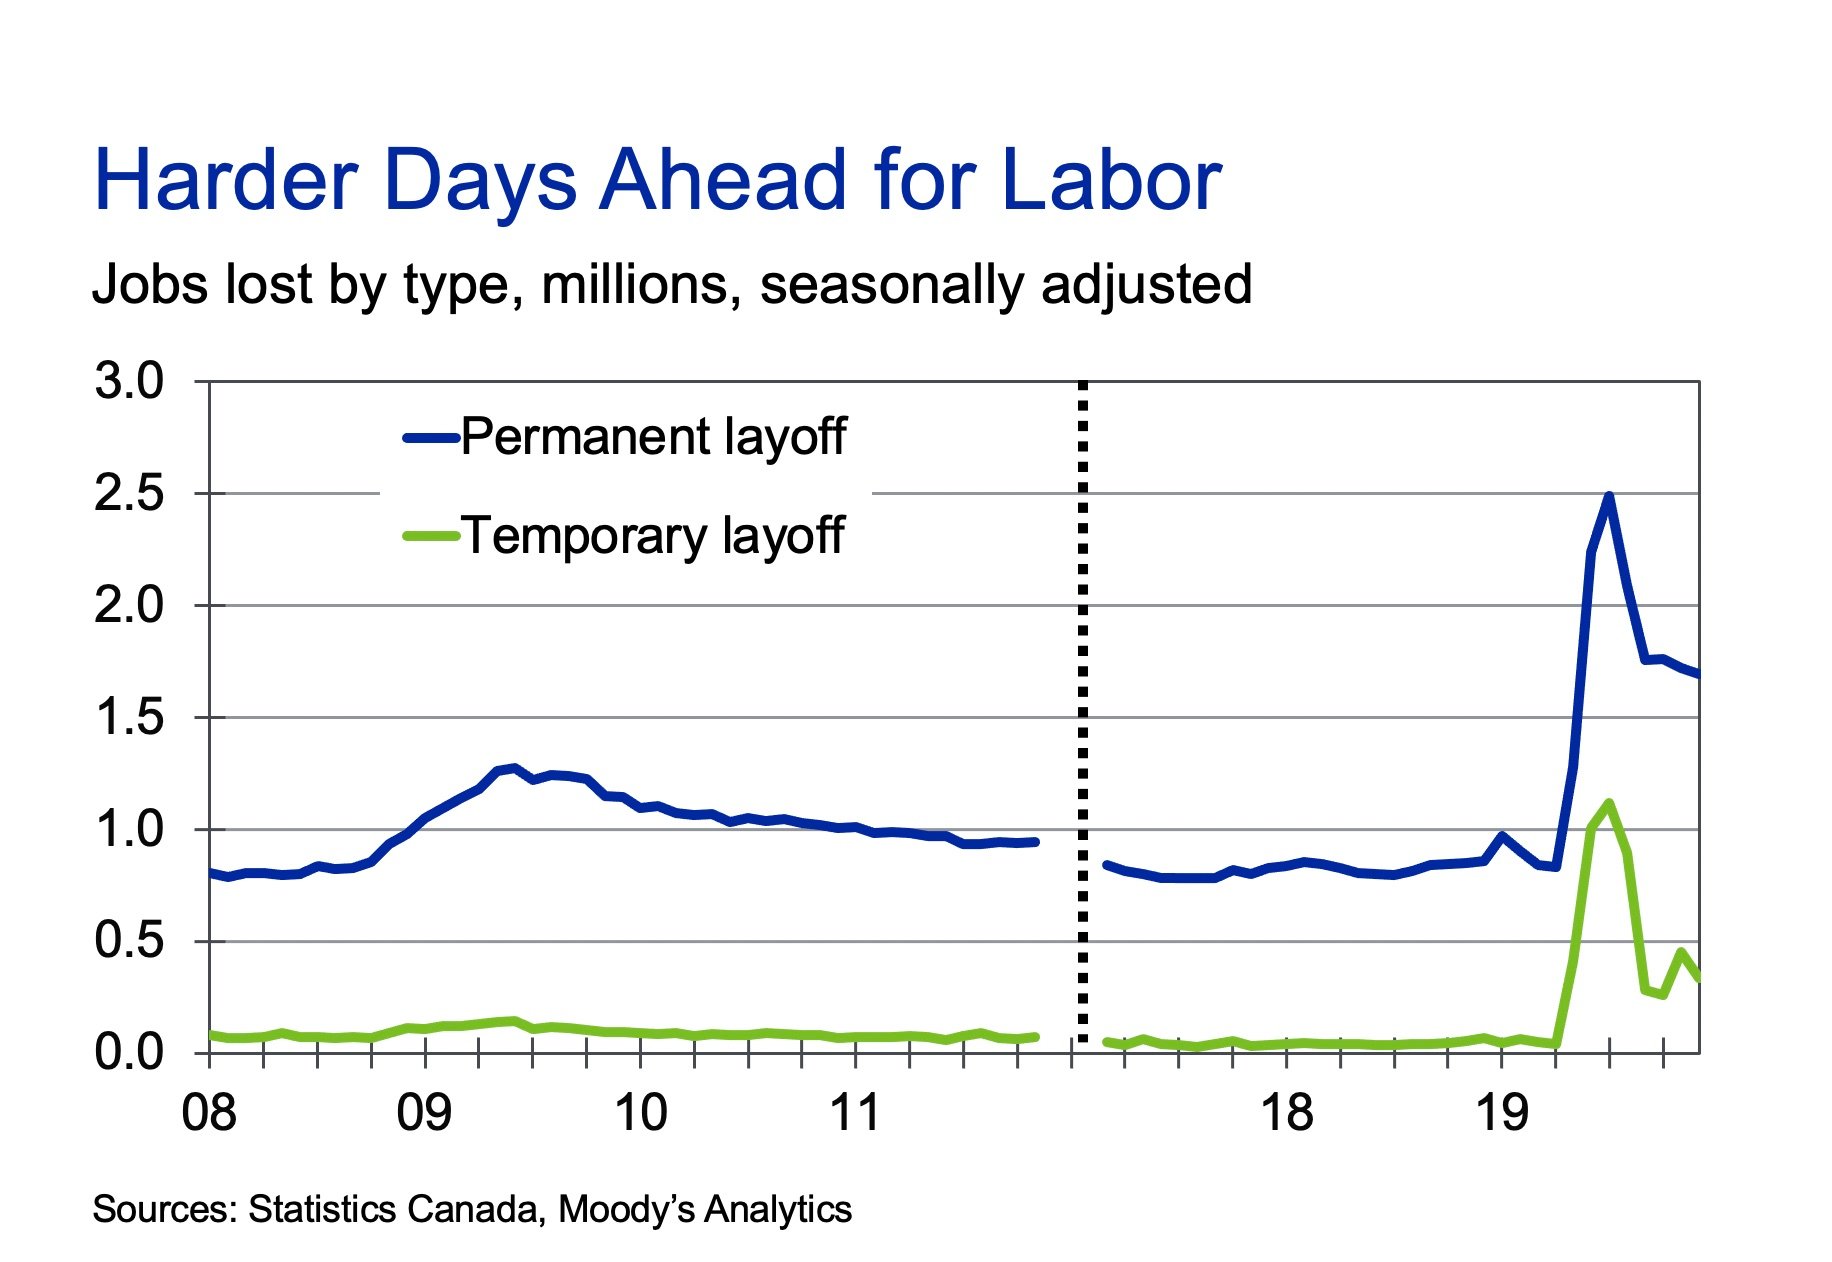
Most of the jobs recovered so far have come from the return of temporarily laid off workers. Problematically, hiring rates for the remaining pool of unemployed workers will be slower. Permanently laid-off workers will need time to search for new employment. Businesses will only post new openings at a rate that is commensurate with consumer demand. Also, to the degree that the pandemic has permanently altered the economy, job seekers may encounter skills mismatches with the positions being offered.
Recessions speed up the economy’s process of creative destruction. Many businesses that were barely hanging at the economy’s 2019 high-water mark will not survive the downturn and new firms will take their place. However, this process will take time, implying the recovery will take longer than expected.
Government finances and monetary policy
Provinces need to take action on their debt
Trevor Tombe, associate professor of economics, University of Calgary and research fellow at The School of Public Policy (@trevortombe)
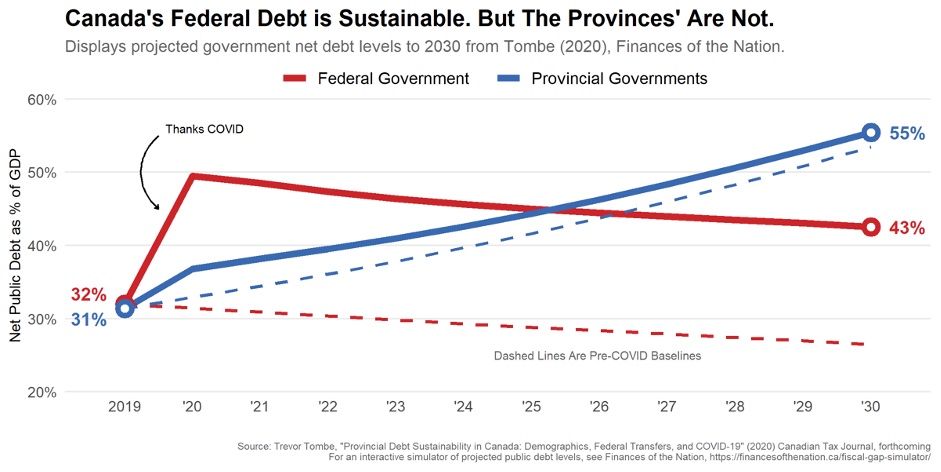
Although the dust is not yet settled following the major fiscal responses to COVID-19, it’s clear governments across Canada are under strain. The federal government’s projected deficit of over $343 billion receives most of the attention, but this misses an even larger challenge: the troubling long-term future of our provinces. My own analysis, displayed here, suggests federal debt levels are sustainable. Future federal revenues (under current policy) will mechanically grow faster than expenditures. So as emergency spending is unwound, debt-to-GDP will gradually decline following large increases this year. But provinces face mounting costs from an aging population and revenues that won’t keep up. It’s not even close. Rising provincial debt by 2030 will dwarf that from COVID-19, and will keep rising thereafter. This is not sustainable. In the coming months and years, governments will need to take concrete action ranging from reforms to health systems, federal transfers, tax rates, and more. Watch for these changes in 2021.
Canada’s ‘great convergence’
Ben Eisen and Milagros Palacios, analysts, the Fraser Institute (@benkerteisen and @MPalaciosI)
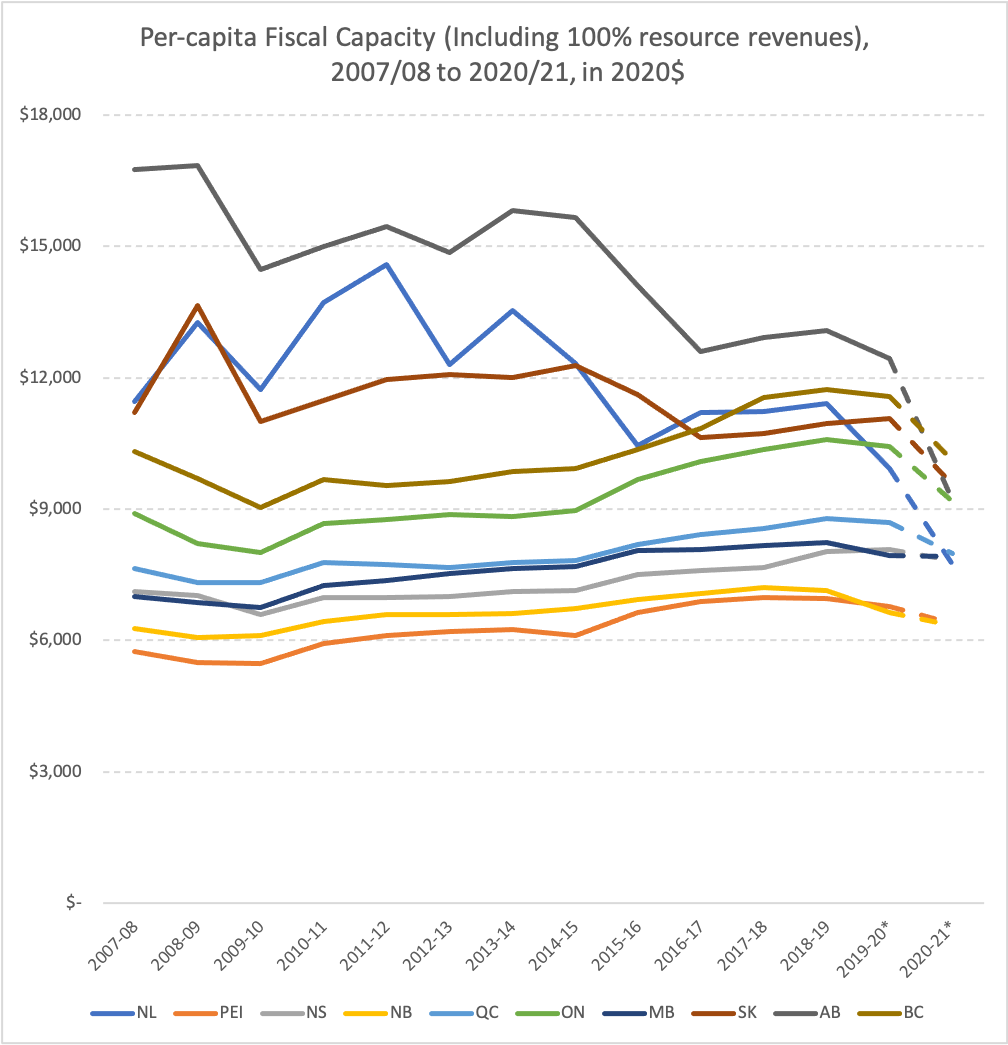 Canadians have long conceived of their country as divided between affluent “have” provinces and poorer “have-nots.” The traditional dividing line has been whether a province receives equalization. This bifurcation is outdated. Our chart shows per-capita “fiscal capacity” for each province since 2007. Fiscal capacity is a measure of a province’s ability to raise revenue. Our measure is drawn from the equalization formula and includes all resource royalties. We use the best available data to produce estimates for the final two years.
Fiscal capacity is connected to overall economic strength, and the gap between provinces has been closing. We call this trend “The Great Convergence.” In 2007/08, the gap between the richest (AB) and poorest (PEI) province was $10,999 (2020 dollars). By 2018/19 that gap shrunk to $6,138. This year, we estimate it will be $3,758. Another change: the highest province may no longer be Alberta for the first time since the modern concept of fiscal capacity was developed in 1967. Our estimate shows it will be BC this year.
The implications are profound. Many governments in higher-income provinces will have less money and require fiscal adjustments. Governments in lower-income provinces must realize if new provinces become equalization-eligible, their own payments may shrink. Indeed, a rethink of the equalization formula itself may be necessary. More importantly, if the “Great Convergence” proves long-lived we may need to change our very conception of the Canadian federation. Specifically, we may no longer be a country with a stark divide between rich and poor provinces.
We are monetizing the federal debt
Michael Smart, professor of economics, University of Toronto and Co-Director of FinancesoftheNation.ca (@michaelgsmart)
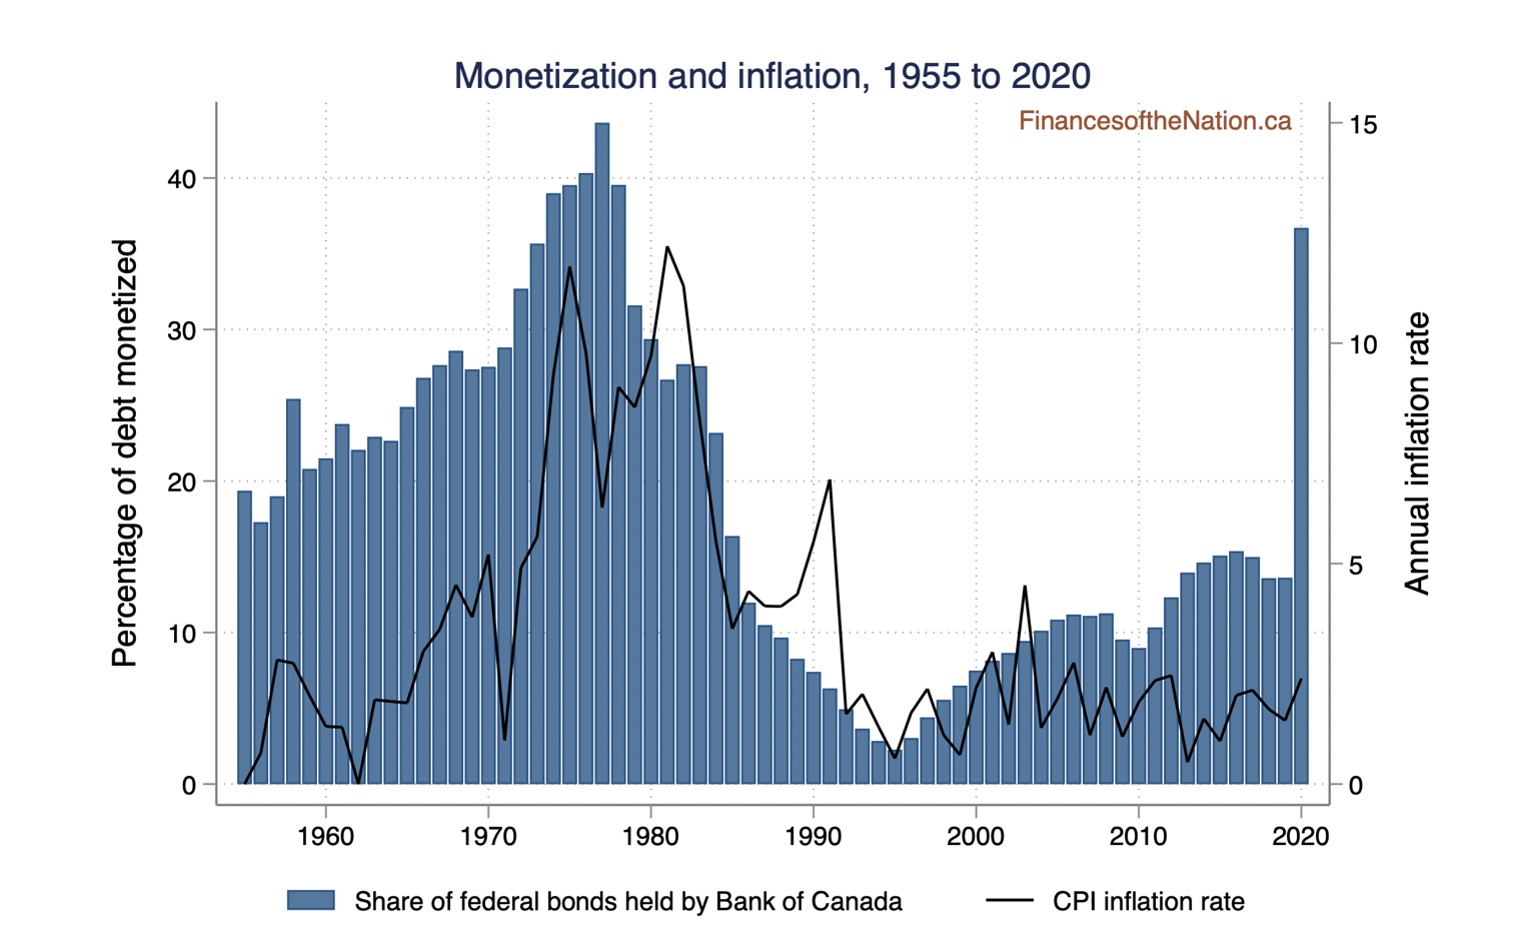
Since March 2020, the Bank of Canada has been purchasing $6 billion in federal government bonds per week, and by the end of the year it held on its balance sheet more than one-third of Ottawa’s outstanding stock of marketable bonds. And so we are “monetizing the debt.” The phrase normally comes with those scare quotes attached, because it conjures images of past governments that printed money to pay their bills, and the episodes of hyperinflation that followed. (Think Weimar Germany, or Zimbabwe under Mugabe.)
But, in fact, the Bank of Canada has regularly purchased federal bonds throughout its history, as a way of supplying currency to the economy. In the middle of the last century, as monetary growth outstripped federal deficits, the Bank’s share of the debt rose, reaching 40 per cent by 1975 – about where we are again today. As the chart shows, trend inflation rose along with monetization, only to be licked by the costly monetary tightening of the 1980s and 1990s.
At current interest rates, the Bank’s monetization policy is innocuous. It does not much matter if we finance pandemic borrowing with low-interest bonds or low-interest money. (And Ottawa’s unprecedented deficit itself makes good economic sense right now.) When long-term interest rates rise again, the Bank may have to manage inflation expectations carefully, and it may need to reduce its holdings of federal bonds. Now would be a good time for Bank Governor Tiff Macklem to explain to Canadians what the exit strategy is.
Watching firms’ selling prices for signs of inflation
Stephen Brown, senior Canada economist, Capital Economics
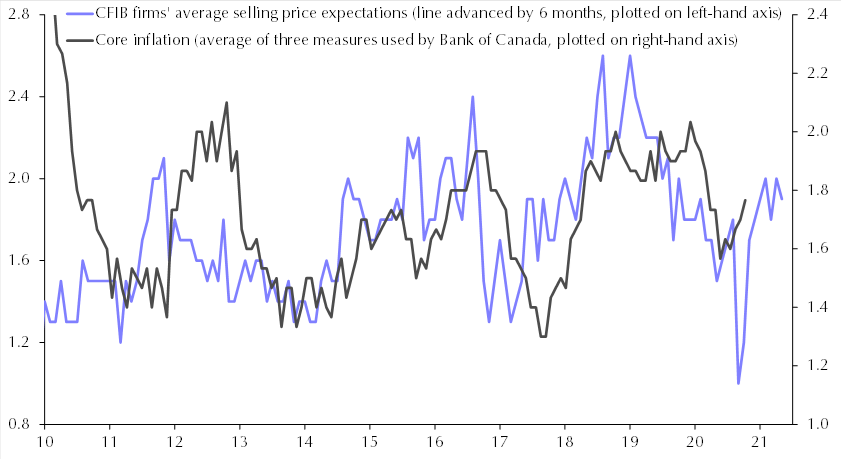
If all goes to plan, the COVID-19 vaccine roll-out will begin early next year and the restrictions that have been weighing heavily on many areas of the economy will start to be lifted. It seems all but certain that GDP will rebound strongly in 2021 as a result, particularly with the government committing to further policy support in its fall economic statement. By contrast, there is far less certainty about what this will mean for inflation. One of the unusual things about this downturn is that it has not weighed heavily on firms’ selling price expectations, which are actually now higher than they were before the pandemic despite the huge hit to demand. As my chart shows, firms’ selling price expectations currently imply core inflation will average a little less than two per cent, the Bank of Canada’s target. But if firms’ selling price expectations rise in 2021 as demand picks up, which is what we would normally expect during a recovery, then the Bank of Canada will face quite the policy dilemma; allow inflation to overshoot its target, or raise interest rates and risk derailing the recovery, and the current housing boom. We suspect it would choose the former and allow inflation to overshoot two per cent, until employment has fully recovered.
100 years of federal deficits and debt
Ted Carmichael, founding partner, Ted Carmichael Global Macro (@CarmichaelTed)
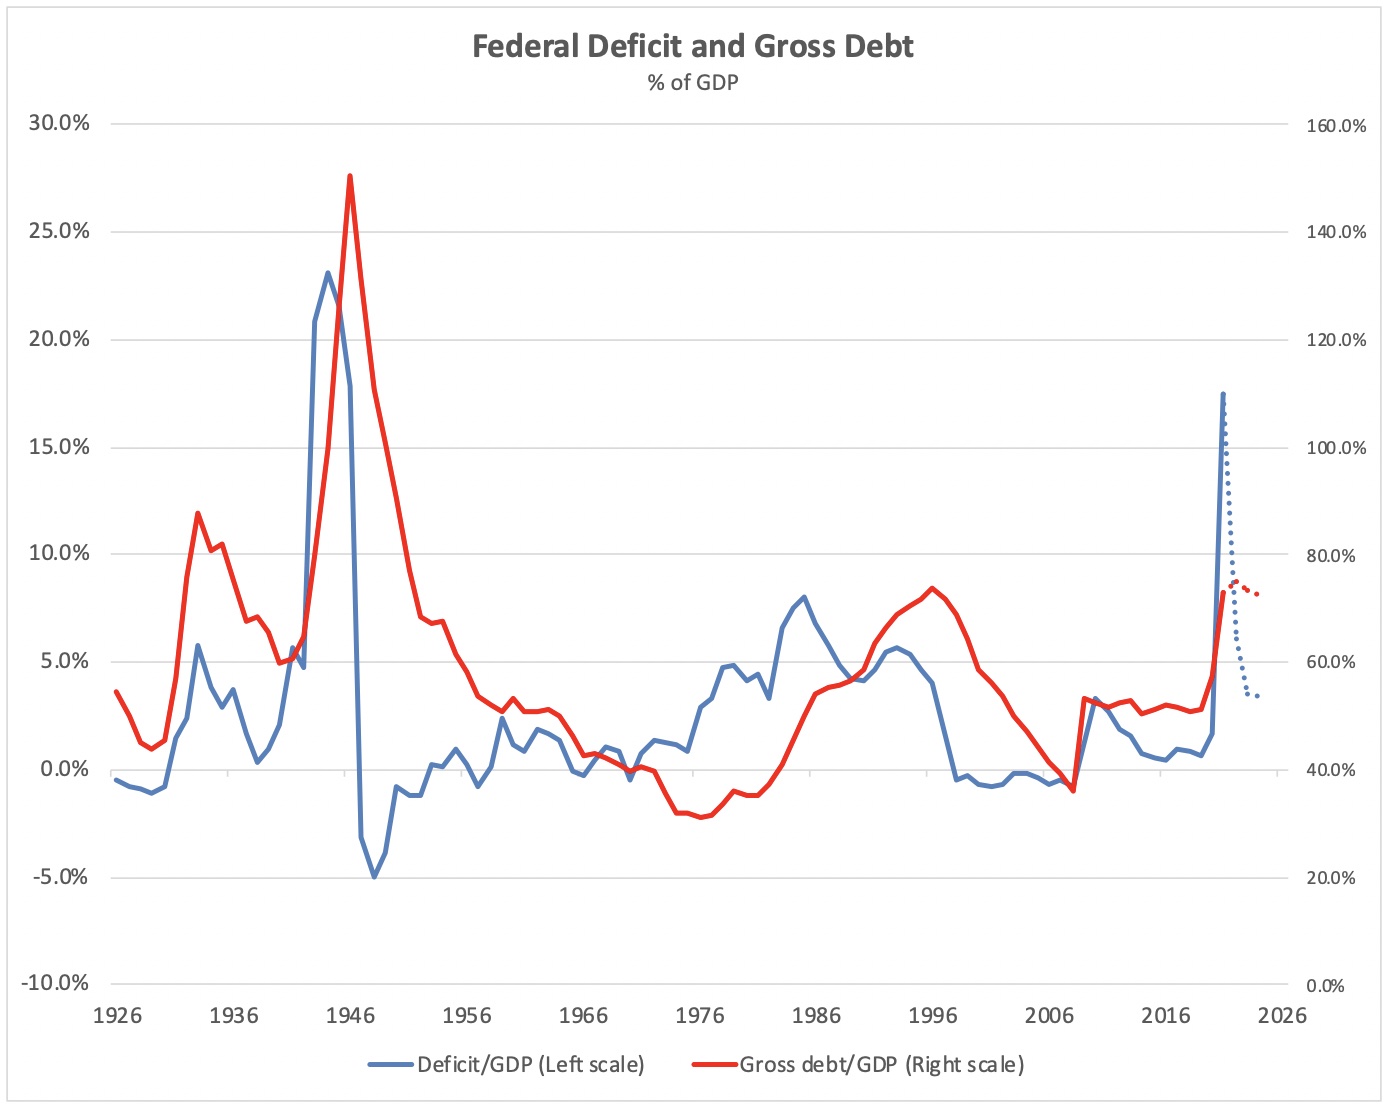
Federal budget deficits accumulate into federal government debt. There have been four spikes in federal government deficits and debt over the past century and we are living through the fourth one now. The first was during the Great Depression of the 1930s, when the deficit peaked at 5.8 per cent of GDP and the gross debt reached 92 per cent of GDP. The second was during World War II, when the deficit peaked at 23 per cent of GDP and the gross debt hit 151 per cent. The third was during the two-decade period after 1975 when the deficit peaked at eight per cent of GDP (FY84-85) and the gross debt peaked in 1996 at 76 per cent. The fourth spike, based on Chrystia Freeland’s Fiscal Update, is the current Covid19 episode when the deficit is expected to peak at 17.5 per cent of GDP and the gross debt at 79 per cent of GDP. Following each of the three previous spikes, the federal government returned to a balanced budget or a budget surplus within one to five years of the debt peak. This time, the plan is apparently to continue to run sizeable deficits indefinitely taking advantage of a 100-year low of interest rates to “build back better”. Good luck with that!
Canada’s debt load will weigh down the loonie
David Wolf, portfolio manager, Fidelity Investments
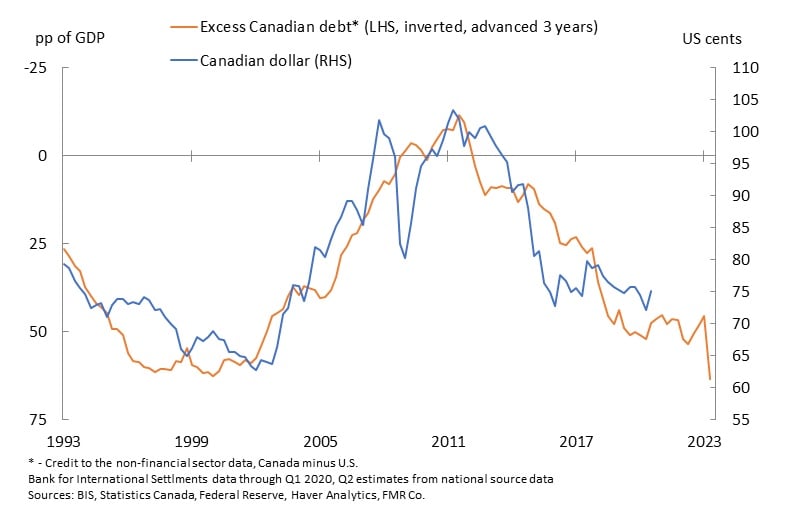
Canada has been borrowing more than the U.S. for years. Canada’s more aggressive fiscal response to the pandemic has widened the gap. That excess Canadian debt burden has a strong leading relationship with the value of the Canadian dollar. Further pressure can be expected ahead.
Canada as a lab experiment for Modern Monetary Theory
Martin Pelletier, managing director, Wellington-Altus Private Counsel, (@MPelletierCIO)
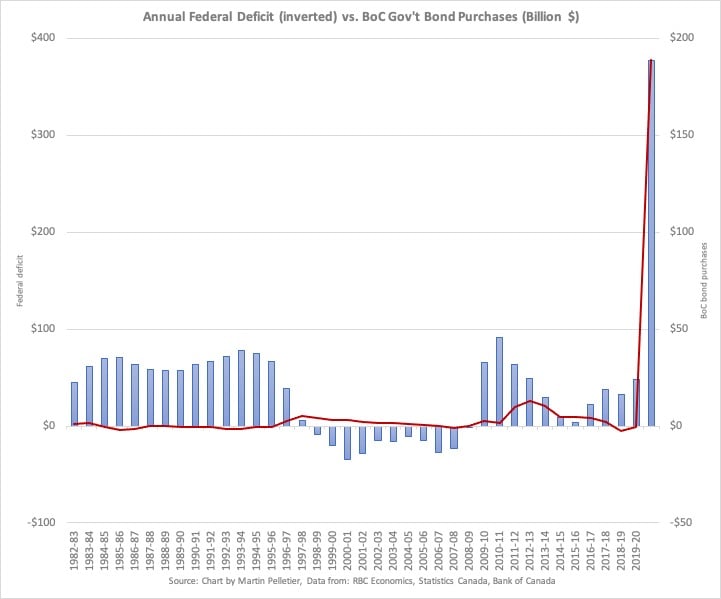
The Canadian Liberal minority government — backstopped by the NDP — is looking to implement massive, costly programs including a national daycare, pharmacare, affordable housing and green initiatives going well beyond dealing with the economic fallout from the COVID-19 lockdown.
For those wondering how these record setting fiscal spending plans will be paid for, one has to look no further than the Bank of Canada (BoC). As you can clearly see, they have been on the sidelines until just recently where they have begun printing record-setting amounts of money to purchase government debt. In total, so far this year our central bank has expanded its balance sheet at 2.5 times the pace of the Federal Reserve. It is expected that the BoC will end up controlling more than 56 per cent of our total government bond market by the end of 2021, up from 29 per cent in October 2020.
If you think about that, it sounds an awful lot like Modern Monetary Theory (MMT) is now being tested in this country. The problem looking forward is two-fold — our economy is now a net importer and we are not the world’s reserve currency. Caveat Emptor.
The Federal Reserve isn’t out of ammunition yet
George Pearkes, macro strategist, Bespoke Investment Group, (@pearkes)
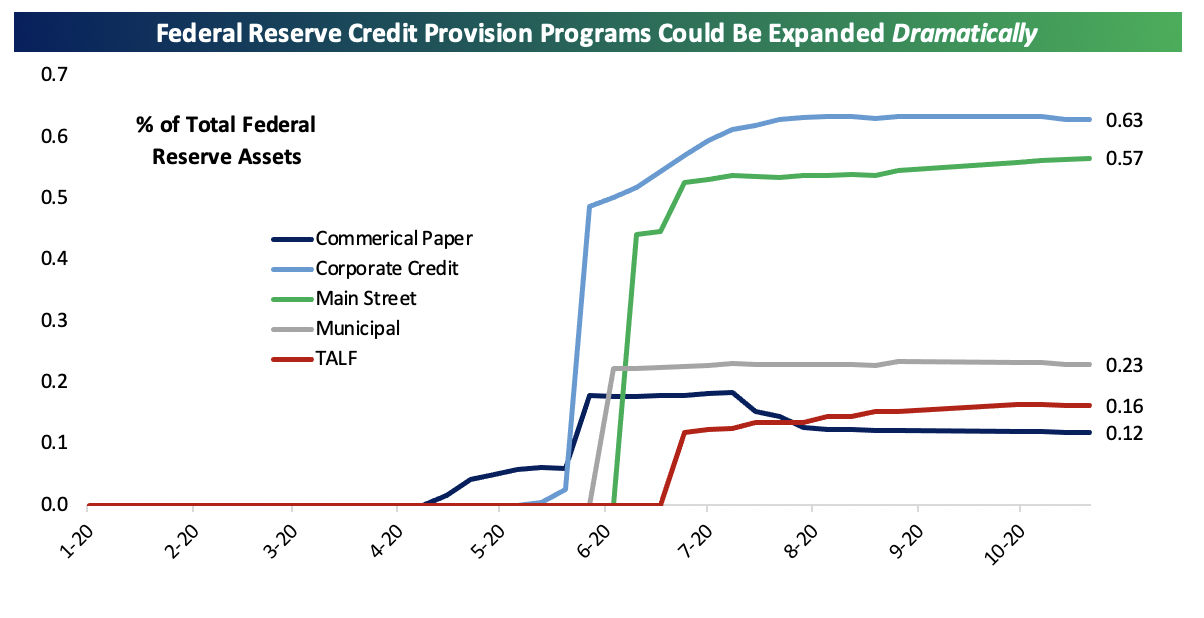
With the Republicans likely – but not assured, depending on Georgia special senate elections in January – to hold the Senate, the hopes for “Blue Wave” fiscal stimulus in the United States have taken a hit. News pointing to COVID vaccine breakthroughs suggests that more stimulus may not end up being required, but if it is and fiscal authorities don’t step up, the Federal Reserve is most definitely not “out of ammunition”. The U.S. central bank has a tiny portion of its balance sheet dedicated to credit provision programs which would meaningfully support the economy if it deteriorates again, and loosening lending terms is well within the remit of the Fed if it has to. While out-and-out fiscal stimulus would be a better policy path, there is at least some safety net of policy in reserve waiting should America’s economy slip off its post-COVID tightrope. As always, the Canadian economy remains linked to its larger neighbour’s, so the fact that Federal Reserve programs can provide a back-stop is a positive for activity above the 49th parallel in 2020.
Canada needs a post-COVID fiscal anchor
Mostafa Askari and Kevin Page, Institute of Fiscal Studies and Democracy, University of Ottawa
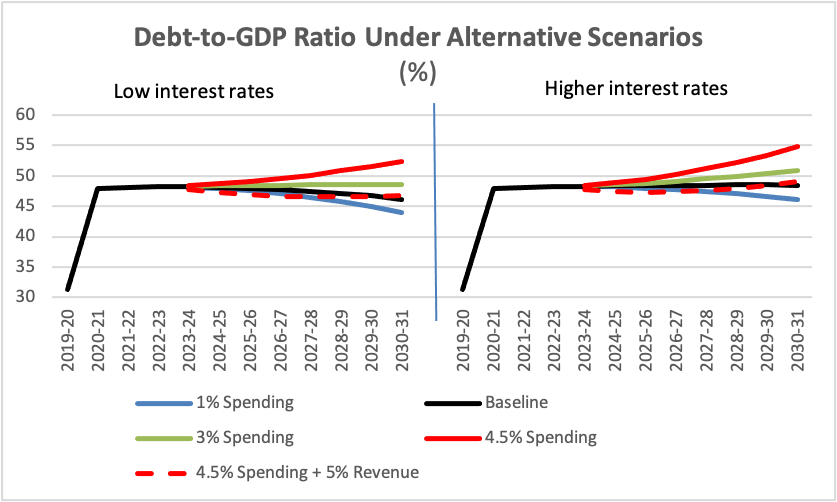
Canada needs to consider new budgetary constraints in a post COVID Economy. Depending on economic and fiscal policy strategy, a new fiscal anchor — a prudent debt target over the medium term — could be in the range of 46 to 50 per cent federal debt to GDP. This is considerably higher that pre-COVID ratios. The government should develop a fiscal (operational) rule consistent with the fiscal anchor. It could consider a spending growth target for discretionary spending. The independent Parliamentary Budget Officer could provide annual assessments of whether government is operating consistent with the fiscal anchor. Escape clauses should be made explicit. These would include the prospects for future adverse shocks like the 2020 pandemic or the 2008 global financial crisis.
The chart depicts the debt-to-GDP ratio under multiple possible scenarios over a 10-year period- changes to interest rates, policy changes to spending and revenues (austerity to stimulus). In the baseline scenario, there is moderate increase (two per cent a year) in discretionary government spending over the medium term and the debt-to-GDP ratio stays on a slowly declining path. A 50-basis-point higher effective interest rate on average over the medium-term would stabilize the debt-to-GDP ratio at its current level. In the austerity scenario (one per cent growth in spending), the debt-to-GDP ratio continues to fall even with higher interest rates. Spending growth above the baseline (i.e., three per cent and 4.5 per cent a year) would put the debt-to-GDP ratio on an upward path even with low interest rates. This, however, can be offset by a five per cent increase in tax revenues over the medium term. The chart shows a possible range for the debt-to-GDP ratio as a fiscal anchor under different policy plans.
Another big year for governments’ borrowing programs?
Dominique Lapointe, economist, Laurentian Bank Securities
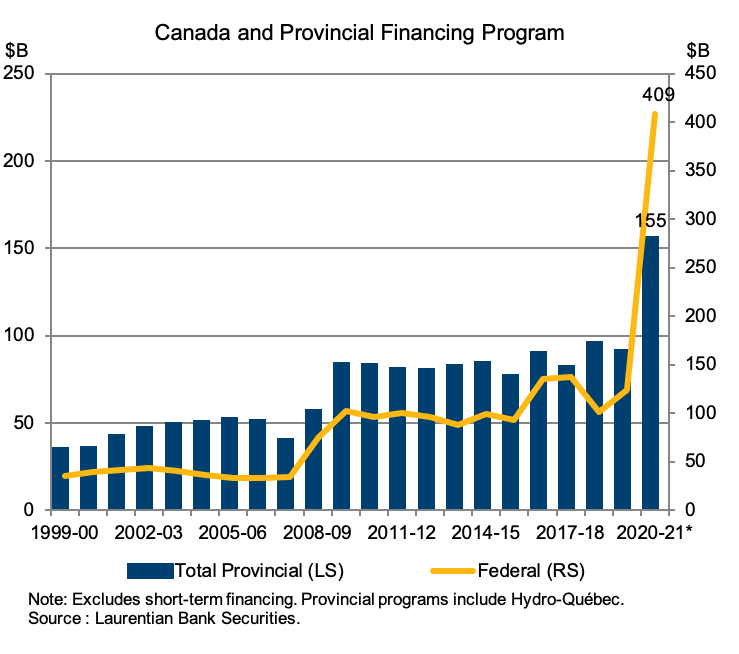
This year has brought more than its fair share of record shattering statistics. Pandemic-related costs were mostly borne by the federal government, but the loss of fiscal revenues also led to unprecedented deficits in many provinces. To cover those, in addition to capital investment and refinancing activity, provinces are expected to collectively borrow $155 billion this year, by far the largest program ever. However, this pales in comparison to the federal government’s $409 billion long-term borrowing needs. Early indications suggest next year’s deficit will remain elevated. The good news for borrowers is that the Bank of Canada (BoC) will continue to support the well-functioning of Canada’s bond market through its various bond-buying programs. Since April, the BoC bought $162 billion in Government of Canada bonds, covering 68 per cent of all bonds issued by the federal government. To a lesser extent, the BoC bought back $13 billion in provincial bonds since May, but the program could be scaled up if necessary. All in all, the pandemic definitely forced major shifts in capital markets that are unlikely to be reversed in 2021.
Households
No recovery without adequate childcare
Brett House, Rebekah Young, Marc Desormeaux, Scotiabank Economics (@BrettEHouse, @rebekah_young, @marcdesormeaux)
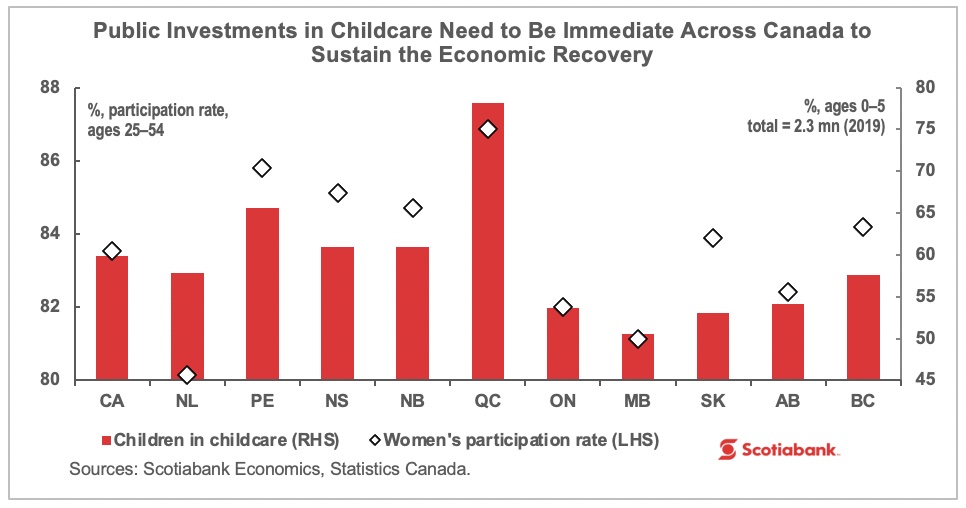
The pandemic-induced lockdown has been different from past recessions: at its onset, the COVID-19 recession hit women’s employment disproportionately hard, and as the re-opening has proceeded, women have returned to work, but at reduced hours. Even with the resumption of in-person schooling in September, 70 per cent of mothers reported that they worked less than half their usual hours compared with September 2019. Coming into 2020, the labour-market participation gap between men and women in the 25–54-year old cohort stood at almost eight percentage points. Quebec has been the only province where this gap has been narrowed substantially, owing largely to its low-cost daycare programme. Affordable, widely available childcare will be critical in sustaining Canada’s economic recovery. If women were to participate in Canada’s paid labour force on par with their male counterparts, they would add almost half a million formal workers to our economy. The IMF has estimated that this could add four per cent to Canada’s annual GDP, equivalent to around $92 billion every year. The federal government promised “a significant, long-term, sustained investment” in a Canada-wide childcare system in September’s Speech from the Throne. This is a lofty goal that could require years of planning and negotiation with the provinces. In the meantime, Canadians should watch for interim measures, such as direct transfers to households and tax credits, from the federal and provincial governments to ensure that childcare yields dividends where we need them most in the months ahead.
The savings boom will create a cushion for 2021
Doug Porter, chief economist, BMO Financial Group
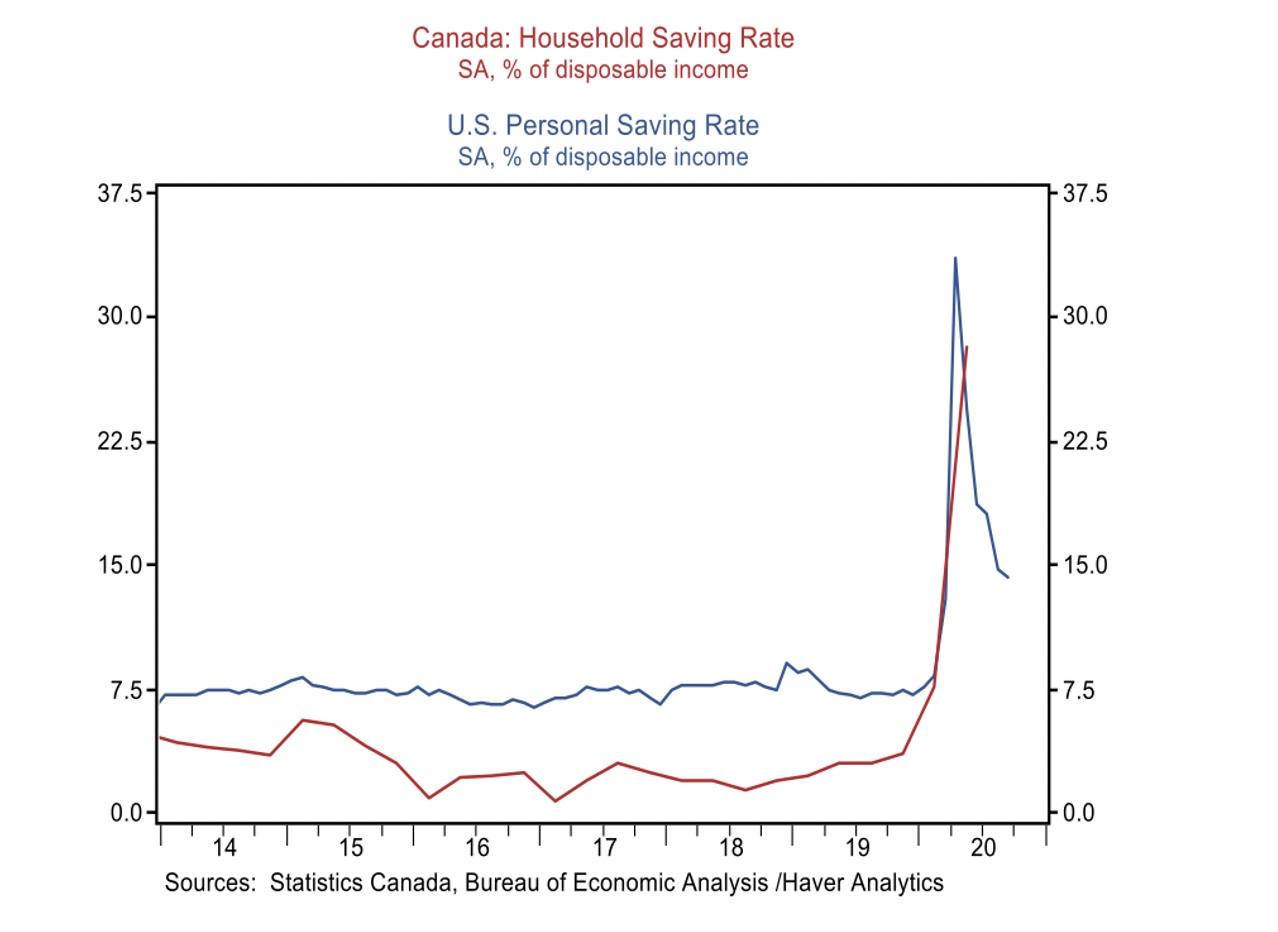
There are many unusual features to this cycle, but one of the stand-outs was the massive degree of fiscal support for household incomes. Instead of falling during the downturn, disposable incomes rose due to heavy government support. As a result of the income boost, and the fact that consumers were constrained in what they could buy, personal savings rates exploded in the spring to record highs above 30 per cent.
While those savings rates have started to come down the mountain, they are still well above pre-pandemic levels. And, there was the surge in the savings cushion built up in the spring. This is likely to continue providing an important buffer for consumer spending in 2021, regardless of what politics or events bring their way.
Government transfers not a vaccine but they help
Sal Guatieri, senior economist, BMO Capital Markets
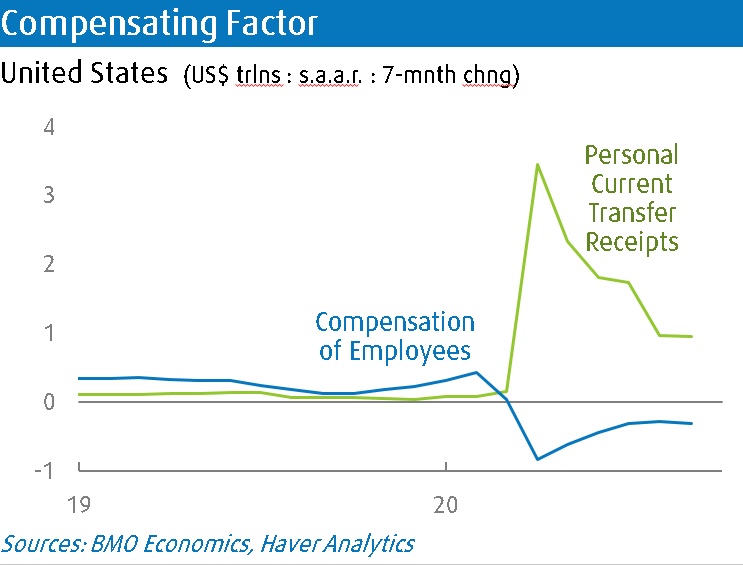
This chart shows the role U.S. fiscal policy played in easing the economy’s virus symptoms. The main reason consumer spending snapped back so quickly after the shutdowns is that government transfers to households more than offset the loss of worker compensation, by a factor of three in the U.S. (and by almost as much in Canada). That’s why one of the deepest recessions in history was also one of the shortest. Fiscal policy wasn’t a vaccine for the virus, but it was a fairly effective treatment. Of course, with the virus raging and support programs expiring, it’s now up to Congress to provide another dose of medicine.
Our punishingly complex income and social supports system
Lindsay Tedds, associate professor of public policy and Gillian Petit, PhD candidate, department of economics, University of Calgary (@LindsayTedds and @GillianPetit)
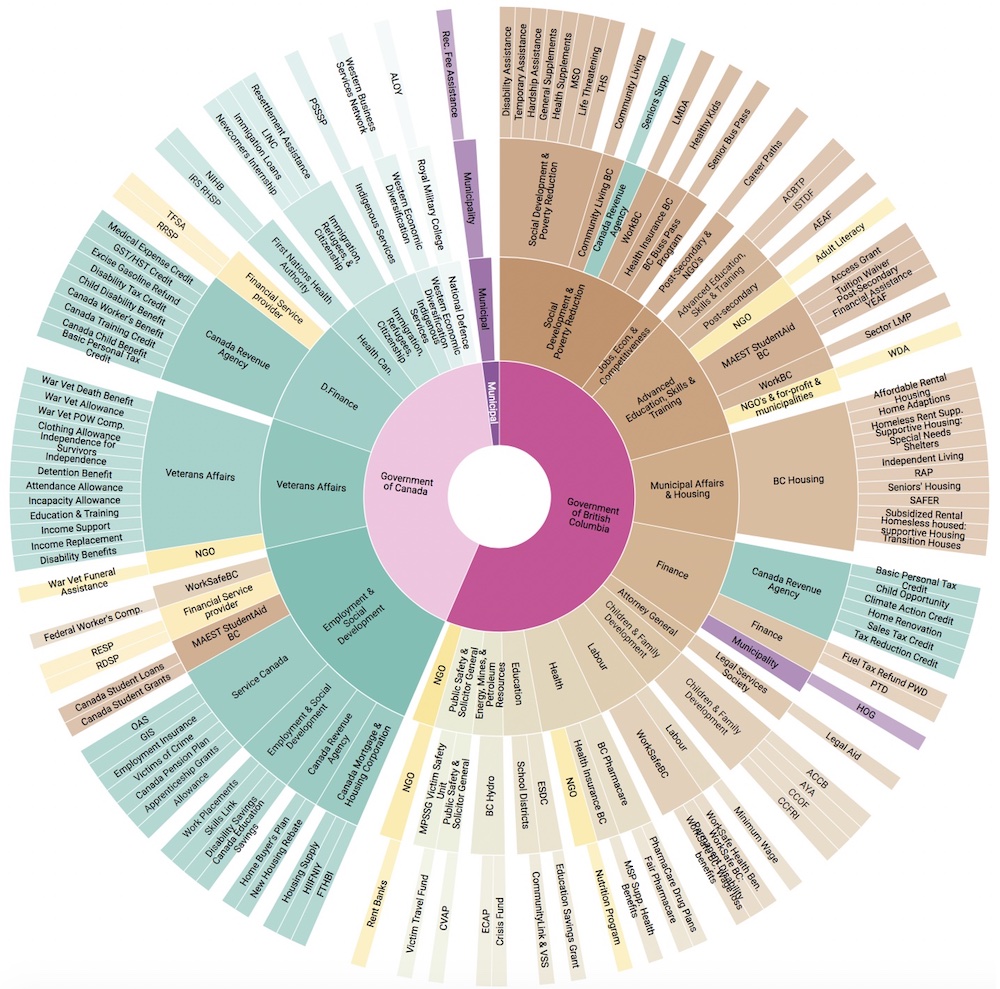
The web of income and social support programs across Canada is complex. Along with federal support programs that are available nationally, each province and territory offers its own suite of support programs. The figure above shows a high-level overview of the existing income and social support system that is offered to residents of British Columbia (we focus on one province for ease of visualization).
The inner most ring represents the level of government that offers the program, divided between the Government of British Columbia (B.C.) (shown in dark pink), the Government of Canada (shown in light pink), and municipal governments (shown in purple) in British Columbia. The second ring from the centre represents the ministry, department, or agency that is responsible for the programs: green represents a federal body and brown represents a provincial body. The third ring from the centre shows the ministry, department, agency, Crown Corporation, non-governmental organization, or private sector entity that administers the program on behalf of the responsible ministry, department, or agency: it represents the entity that the applicant interacts with to access the program. Finally, the outer most ring presents the programs. Overall, the Government of B.C. offers 120 programs offered by 12 Ministries through 23 different points of access, one of which is a federal agency (the Canada Revenue Agency (CRA)). Additionally, the federal government provides 72 programs through 8 different departments or agencies and 12 different points of access, two of which are actually Government of B.C. agencies.
This visualization (an interactive version of which can be found here) demonstrates that the system of income and social supports in just one province is large and complex. Not only are there a lot of programs, there are many different points of access and methods of access. Due to the sheer number of programs and the number of programs which requires an applicant to self-initiate, i.e. find out about the program on their own and apply, many programs are likely under-utilized by those that need them most. This points to a need to improve the system. An improved system could address both the widespread disruptions caused by a pandemic and the frequent income disruptions that many people face in normal times. The question is, can governments properly balance simplicity, ease of access, heterogeneity in need both at a point in time and across a person’s life cycle, autonomy, economic security, and public trust through such a reform?
Better off at the top than the bottom
David Macdonald, senior economist, the Canadian Centre for Policy Alternatives (@DavidMacCdn)
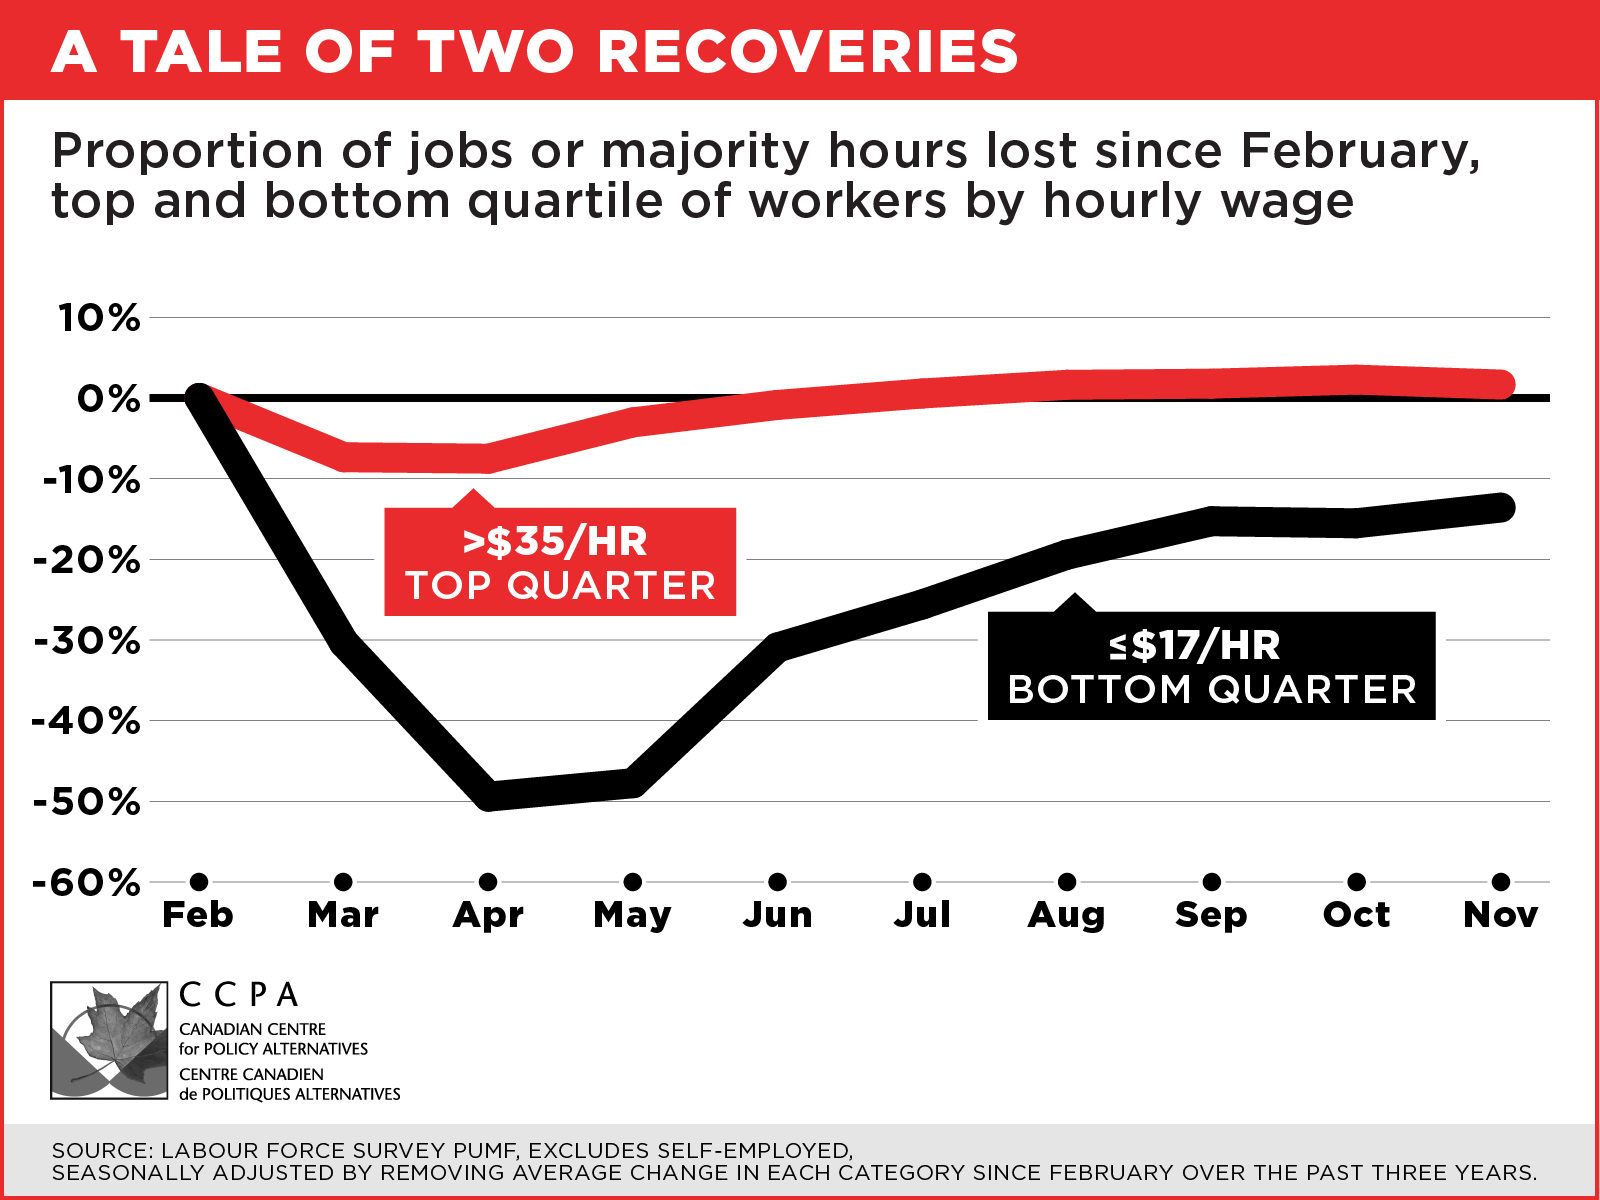
The recovery from the worst of COVID-19 job and hour losses has been very uneven. The top quarter of earners are now better off than they were in February. But the bottom half of workers (making under $17 an hour) have hit a plateau. There are still 14 per cent fewer people working at less than $17 an hour today than in February and that seems like the best it’s going to get for some time. Maybe we’re not all in this together.
Canada’s billionaire boom
Toby Sanger, economist and director of Canadians for Tax Fairness
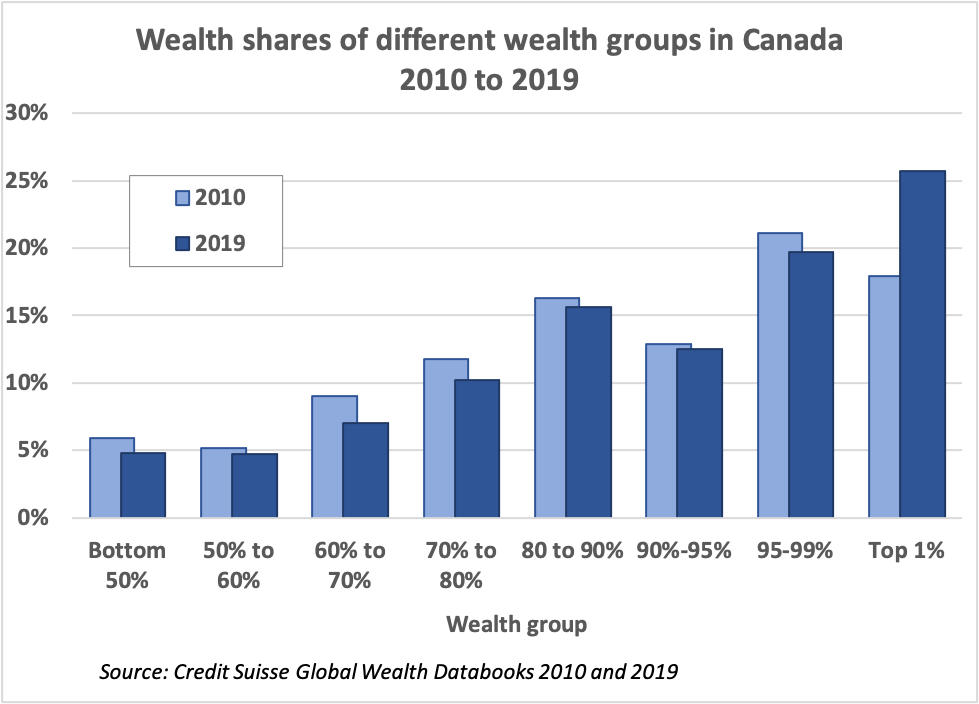
Inequalities of wealth in Canada at the very top have continued to increase over the past decade, and likely over the last year. Data published by Credit Suisse in their annual global wealth reports and databooks reveal that only Canada’s top one per cent wealthiest households (those with net worth of over $6 million) increased their share of total household wealth from 2010 to 2019—from 17.9 per. cent to 25.7 per cent—while the share of all other groups declined.
Figures for 2020 from Credit Suisse weren’t yet available at chart deadline time, but real time data from Forbes show that the wealth of Canada’s top billionaires increased by 28 per cent—more than $50 billion—during the six months of the pandemic from April to October. Much of the wealth of the top one per cent is held in business interests and corporate share: this increasing concentration of wealth at the top also reflects disturbing levels of corporate concentration. With 79 per cent of Canadians in support of a wealth tax on the super-rich, opposition parties pushing hard on this issue in a minority government, the Liberals pledging to examine ways to tax extreme wealth, and people looking for ways of paying for the crisis, the issue of taxing wealth is only going to become more prominent.
Scant evidence of worsening income inequality
Jock Finlayson and David Williams, the Business Council of British Columbia (@jockfinlayson)
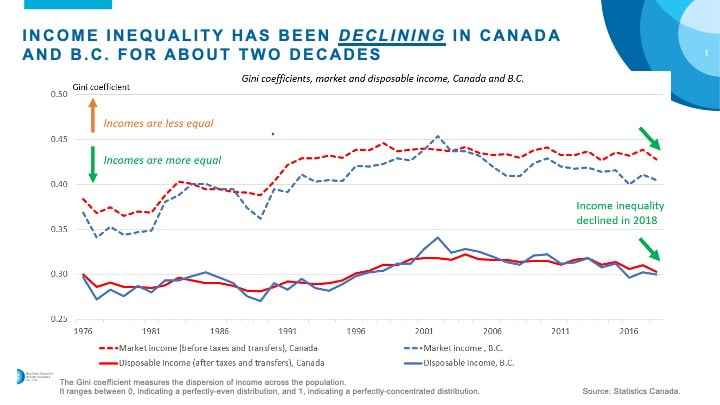
Recent years have seen a high-decibel debate over income inequality in Canada. Contrary to the claims advanced by the Trudeau government and the political left generally, there is little evidence that income inequality has increased in the 2000s.
As depicted in the chart, the Gini coefficient shows market income inequality as flat to gently declining in both Canada and B.C. since 2001, while measured on an after-tax/after-transfer basis, income inequality has clearly fallen. Other data paint a similar picture. For example, the share of income accruing to the top one per cent of Canadian households has held steady at around 10 per cent over the last half-decade or so. The ongoing pandemic may produce shifts in the patterns of income inequality. But pre-COVID-19, income inequality in Canada seemed to be broadly stable.
Police killings of civilians on the rise, sharp racial & regional disparities
Rob Gillezeau, assistant professor of economics, University of Victoria (@robgillezeau)

The United States and Canada were both swept by a wave of protests this year in response to the killings of George Floyd, Chantel Moore, and other civilians by law enforcement. While many Canadians view this as solely a concern south of the border, Canada has levels of civilians killed by law enforcement otherwise unprecedented in comparator countries. And economists are increasingly finding that beyond the direct human toll, these civilian deaths have large, persistent negative economic impacts, particularly for children.
As displayed in this graph, killings of civilians as measured by the CBC Deadly Force project are increasing in sharp contrast to the official figures published in the Canadian Vital Statistics. Those being killed are disproportionately Indigenous and Black people. Further, killings of civilians are particularly pronounced in Western Canada, accounting for over 45 per cent deaths in the last two decades. In the year ahead, we will see if Canadian jurisdictions respond seriously to this wave of protests with efforts to reduce civilians killed by law enforcement. Additionally, we will see if Statistics Canada and other institutions respond with improved data collection on this topic and race-based data more broadly.
The difficult task of unwinding government income support
James Marple, senior economist and managing director, TD Economics, (@marpelino)
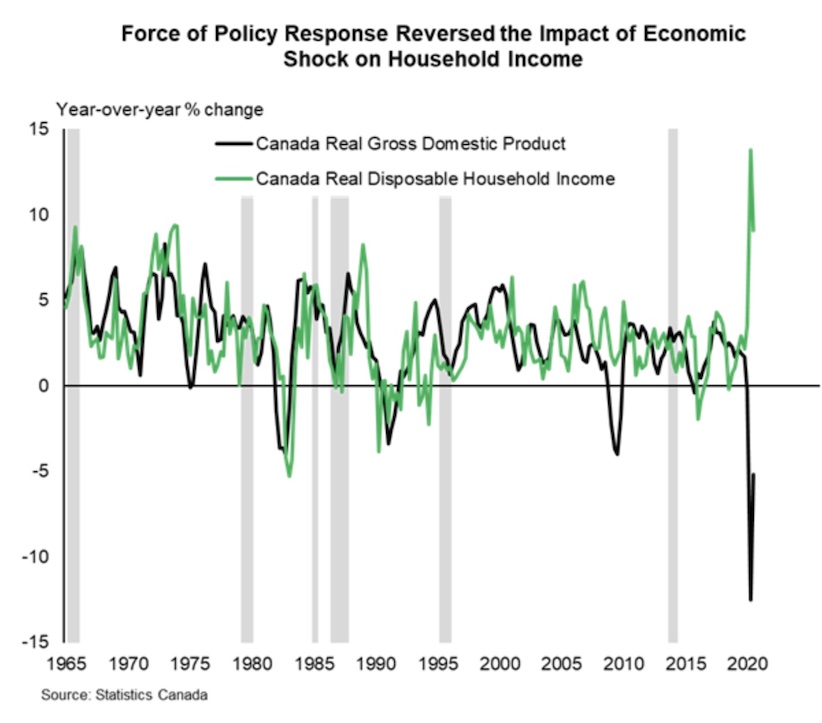 The economic downturn caused by the COVID-19 pandemic has been unlike any in recent history. The unprecedented policy response has also complicated the task of measuring the financial health of Canadian households. Perhaps most notably, the usual relationship between economic activity (gross domestic product or GDP) and household disposable income has broken down completely. Extraordinary income supports drove a record increase in household income, even while lockdowns sent GDP cratering. These supports have been extended into 2021, continuing to put a floor under households impacted by the pandemic, but they will slowly have to be eased back as the recovery progresses. Managing this transition will be a significant challenge in its own right.
Consumer fuel for the recovery
Jimmy Jean, macro strategist, Desjardins
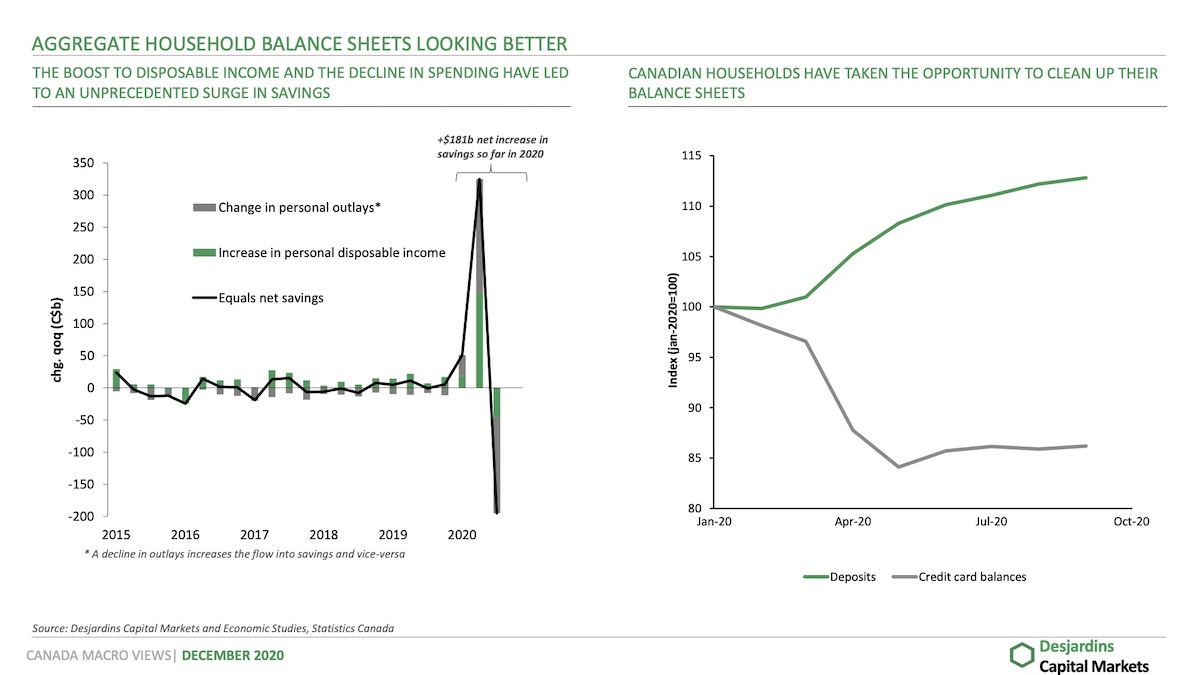
The post-vaccine outlook is constructive given the dramatic improvement in consumer balance sheets in Canada. There was a $181-billion increase in household savings in the first three quarters of 2020. This has translated into household cash balances rising 14 per. cent year-over-year as of September and into credit card debt outstanding falling 13 per cent from January to September. This represents material dry powder to fuel the post-vaccine recovery in consumption in Canada, keeping in mind that consumer spending accounts for 56 per cent of Canada’s GDP.
Canada’s number one and number two problem
Frances Woolley, professor of economics, Carleton University (@franceswoolley)
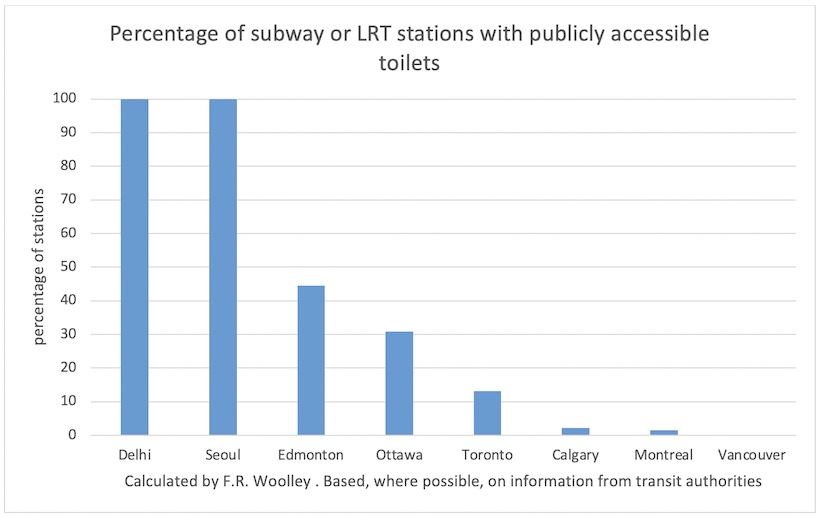
In recent months, with gyms closed and shops shuttered, Canadians have turned to walking, cycling, and other outdoor pursuits. Unfortunately, they have nowhere to go. Public toilets are few and far between. In normal times relief is available in coffee shops, libraries, hotels and other spots. But with so many establishments closed or operating on reduced hours, and many of those that are open restricting access to their facilities, Canada’s toilet shortage is becoming painfully apparent.
Unfortunately there is little data on just how desperate Canada’s sanitation situation is. Statistics Canada does not collect data on, for example, the number of people who avoid long walks for fear of being caught short. Measurements of job quality or the working environment ask respondents how easy it is to take one or two hours off for personal matters, but not how easy it is to take a bathroom break. Official Canadian data on access to sanitation is based on the availability of toilets in homes, and thus excludes the homeless, and completely ignores the issue of public access.
The chart above uses a measure of public toilet availability that can be calculated for any city that has a subway, metro or LRT system: the percentage of stations with publicly accessible toilets. Some of the numbers in the chart are debatable. For example, do the toilets on Vancouver Skytrain stations, which can be in theory be accessed by the public, but must be unlocked by the station attendant, count? What about Calgary’s Tuscany Station toilet, located in a parking lot outside the station? The chart above excludes the former and includes the latter, but these are judgement calls.
What is not debatable is that Canada’s public toilet provision is inadequate. Unlike South Korea, we are unwilling to make large investments in public health infrastructure. Unlike India, we are unwilling to finance public facilities with user fees (two rupees for a urinal; five for a lavatory). For decades we have been relying upon private enterprises — shops, malls, office buildings — to provide public facilities. But the current pandemic, combined with disruptive technological change, is profoundly altering the retail and working landscape. 2021 is time for a radical rethinking of how Canadian cities provide for their citizens’ basic needs.
COVID-19 wreaked havoc on household spending on transport
Anna Feng, economist, Conference Board of Canada
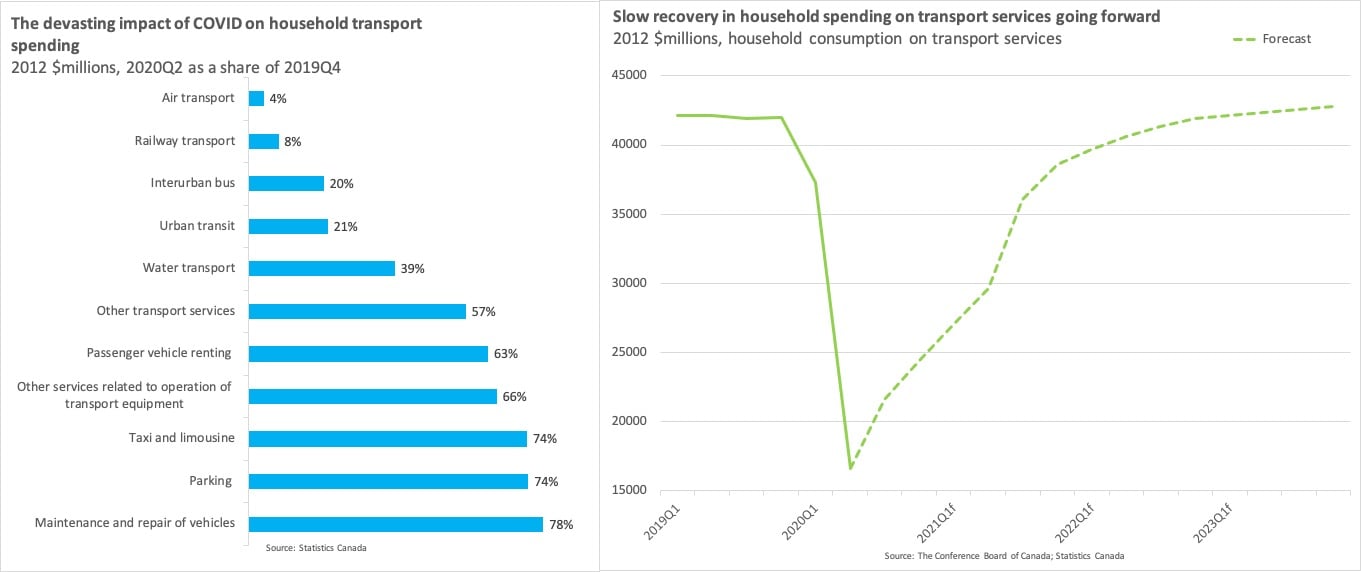
Since the onset of the pandemic, Canadians have been withholding most of their spending on transport services. This restraint came mainly as a result of strict travel restrictions and physical distancing measures. The suspension of flights and rail routes across the country took a toll on real household consumption on air and railway transport services. As such, spending on these transport services fell to less than 10 per cent of their pre-pandemic level—comparing the second quarter of 2020 to the fourth quarter of 2019. Demand for public transportation and other transport services has also weakened significantly, as more Canadians have switched to work from home amid the pandemic.
Going forward, the recovery of transport services will be closely tied to the evolution of the pandemic both domestically and globally. As the Canadian economy continues to grapple with the threat of the virus, travel restrictions will likely remain in place until a vaccine is available and distributed. This will translate to muted growth in household spending on transport services over the near term. We expect consumers will postpone their travel plans until late 2021, and spending on transport services will not fully recover until 2023.
Follow the saved money
Craig Alexander, chief economist, Deloitte
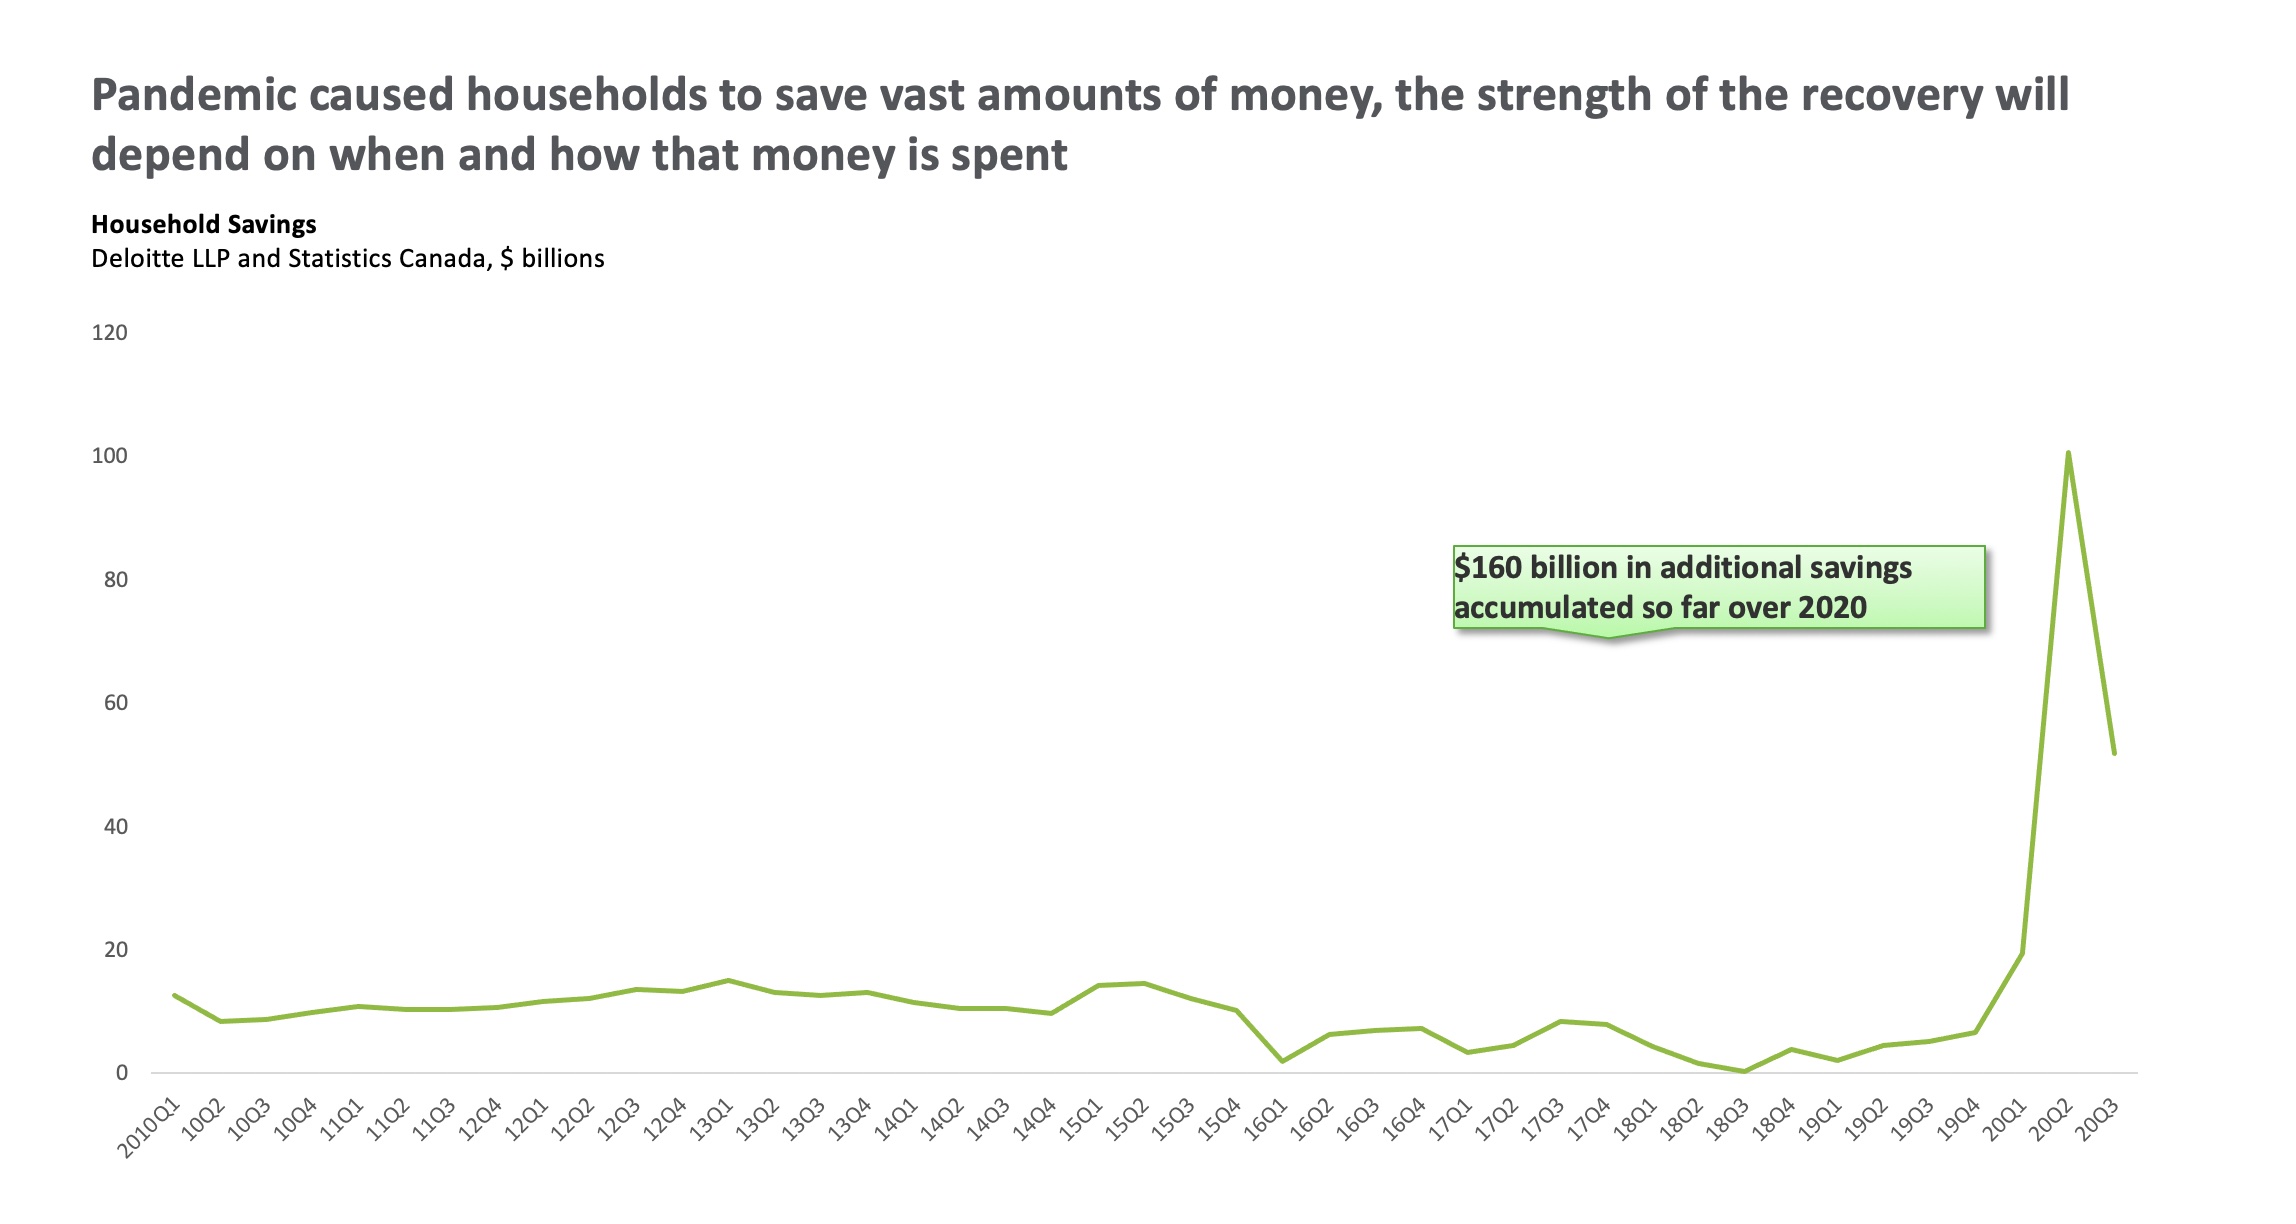
One of the most remarkable trends in 2020 has been the massive increase in household savings. Typically, Canadians save about $35 billion a year. However, the accumulation of savings in first nine months of 2020 has been a dramatic $160 billion, and it could reach $200 billion by the end of the year. I do not believe Canadians have become big savers. The vast accumulation of money reflects the fact that Canadians could not go to movies, eat at restaurants, or travel. The increase of remote work has meant less commuting that reduced spending on gasoline. In other words, the savings reflects the health risks and the government restrictions, so the savings reveals the inability to spend normally. There is evidence that households still want to have their wallets open. Indeed, retail sales recovered to their pre-COVID-19 level in June. Looking ahead, what happens to this savings is key to the outlook for the economic recovery. As the health risks diminish and a vaccine is deployed, if this savings transitions into spending, there will be a strong economic recovery. But, if the savings only trickles back into the economy, the recovery will be much slower.
Housing market
A precarious outlook for Toronto’s condo market
Ben Rabidoux, president of North Cove Advisors Inc. (@BenRabidoux)
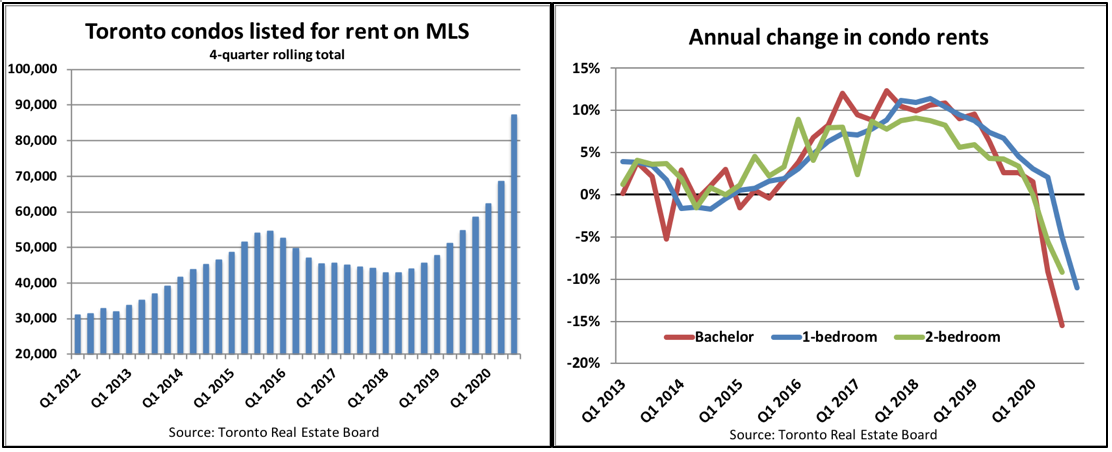
The Canadian housing market has been remarkably resilient throughout the pandemic, led by surging demand for single-family homes in secondary markets as buyers seek out lower density, suburban living. On the other hand, the rental markets in major cities like Toronto have come under increasing pressure due to a confluence of negative forces: A sharp slowdown in population growth, a 30-year high in purpose-built rental completions, and new regulations that have forced Airbnb units into the long-term rental market.
In Toronto, condo rental listings on the MLS through October have surged 58 per cent relative to 2019 and a whopping 102 per cent compared to the same period in 2018. Rental rates have fallen by as much as 15 per cent compared to last year, a stunning reversal from the rental crisis of just a few years ago.
For investors who bought condos expecting strong rental demand to continue, this has considerably weakened cash flows and is causing some to instead list their units for sale. Resale condo inventory in Toronto started 2020 at multi-decade lows but has surged by 330 per cent since January to sit at the highest level in more than a decade. Prices have followed suit; The seasonally adjusted House Price Index shows a 7.5 per cent annualized decline in condo prices over the past three months for the city of Toronto.
Things will eventually improve as immigration picks up in 2021 and the surplus of rental supply is worked off, but trends may get worse before they get better. There are still just under 12,000 whole-unit Airbnb listings in Toronto, some of which will certainly find their way into the long-term rental market as the city moves to restrict usage. In addition, 70,000 apartment units are under construction across the GTA, with 2021 set to see a potential record number of new completions. Roughly half of new condos end up in the rental market at completion, so there’s plenty of new supply that will need to be absorbed.
And as for the resale market for condos, things are looking a bit precarious. How this will play out in 2021 may be determined by the willingness and ability of condo investors to hold onto their units as cash flows continue to deteriorate.
A shifting state of balance in housing markets
Will Dunning, housing market consultant (@LooseCannonEcon)
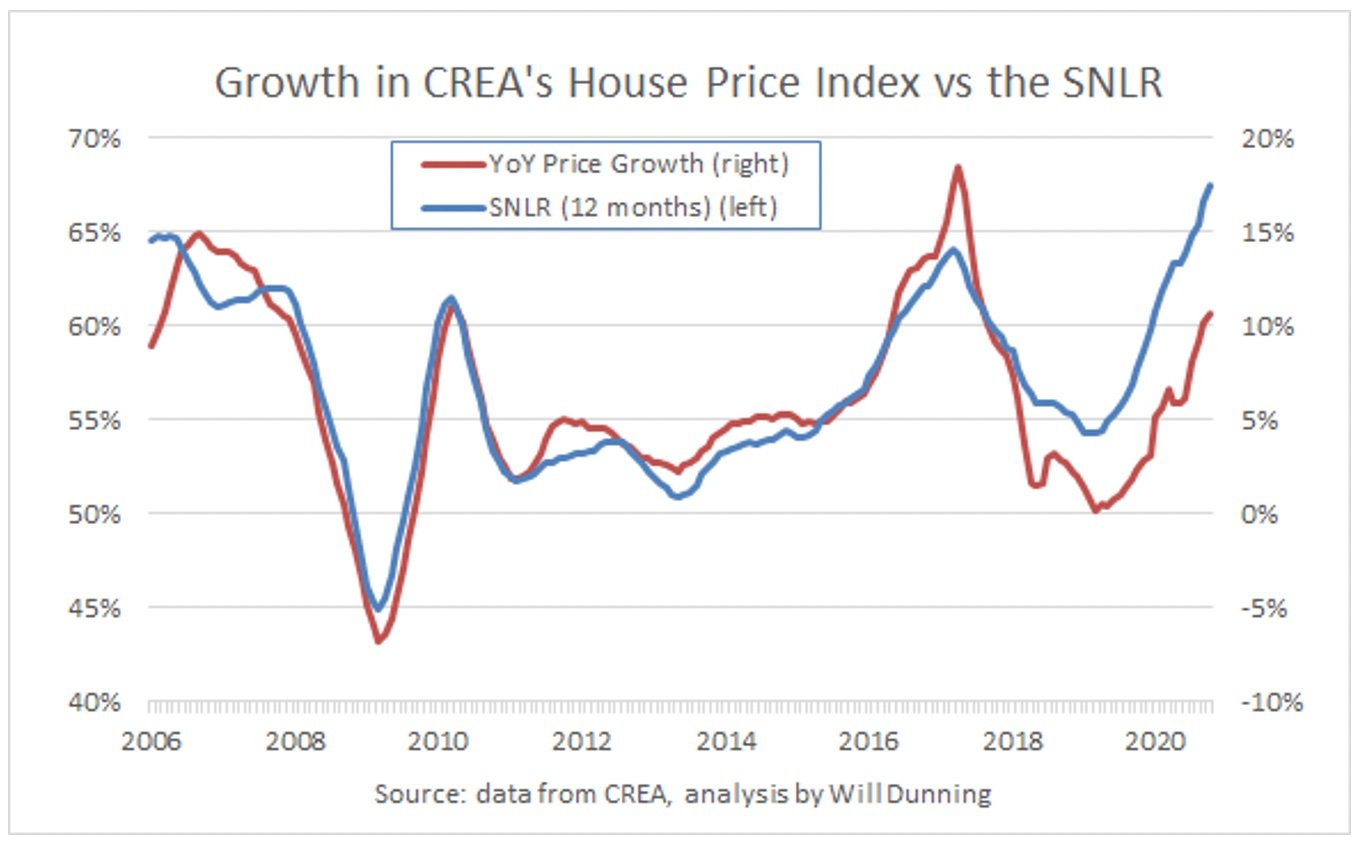
I find this chart highly satisfying. It portrays that the most basic theory of economics – that pricing is determined by the intersection between demand and supply – works in the housing market. But, the more recent data also portrays a fundamental challenge in economic analysis and forecasting. The sales-to-new-listings ratio (“SNLR” in this chart) summarizes the balance between demand and supply in resale housing markets. The theory is that growth of prices compared to a year ago should be related to the SNLR over the same 12-month period.
Now, there are several datasets we can use to calculate price growth in the housing market. Usually, we rely on the average resale price that is reported by the Canadian Real Estate Association (“CREA”). But, the average price can be distorted by changes in the locations of sales and the types of properties that are sold. It’s much better to use price indexes that eliminate those distortions. Fortunately, CREA produces such indexes, for Canada and major market areas across the country, and for several different types of homes. In this chart, year-over-year price growth is calculated from CREA’s index for Canada.
Until the end of 2017, there was a remarkably close relationship between the state-of-balance and house price growth. Since 2018, there is still a relationship, but it has shifted. For example, previously a 55 per cent SNLR resulted in price growth of four to five per cent, but in the recent data is associated with just one to two per cent growth.
I see two take-aways in this chart. Firstly, most of the time (especially including the present) there is just not enough supply in Canadian housing markets, and that has resulted in too-rapid growth of prices. During the time period covered here, the SNLR average 57.4 per cent and price growth averaged 6.1 per cent per year. Secondly, we practitioners of economics rely on an assumption that the past provides good guidance about the future. But, if important economic relationships can change spontaneously, we can’t predict how they might change in the future, and that instability makes it very difficult to create reliable forecasts.
Watch inventories for signs of trouble in the housing market
Anthony Scilipoti, CEO, Veritas Investment Research
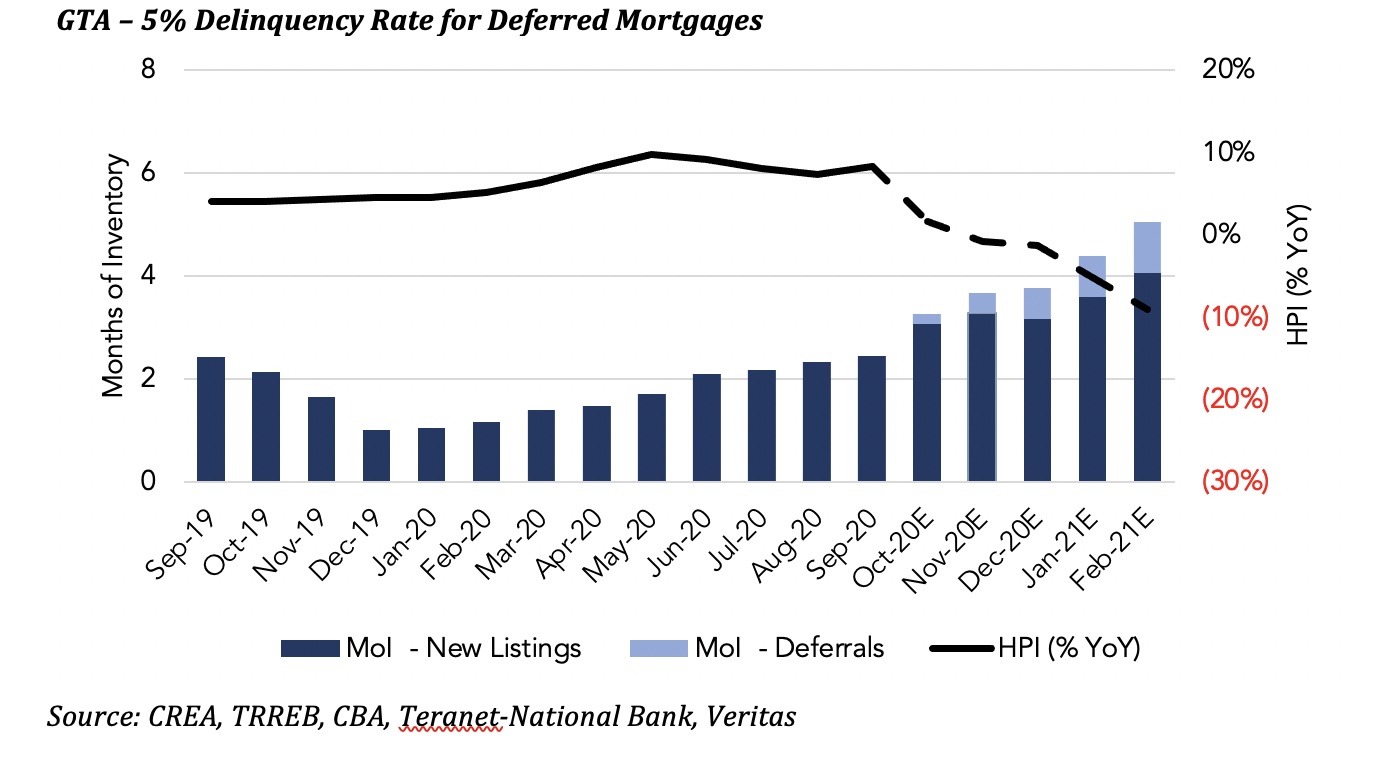
Canada’s real estate market has performed remarkably well during the COVID-19 pandemic with several major markets experiencing substantial price appreciation. Tight supply as measured by months of inventory (MoI), which represents active listings relative to trailing sales, has been a supportive factor for higher real estate prices in recent months. However, a headwind may be on the horizon as mortgage deferrals expire, if properties are listed for sale due to financial hardship.
Using Canada’s largest housing market as an example, the Greater Toronto Area, our analysis finds that if five per cent to 15 per cent of properties tied to mortgage deferrals are listed for sale over the coming months, MoI would rise to between five and seven months, which in turn would lead to a decline in the Home Price Index of between 15 per cent and 26 per cent. (Note that the graph displays the five per cent scenario.)
Of course, our forecast does not consider several other factors including demographics, investor demand, unemployment, mortgage rates or construction and development. These factors could either dampen or magnify any potential price change. We recommend closely monitoring MoI over the coming months as any significant increase in inventory could lead to a potential price correction in real estate markets.
To end the supply-demand imbalance in the housing market, it’s time to get building
Shaun Cathcart, senior economist, Canadian Real Estate Association
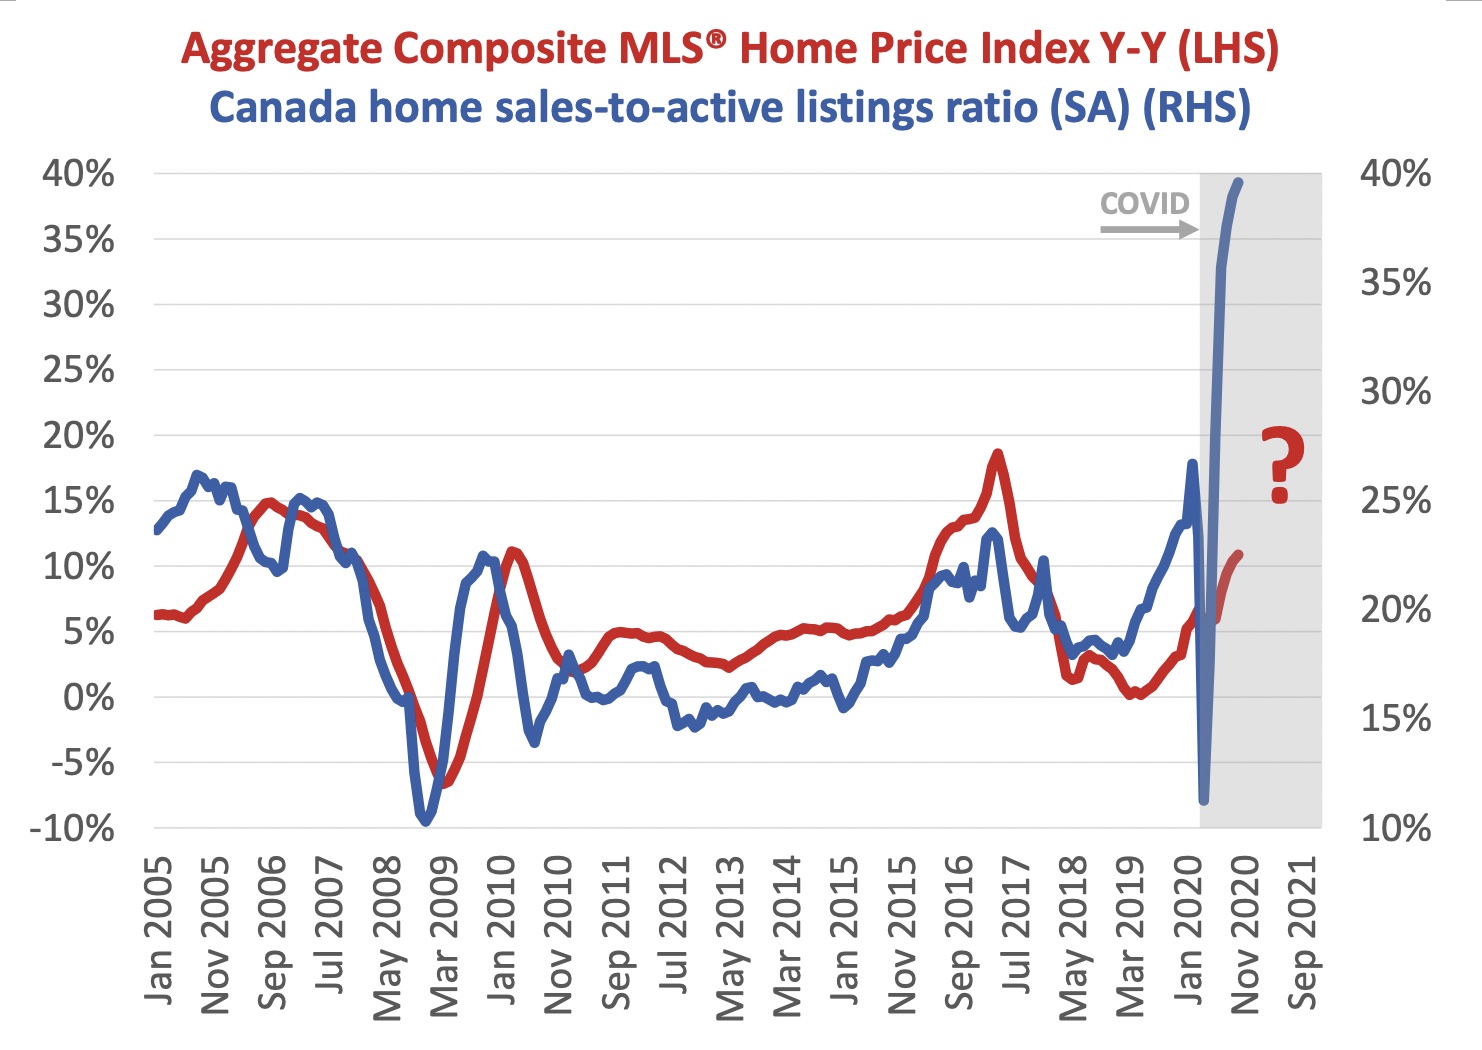
Many metrics have been “off the charts” this year. Of course, they’re still on the charts. Otherwise what are we doing here? But for many of us our scaling has been permanently altered. The chart I’ve chosen to highlight this year shows the extent of the demand-supply imbalance in the existing home market, which you will note was well on its way to where we are today before COVID-19.
We started 2020 with seller’s markets in many parts of the country. Conventional wisdom was on the side of predictions that supply would rise and demand would fall as a result of COVID-19 and the associated economic and demographic fallout—but at least we were in a good position to absorb that. Turns out, in an unprecedented year where having a place to call home is everything, even more people wanted them, and fewer owners want to sell theirs. On top of that, the shake-up to our lives has caused a lot of people to move around who otherwise wouldn’t have. So now we’re looking at the tightest housing market conditions ever.
The sales-to-active listings ratio (in blue) tracks quite closely but leads year-over-year home price growth (in red), as you would expect. Check out that blue line! It’s become an annual tradition at the holiday parties on my street for my neighbours to ask me what I think our home values will do in the coming year. The joke/answer over the last few years where we are in Ottawa has been, “your house will make more than you will this year.” What will I say for 2021? Well, unfortunately there are no holiday parties on the street this year. But what does this chart suggest? Maybe this whole thing will just turn into a pumpkin on New Year’s Eve, but I have my doubts. A vibrant housing market with lots of demand and lots of housing options, where homes maintain their values and maybe rise over time but remain affordable, is ideal.
We obviously have the demand, but what’s that other thing? Oh yeah, supply. We might want to consider addressing the issue of supply. The current COVID-related pause in some longer-term demand pressures together with an urgent need to get the country back to work seems like an opportunity.
Businesses, growth and competitiveness
Active businesses down for the count
Ted Mallett, chief economist, Canadian Federation of Independent Business,
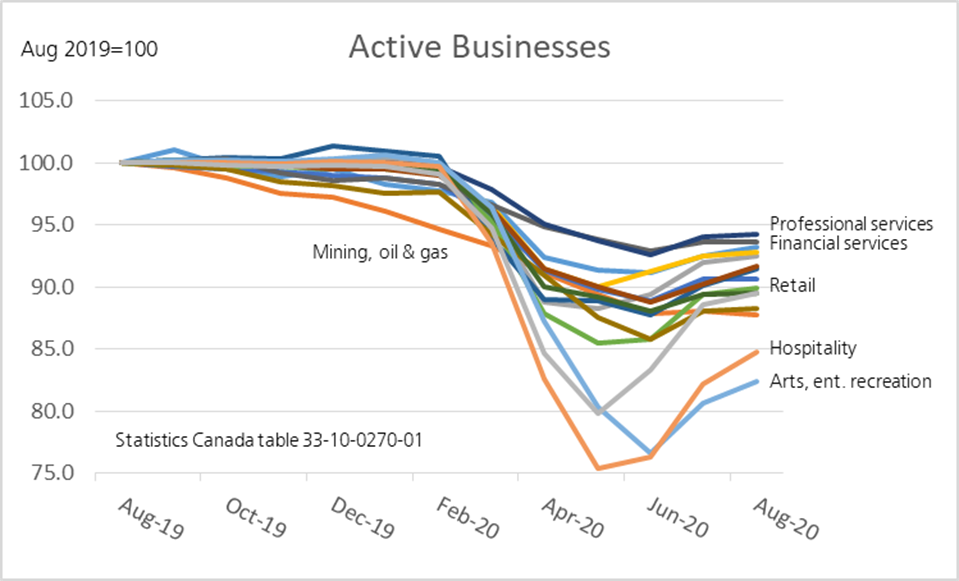
COVID has had a big impact on business dynamics in 2020. There is normally a stable pattern of business entries and exits in every sector, but customer behaviour and government public health measures have dramatically amplified the shifts this year. Statistics Canada’s new monthly series on entries, exits and continuing businesses show the disruptions very clearly. Active businesses are those reporting payrolls in the month. Canada lost about 100,000 active businesses from February to May, but gained back only 30,000 by August for a net loss of about 9 per cent of businesses. The hospitality and arts, recreation sectors were the hardest hit—both with >15 per cent fewer businesses compared to the year before. The least affected sectors include professional services and financial services businesses with about a 6 per cent reduction in numbers. Some of these inactive businesses may reactivate at a later date, but the shallow and slowing recovery trend to date suggests that most losses are permanent. The question in 2021 and forward will be if surviving businesses will retain their relative gains or if a new breed of start-ups will succeed in rebalancing the marketplace.
The low-hanging fruit of the recovery has been plucked
Eric Lascelles, chief economist, RBC Global Asset Management (@RBCGAMChiefEcon)
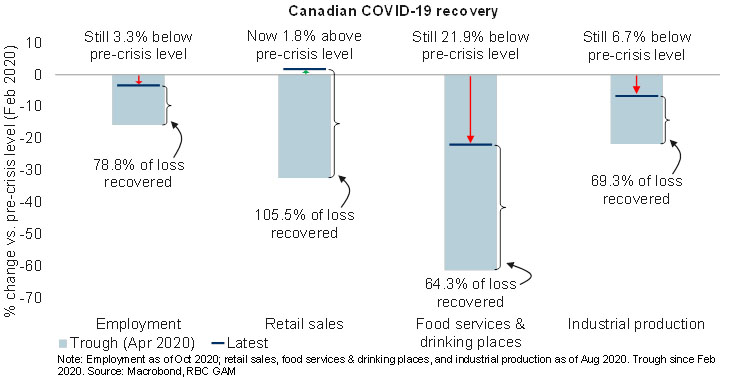
COVID-19 is the undisputed macro issue of the year, if not the decade. This chart gives a pretty complete picture of how it has played out in Canada from an economic standpoint. The initial peak-to-trough decline was colossal, ranging from 15 per cent to 60 per. cent depending on the sector. Moves of this magnitude are completely unprecedented. It is no less striking how powerfully the subsequent recovery has played out. As the dark blue lines depict, Canadian employment has now recovered nearly 80 per cent of its initial decline, industrial production has recovered nearly 70 per cent of what it initially loss, and retail sales is incredibly already operating at above pre-pandemic levels (with a significant helping hand from fiscal stimulus). Progress from here is likely to be considerably slower for all sectors, in part because the low-hanging fruit has already been plucked and in part because the second viral wave will probably stall growth for a few months. Lastly, the chart conveys just how varied the pandemic experience has been, with a sector like food services & drinking places suffering an outsized drop and still roughly 20 per cent below normal.
Manufacturing investment to lag without government action
Alan Arcand, chief economist, Canadian Manufacturers and Exporters (@AlanArcand)
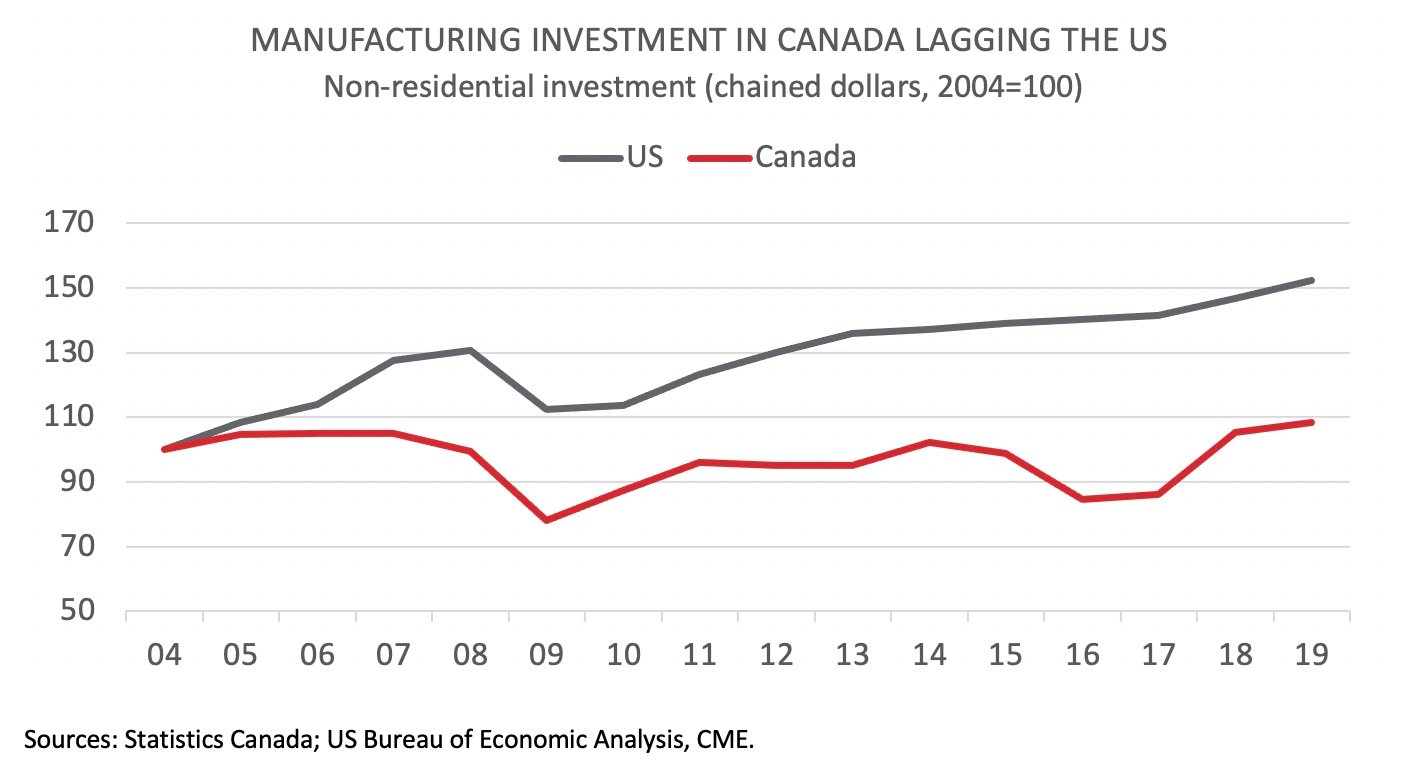
Since 2004, manufacturing investment in Canada and the United States have been on different trajectories. While manufacturing investment in the US has climbed by more than 50 per cent since that time, it has only edged up by 8.5 per cent in Canada. This is a clear sign that investors have lost confidence in Canada as a competitive place for manufacturing. Our members tell us that factors such as higher taxes, more burdensome regulations, higher energy costs, and labour and skills shortages have created an unfavourable investment climate.
Unless the government sends a strong message to investors by making tax and regulatory reform a key pillar of its post-COVID economic recovery plan, manufacturing investment in Canada will return to its weak long-term trend. The reason why this is important is twofold. First, manufacturing is still a major economic driver, accounting for 10 per cent of GDP and nearly two-thirds of the country’s merchandise exports. Second, COVID-19 has shown us that we need to produce essential goods in Canada, with PPE shortages near the beginning of the pandemic and questions about Canada’s domestic vaccine-making capacity today highlighting the need to rethink the strategic role of manufacturing and supply chains.
A Biden brain drain could be a drag for Canada
David Doyle, head of North America strategy and economics research, Macquarie Group
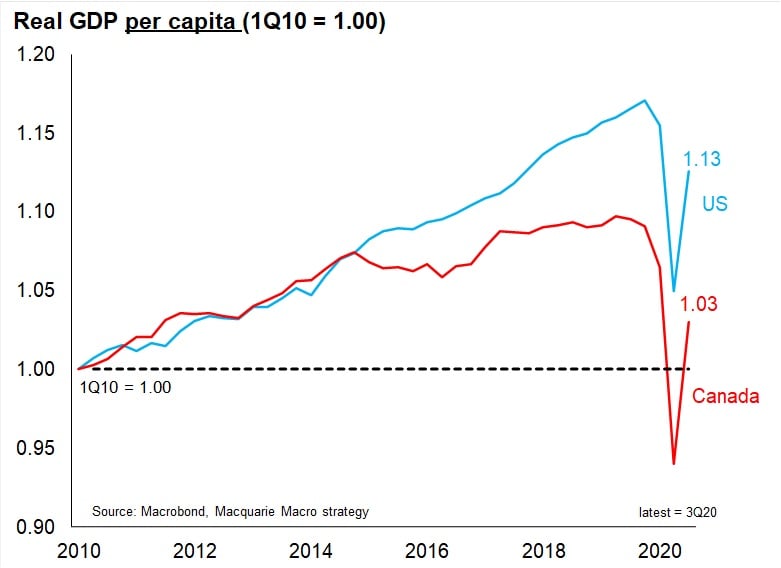
Real GDP per capita in Canada has been underperforming the US, averaging one percentage point less per year over the past decade. Put simply, it suggests the standard of living in Canada has been falling relative to the U.S. for several years. Under a Biden Presidency with immigration and work permit restrictions likely to be relaxed this could help trigger a brain drain, one that may add to pressures on headline real GDP growth and economic potential in coming years. This poses a significant risk for Canada in 2021 and beyond.
Canada’s export lockdown
Meena Aier and Stephen Tapp, Export Development Canada (@Meenaier and @Stephen_Tapp)
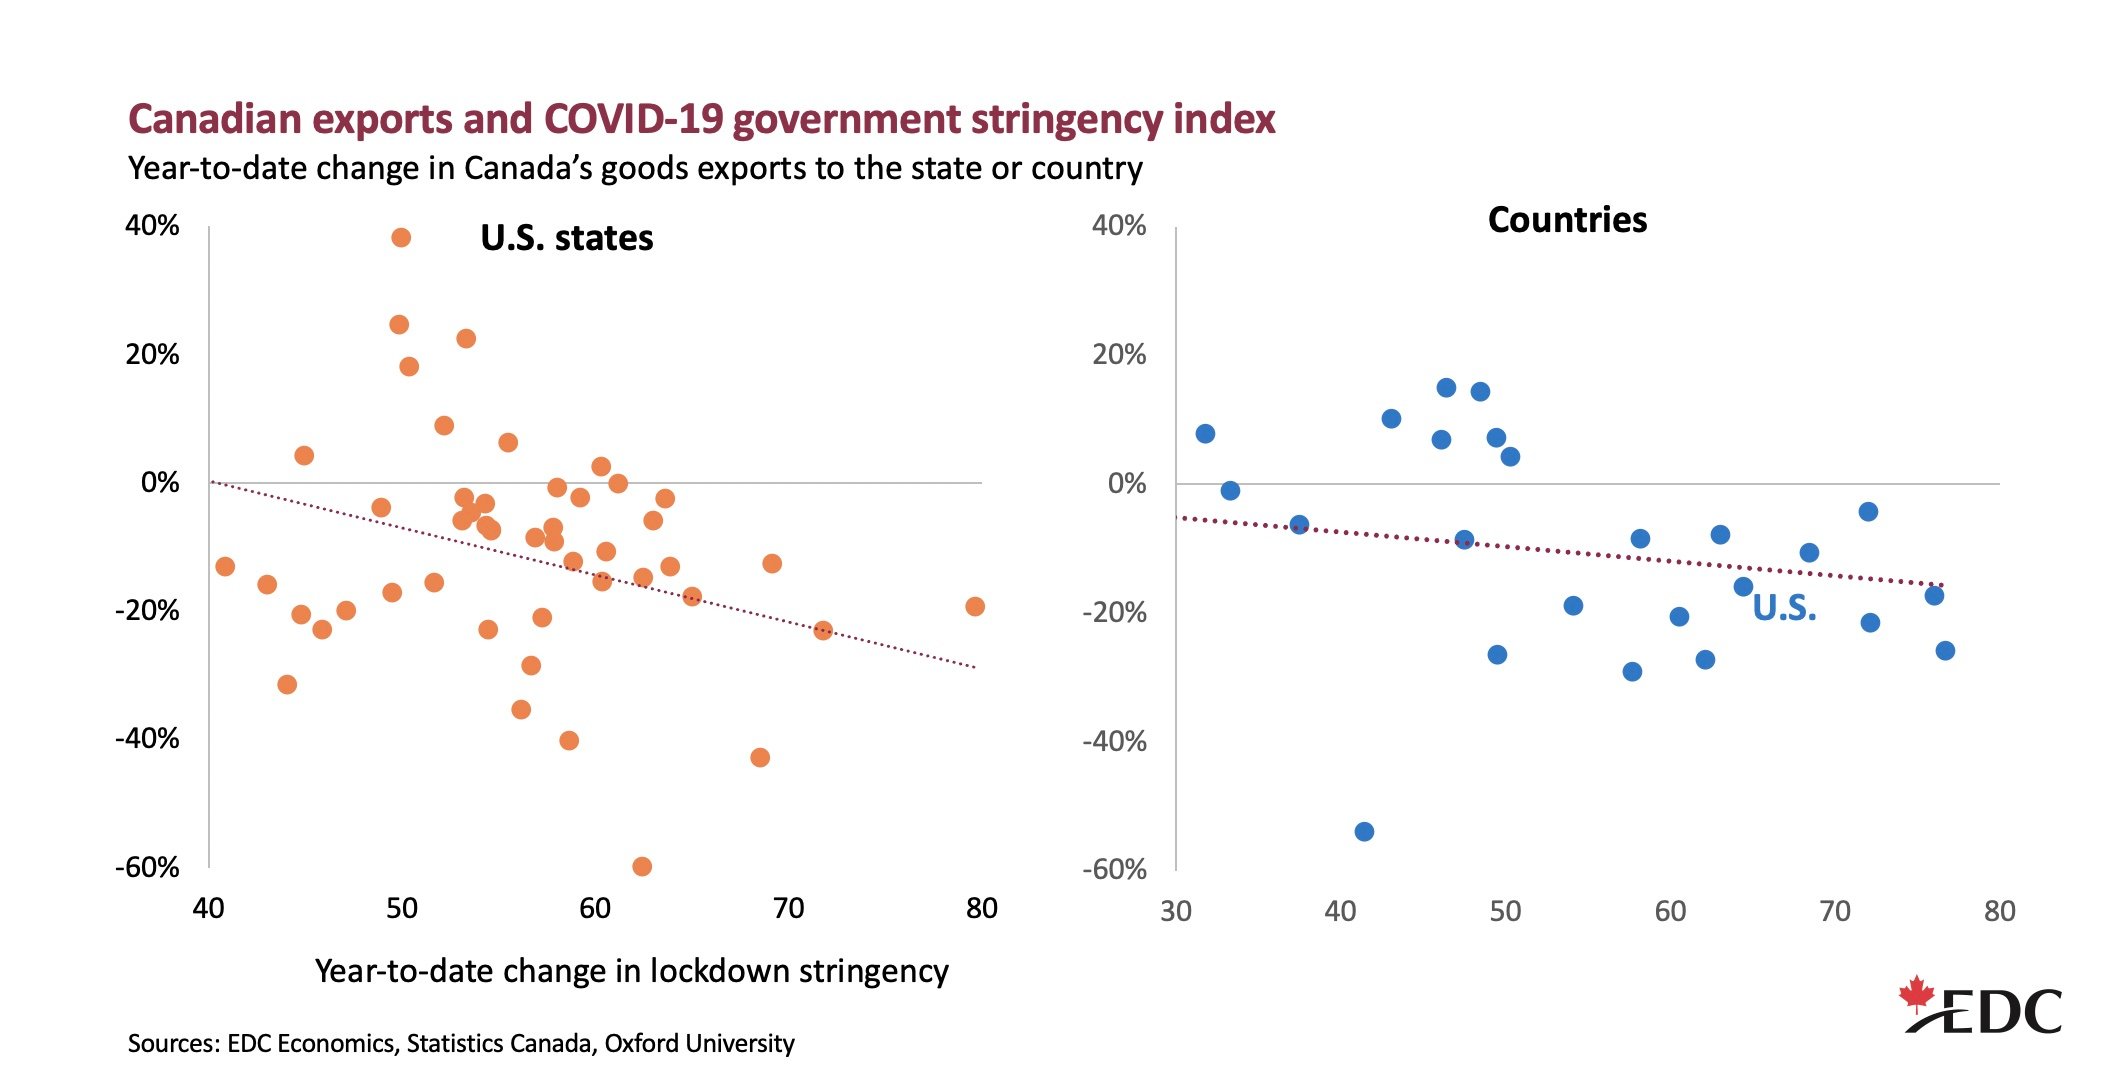
Here’s an under-appreciated economic story of 2020: Global supply chains faced a monumental shock, but have held up well so far. At the start of the pandemic, as lockdowns began to restrict business operations and idle factories, global trade was expected to collapse far worse than in the 2008-2009 global financial crisis. But after a few months of shutdowns and disruptions, goods trade — both globally and in Canada — didn’t fall as far as feared, and rebounded much faster than forecast. Led by Asian trade, they’ve delivered a strong, albeit partial, V-shaped recovery thus far. Services trade suffered a more persistent L-shaped set back, as international borders remain closed to non-essential travel.
Despite this overall trade resilience, EDC finds Canada’s exports fell farther in U.S. states that imposed stronger COVID-19 restrictions (left chart). This negative relationship holds more generally, as Canadian exports to other countries were also hit harder where COVID-19 measures tightened more (right chart).
The good news is that health authorities are close to approving vaccines and governments are readying for widespread distribution. Looking ahead to 2021, if the pandemic is successfully controlled, more markets will be able to safely loosen their business restrictions. This will promote a more sustained rebound in Canada’s goods trade. And the reopening of international borders will provide a noticeable boost to our depressed trade of travel services.
After the pandemic comes…the roaring twenties?
Livio Di Matteo, professor of economics, Lakehead University
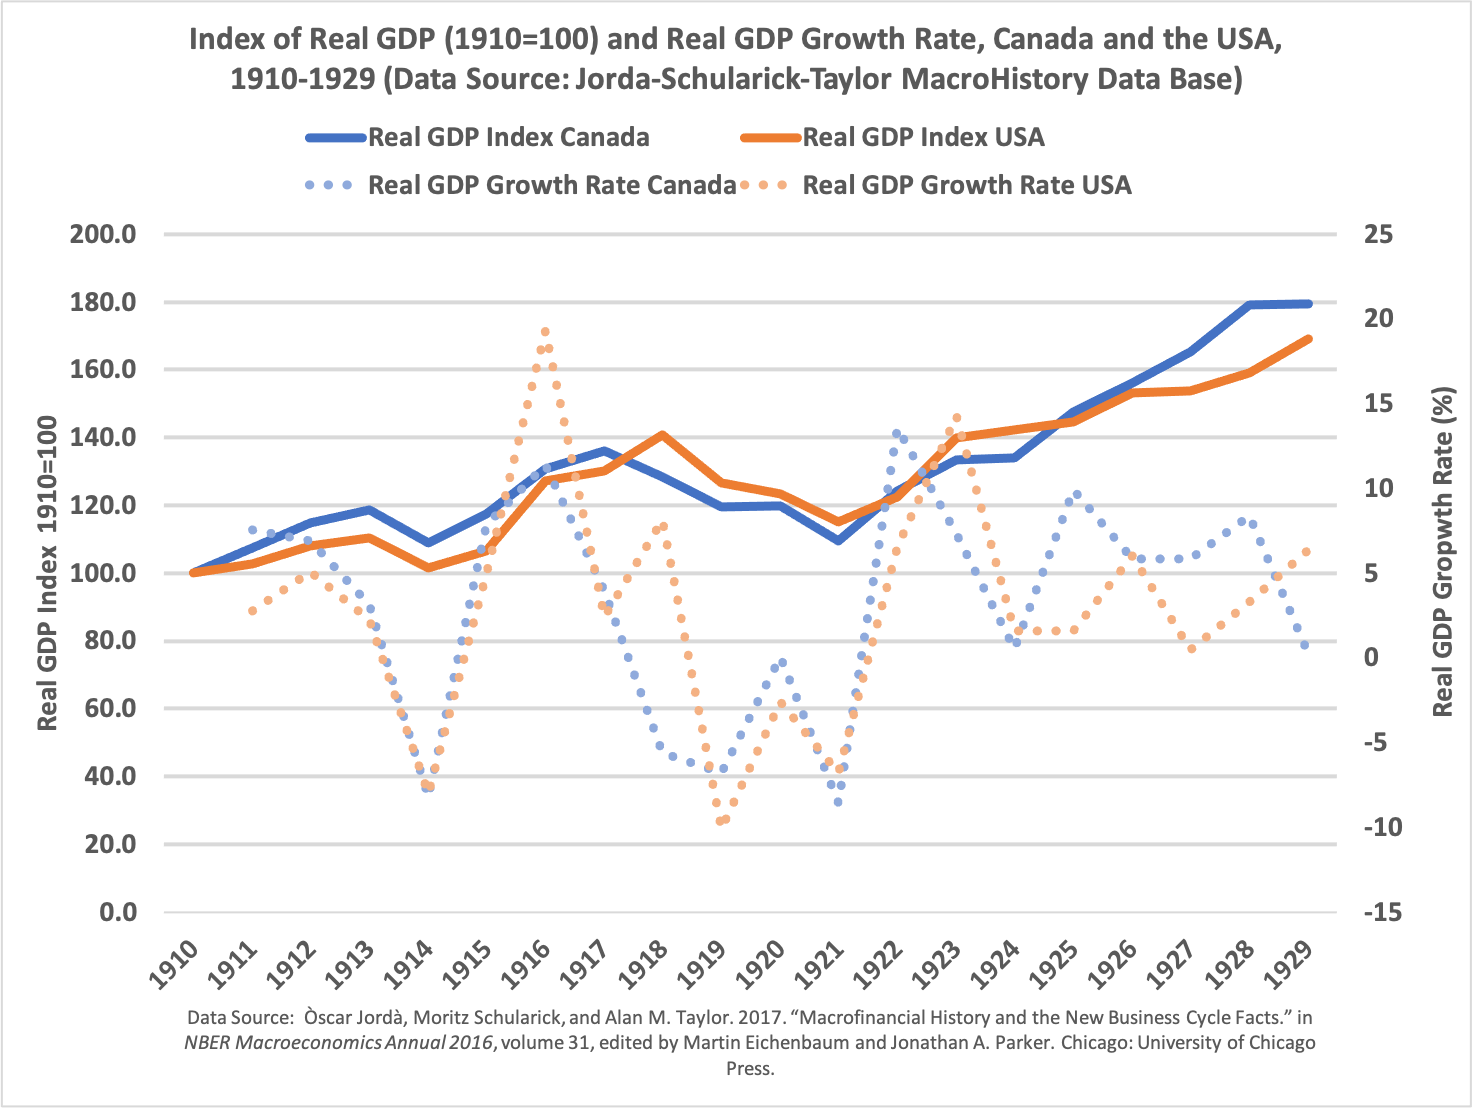
The current pandemic has devastated economies around the world, and naturally there is anxiety about what lies ahead. While economic history does not repeat itself, the past nevertheless always has lessons given that pandemics have happened before and will happen again. The era of the Spanish Flu which infected a third of the world’s population and killed 50 million in about four waves from 1918 to 1920 also saw a major drop in GDP for the Canadian and American economies. Over the period 1918 to 1920, real GDP growth in Canada averaged minus 4.1 per cent annually and the United States minus 1.5 per cent. It should be noted that unlike the present pandemic, there was not a broad-based government stimulus and income support response like the CERB. That pandemic was followed by a major recession in 1921 and then a robust recovery that continued for the rest of the decade.
From 1922 to 1929, real GDP grew at an average of 6.5 per cent annually in Canada and five percent in the United States. It was the roaring twenties and a generation scarred by world war and pandemic made up for lost time and lived as if there was no tomorrow. They fuelled a wave of consumer spending financed by rising incomes and a newly acquired taste for credit. Consumers spent on new technology like automobiles and radios along with a boom in home construction. The war and pandemic spawned massive social changes that ultimately ended the society and attitudes of the 19th century and ushered in a new age.
Of course, we all know how the 1920s ended but that is not the point. As already mentioned, human economic history does not necessarily repeat itself in an endless rigid cycle. However, human response to events and incentives are similar throughout the ages. Economic patterns and behaviour echo through time and with the end of the pandemic, there is a cause for economic optimism in its aftermath.
Is this a temporary hit to commercial construction or something more?
Arlene Kish, director, IHS Markit Canada Economics
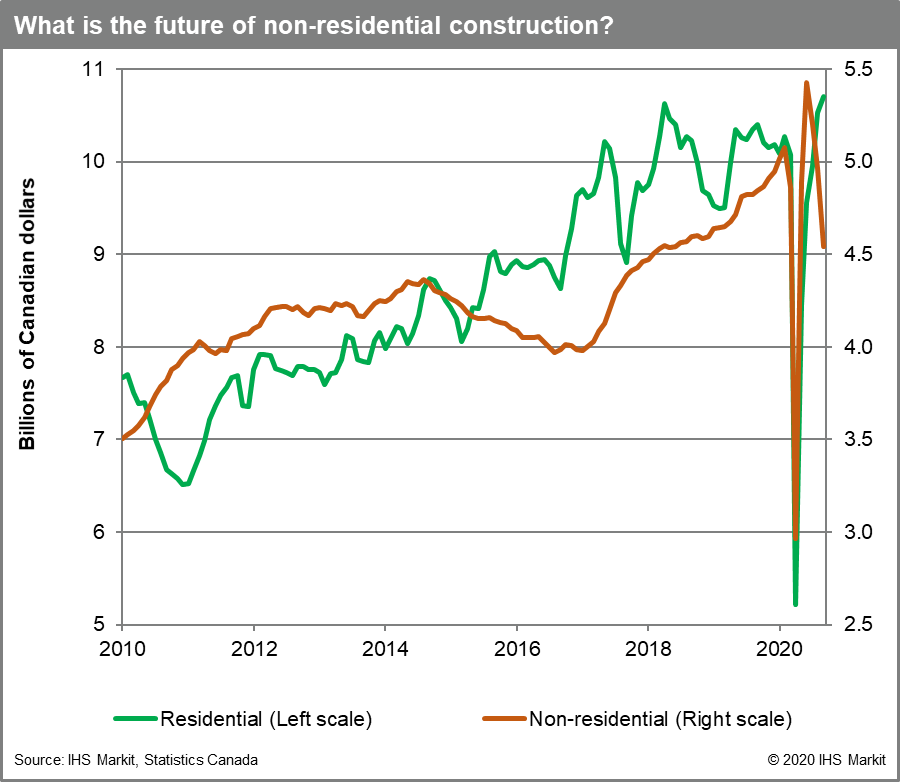
COVID-19 hit Canada’s construction industry hard during the early lockdown period of the pandemic. However, once given the go-ahead, hammers and hard hats were quickly back at work, moving the economy forward. Initially, the pandemic was thought to slow housing demand, but spending on housing construction (mostly new construction and renovations) is one of the driving forces behind the economy’s third quarter rebound. On the flip side, non-residential construction snapped back quickly, but retreated sharply after peaking in June. The downtrend was noted in commercial and industrial construction spending. Work-from-home options have businesses rethinking office space configurations or reducing their office footprints. As such, for rent signs are popping up on Bay Street as well as Main Street with the closure of small businesses because of the pandemic. Commercial vacancy rates have climbed in all major cities in Canada, reducing the need for new commercial construction spending. This begs the question, is this temporary or the beginning of a permanent trend? Modified working conditions are likely to partially remain. As demand weakens non-residential construction will most likely be concentrated in renovation spending as existing spaces are altered to meet business needs. In the short-term, non-residential construction spending will likely not be a major contributor to real GDP growth.
The economic paths of the provinces during COVID-19
Philip Smith, economist, @PhilSmith26
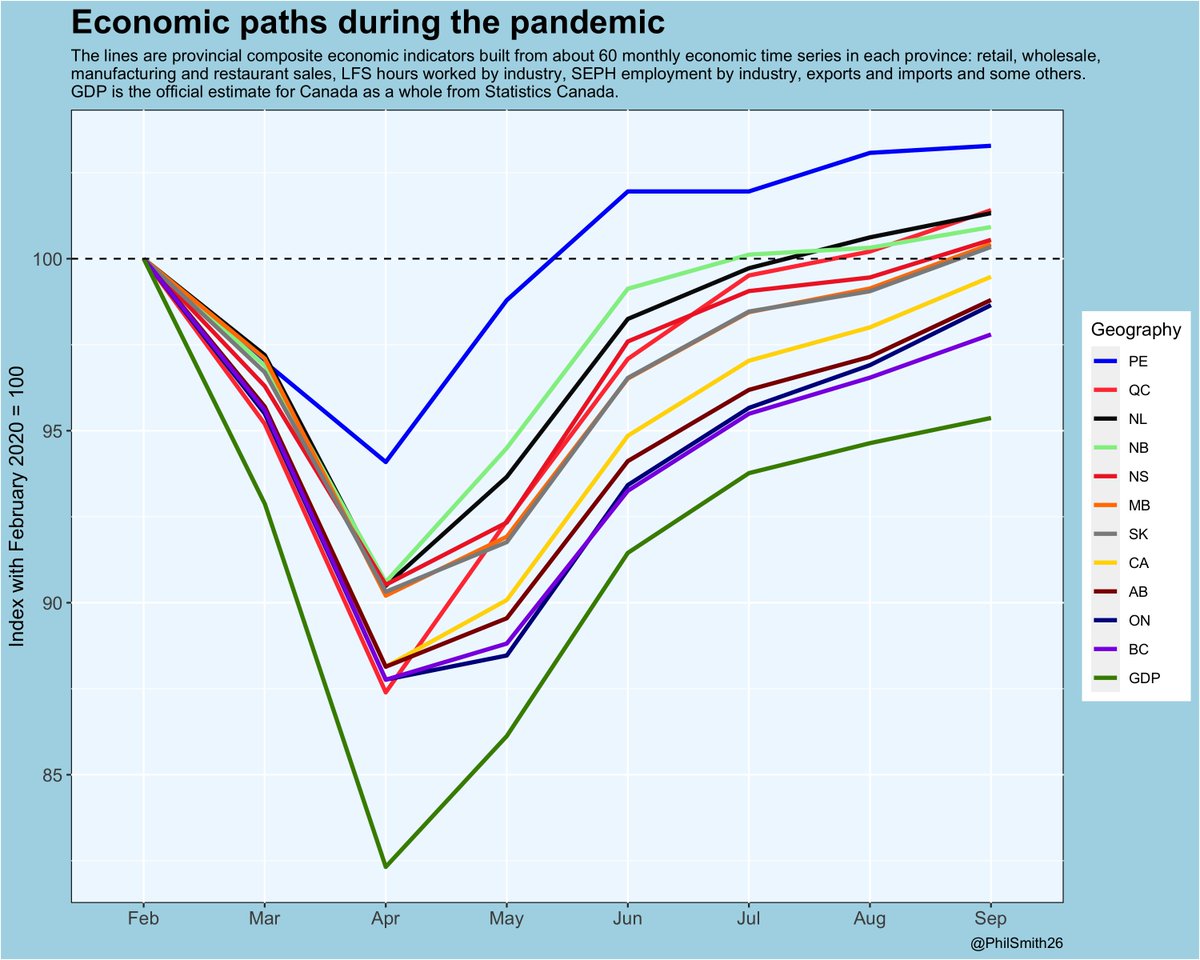
The sharp drop in economic output in March and April 2020 was unprecedented, as was the rapid rebound over the following months. This is evident in Statistics Canada’s monthly estimates of real gross domestic product. All regions of the country suffered from this big shock, but some were hurt a lot more than others. Unfortunately no consistent and comprehensive estimates of GDP are available for all of the provinces, to reveal these regional differences. Statistics Canada estimates provincial GDP only annually and with a lag of about 10 months after the reference year.
In the absence of monthly provincial GDP estimates, this chart shows estimates of the provincial economic paths during the pandemic that are derived from the available monthly economic indicators. These indicators include employment by industry from the SEPH, hours worked from the LFS, manufacturing, wholesale, retail and restaurant sales, exports and imports, and several others — 50 to 60 in each province. They are deflated and seasonally adjusted. For each province, the monthly percentage changes of these data are averaged together using the factor weights from their first ‘principal component’.
As can be seen, the plunge in GDP (18 per cent) was greater than shown by these composite indicators in any of the provinces, although the provincial paths are otherwise similar. Three of the largest provinces, British Columbia, Ontario and Alberta, are the only ones still below their February levels, before the pandemic shutdowns began. Prince Edward Island has fared best and Quebec, while its decline in March and April was sharper than in any other province, has recovered very strongly.
The reasons why some provincial economies fared better than others are related mostly to the COVID-19 epidemic. The Atlantic provinces generally, and Prince Edward Island in particular, benefitted from their relative geographical isolation, which helped keep the virus at bay. The most severely affected provinces were the ones with the big cities and correspondingly higher population densities. Variations in the strictness of government policies with respect to the virus also played a role. The economic disruptions in Alberta, Saskatchewan and Newfoundland and Labrador were compounded by the slump in world oil and gas prices.
Credit to Japanese automakers where its due
Brendan Sweeney, managing director, Trillium Network for Advanced Manufacturing (@B_A_Sweeney)
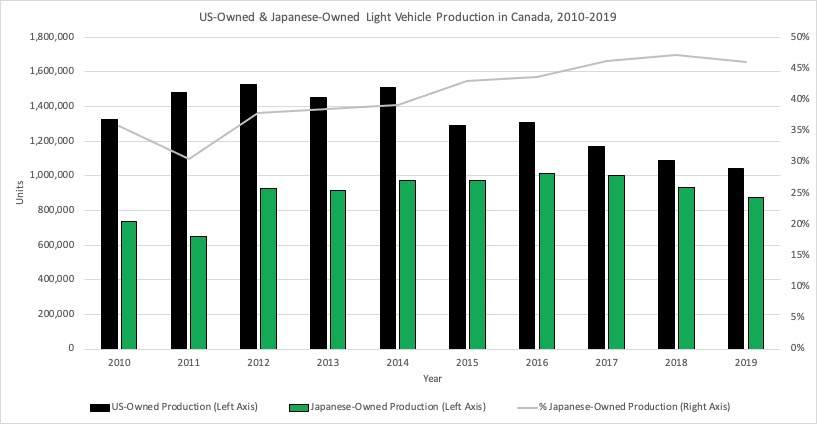
There is optimism surrounding the recently-announced investments by US-owned automakers (FCA, Ford, General Motors) in their Canadian manufacturing facilities. These announced investments are welcome news. Seemingly forgotten amid this good news, however, are the sustained investments in Canada made by Japanese-owned automakers (Toyota and Honda).
Toyota and Honda (combined) accounted for approximately 20 percent of Canadian vehicle production in 2000. This figure increased to 36 percent in 2010, 47 percent in 2018, and is expected to eclipse 50 percent in 2020. This represents the first year in which Japanese-owned automakers produced more vehicles in Canada than their U.S.-owned counterparts. Over that time, Toyota emerged as Canada’s largest manufacturer in terms of output (Magna remains the largest in terms of employment) and Honda has proven to be among the most consistent in terms of output and production.
Despite the need to approach any data from 2020 with caution, many with knowledge of Canada’s automotive industry anticipate that this trend will continue into the early ‘20s. Yet some still struggle with the notion that the Japanese-owned ‘transplants’ are equally important to Canada’s economy as the US-owned ‘domestics’. It is nigh time to recognize the nearly-equal contributions of US- and Japanese-owned automakers to Canada’s economy — is this the year we are ready to do so?
When will the hardest-hit industries recover?
Trevin Stratton, chief economist, Canadian Chamber of Commerce (@TrevinStratton)
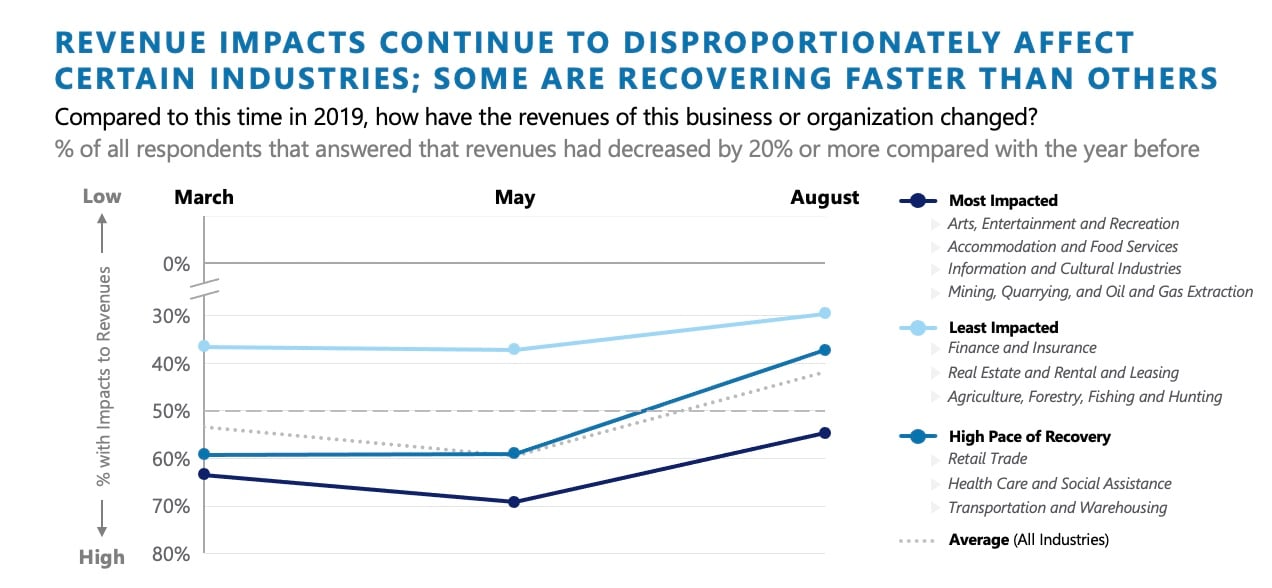
The COVID-19 pandemic affects all businesses, but has an uneven impact on different sectors of the economy. Some industries have adapted seamlessly to working remotely and using e-commerce in a virtual world. However, other sectors of the economy rely much more on physical presence and the restrictions put in place have hit them the hardest. Using data and insights from the Canadian Chamber’s collaboration with Statistics Canada and Deloitte on the Canadian Survey on Business conditions, we have mapped out what these businesses are facing. Companies in the hardest hit sectors – such as restaurants, hotels, the arts, movie theatres, and energy companies – report the highest declines in revenues, most fluctuating and insufficient consumer demand, highest likelihood to have laid off staff, and highest likelihood to be considering bankruptcy. Public investments in high-speed internet, infrastructure, and reskilling will be important for economic growth, but the recovery will also require an attractive private sector investment environment to encourage the substantial business openings and reopenings in the hardest hit sectors. This involves looking at economic fundamentals like regulatory competitiveness, tax policy, and interprovincial trade barriers that can reduce the cost of doing business and spur private investment. Just as every downturn is first felt on Main Street when the lights begin to go out, our recovery will start when the open signs begin to reappear. The true measure of every recovery is job growth, and Canada will recover when business recovers in the hardest hit sectors.
The tax on extra effort
Jack Mintz and Philip Bazel, School of Public Policy, University of Calgary, ( @jackmintz)
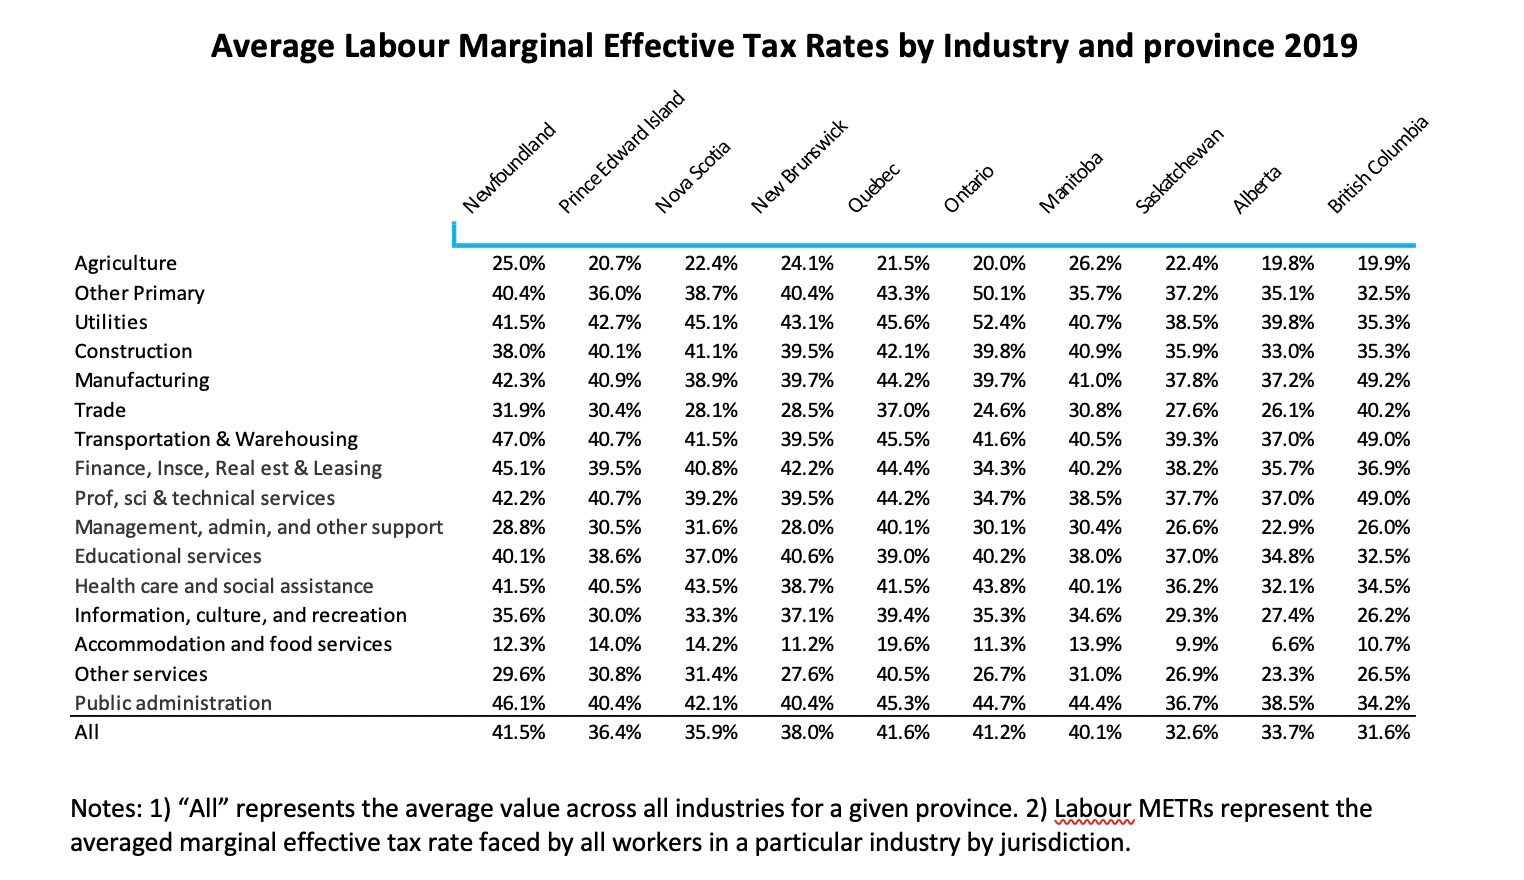
Taxes on labour are quite important. They can discourage effort to earn more income. They can also influence the willingness to join the work force. Above, we have estimated marginal effective tax rate (METR) on a dollar of income earned by extra effort by each province and industry according to the Canada-wide distribution of wages across income categories in each industry. They include employer-paid and employee-paid payroll taxes and marginal personal income tax rates in addition to consumption taxes and clawbacks on income-tested federal and provincial programs. It is often forgotten that sales and excise taxes can discourage work effort since people can choose to spend less on market goods and enjoy untaxed leisure.
The estimated average METR by industry, measured as the average METR faced by all workers in a particular industry in Canada is shown in the below (see the appendix for an explanation of the methodology). The lowest income-weighted-average METRs on labour are in British Columbia (31.6 per cent), followed by Saskatchewan (32.6 per cent) and Alberta (33.7 per cent). The highest are found in Ontario and Quebec.
Even though Alberta, British Columbia and Saskatchewan tend to have higher per capita incomes, METR on labour is least are least. It reflects lower personal income tax rates, the absence of a general payroll tax and smaller effective tax sales tax rates. Higher METRs apply in those industries that attract skilled labour that are paid more.
Energy and environment
If you build it, they will electrify?
Sara Hastings-Simon, senior researcher, Colorado School of Mines; Research Fellow, University of Calgary (@S_Hastingssimon)
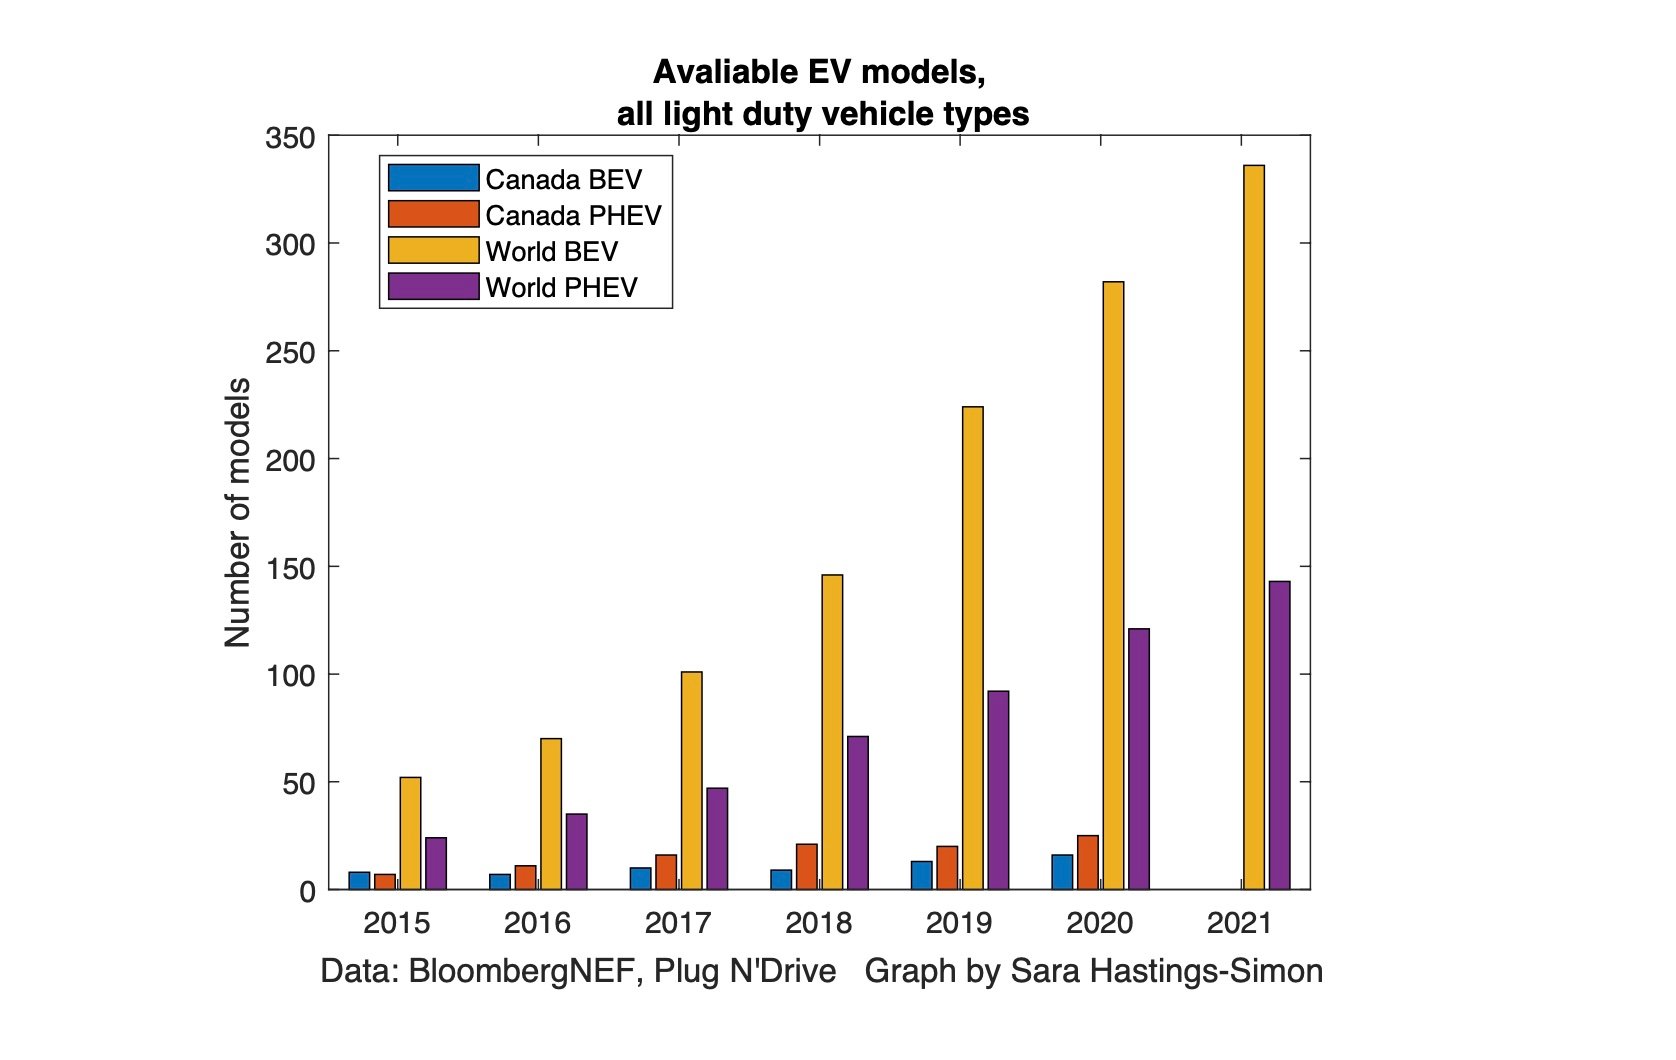
Electric vehicle (EV) sales are rising sharply around the world but the impact on total stock of vehicles to date remains modest. An examination of the growing number of EV model types available suggests this is likely to change soon as the availability of EV models is both a reflection of the degree of commitment of auto manufacturers, as well as a driver of overall sales.
For the past decades most major auto manufacturers have dabbled in the EV market, producing a handful of model types – new model development is expensive, and few were committed to an electrified future. Signs point to a shift with model availability in the fully electric category of “battery electric vehicles (BEV)” growing almost 6 times over since 2015 at an accelerating pace, outpacing plug in hybrid (PHEV) model numbers. The Canadian market always gets only a subset of global vehicle models of all types but the trend in Canada, with more PHEVs than BEVs shows Canada is lagging behind the world in this measure of electrification.
Growing BEV model availability, coupled with the falling costs in batteries, can be expected to translate into more sales by reaching beyond the smaller early adopter market with an offering to meet a range of needs in the mass market. Rather than shopping specifically for an electric vehicle, consumers will increasingly find that the vehicle that works for them just happens to be electric.
Electrification of transport will have many impacts on Canada – from transforming global oil and vehicle demand and the resulting impacts on trade, to more local infrastructure and emission changes. With a steady drumbeat of announcements of increased spending from manufacturers in recent days and many more models to come in the mid 2020s already under development this chart will continue to rise and is one to watch in the 2020s as a leading indicator of a EV sales.
Coal powering down in Alberta
Blake Shaffer, assistant professor of economics, University of Calgary (@bcshaffer)
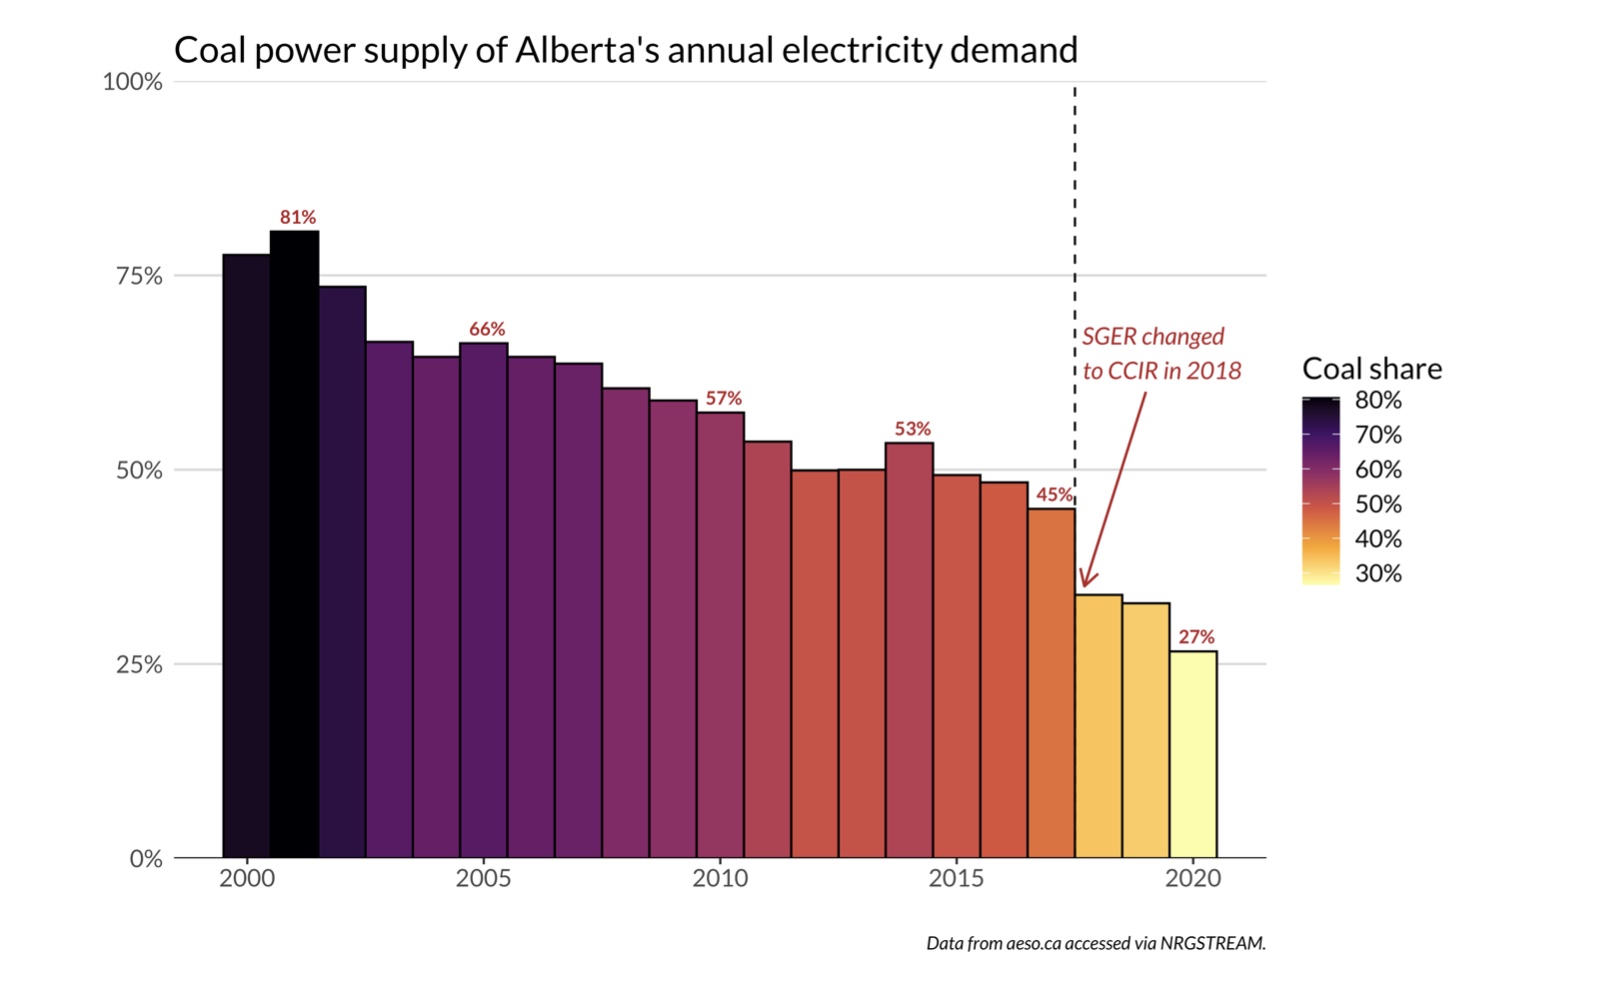
Alberta’s electricity system, long dominated by coal power, is rapidly seeing the share of this emissions-intensive source disappear from its power system. Once supplying over 80 per cent of all power in the province, this year has seen coal’s share drop to nearly a quarter.
Carbon pricing, strengthened by the previous NDP government and left in place by the current UCP, has shifted the economics of power production, away from coal and towards natural gas and renewables. While Alberta currently has a coal phase-out in place for 2030, the end of coal- burning power plants in the province will likely occur well before that.
While natural gas power still comes with emissions, the shift in power production is likely to cut Alberta’s electricity sector emissions by roughly 50 per cent since 2015. Watch for this to continue in the years to come.
The challenges and opportunities of ‘net zero’
David Watt, chief economist, HSBC Canada
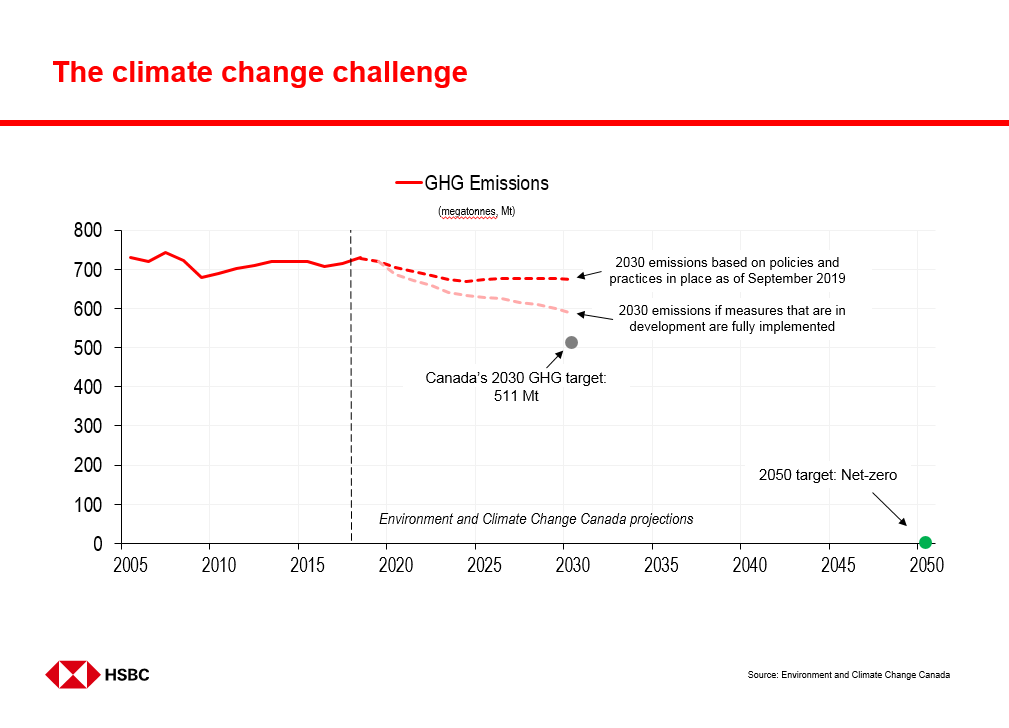
To mitigate climate change risks, Canada has committed to cutting greenhouse gas emissions to 30 per cent below 2005 levels. This would involve GHG emissions falling from 730 megatonnes (Mt) to 511 Mt, a decline of 219 Mt by 2030. Thus far there has been limited progress on lowering GHG emissions. That said, policies in place as of September 2019 will lead to a 56 Mt decline in emissions by 2030, with declines in the electricity production sector, transportation, and from buildings, which, together, represent almost 50 per cent of emissions. However, even with additional policies in development in late 2019, Canada would still miss its 2030 target by 77 Mt. Hitting the 2030 GHG target will require even more targeted emissions reduction policies, and will require the participation of other industries such as oil and gas (26 per cent of GHG emissions), heavy industry (11 per cent), and agriculture (10 per cent). Achieving GHG reductions targets, including 2050’s net-zero target, will require profound changes across all sectors of the Canadian economy. These changes will involve some challenges, but will also present significant economic opportunities, and to successfully lower emissions the transformation toward a low-carbon growth economy needs to become embedded even as the economy recovers from the pandemic.
Watching for the oil market to recover
Andrew Leach, associate professor, Alberta School of Business, University of Alberta, (@andrew_leach)
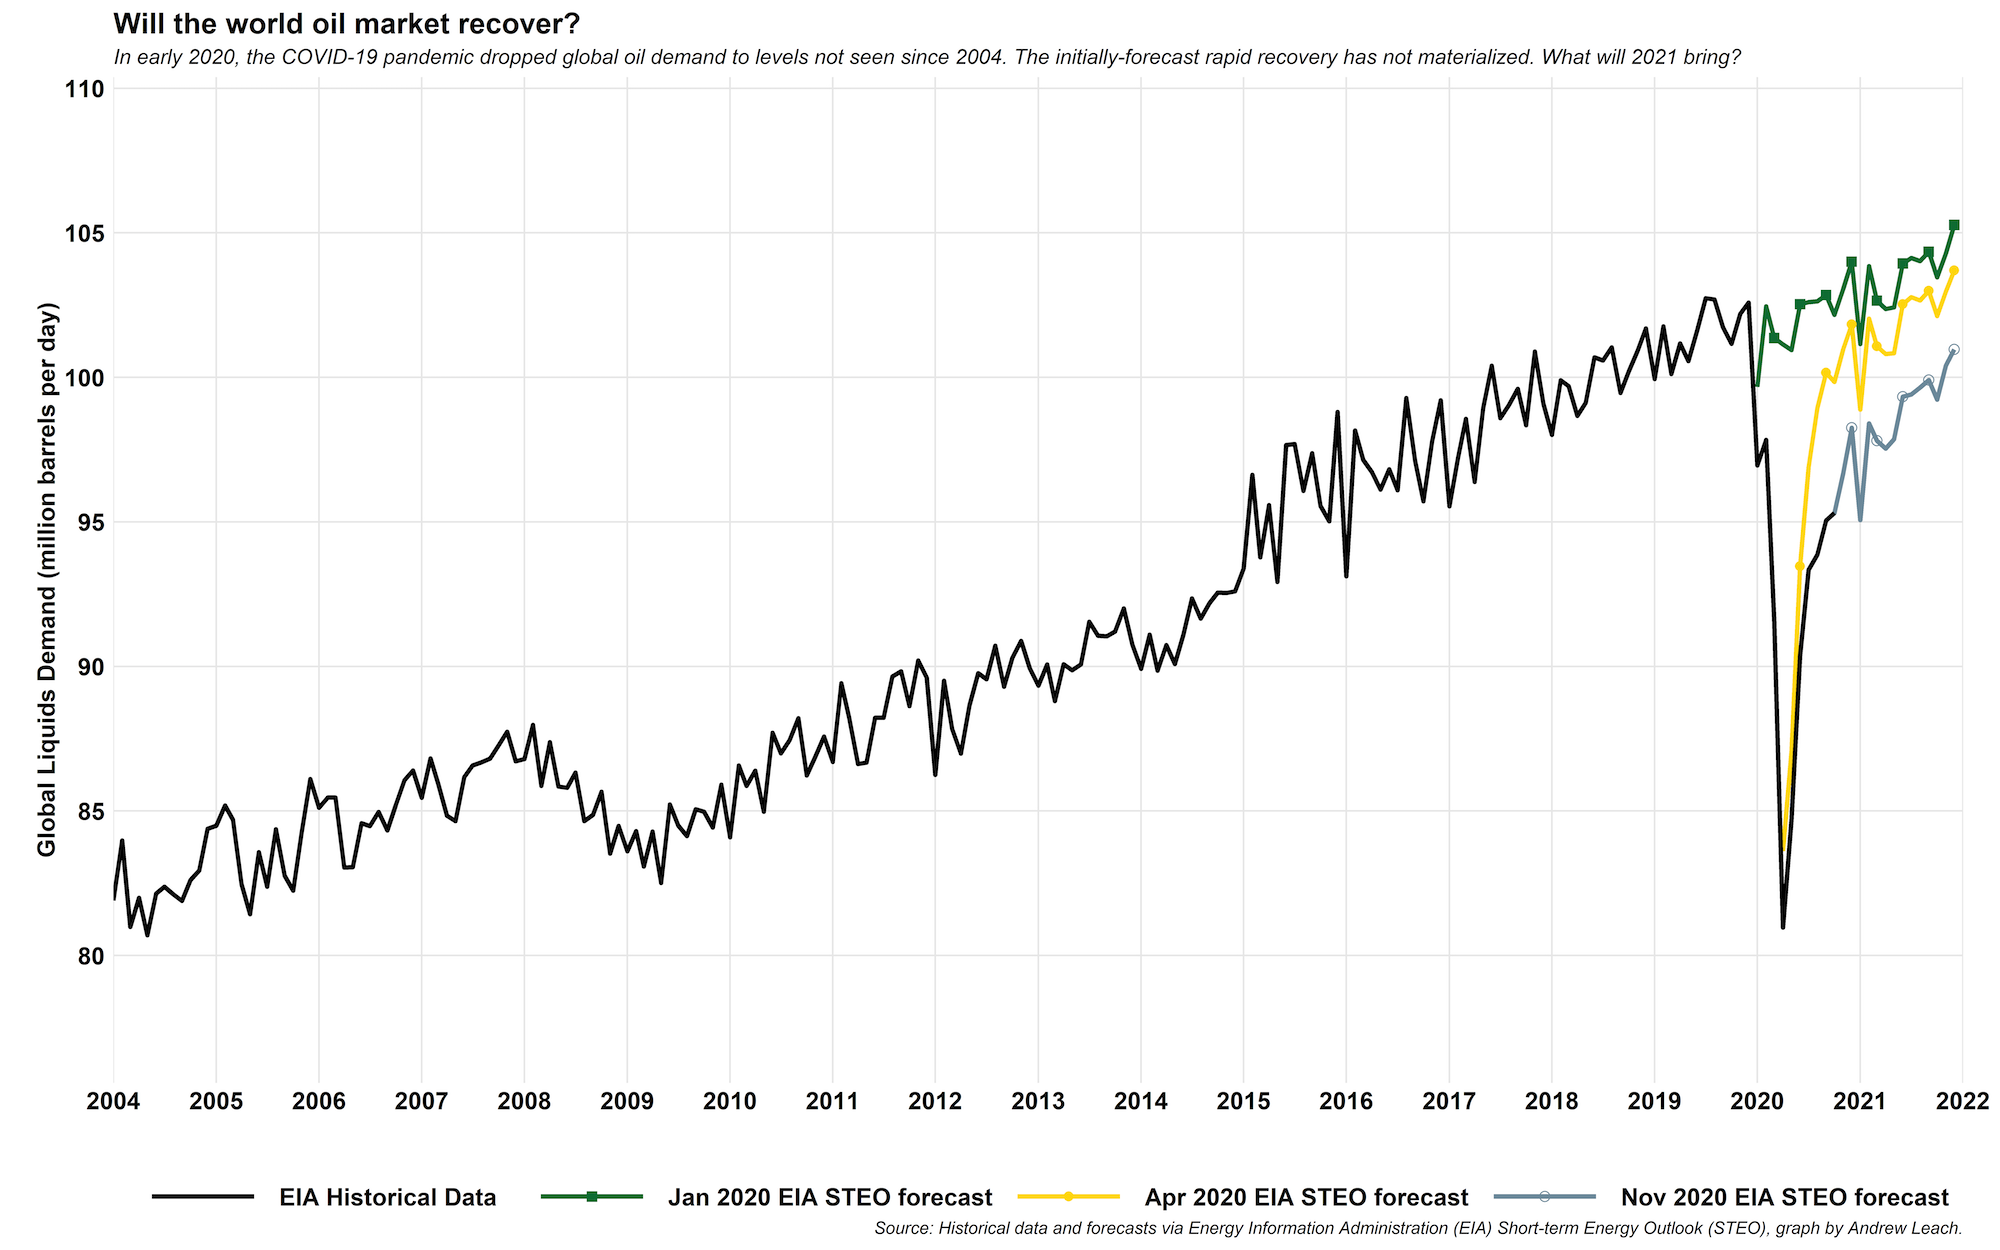
Other than 2008 to 2010, global oil demand has reliably tracked upward for decades. In late 2019, forecasts from the US Energy Information Administration (EIA) were expecting 1.5 per cent growth in demand through 2020. The COVID-19 pandemic changed all of that, and in a hurry. By April, global demand was down more than 20 per cent, prices for West Texas Intermediate futures contracts traded at negative prices for the first time in history, and the whole market was left reeling as people stayed home, cars stayed parked, and air travel ground to a near-complete halt. The light at the end of the tunnel for many producers, and for large swaths of the Canadian economy, was a forecast rapid recovery — a v-shaped recovery. It never came, at least not for oil. In April, EIA forecasts had oil demand roaring back to late 2019 levels by late 2020. That’s no longer the case. The EIA’s November 2020 forecast, issued as much of the world was heading back into lockdown, was much more reserved, and even that now appears likely to be overly optimistic. Without a doubt, this is the chart that I’ll be watching through 2021 as vaccines become (we hope) available, and we can start to think about economic recovery. Whether the oil market will recover along with the rest of the economy, more rapidly or more slowly remains an open question with very high stakes for Canada.
Alberta’s unnecessary reliance on non-renewables
Kirsten Smith, research associate, Center on Global Energy Policy at Columbia University (@kirst_nicole)
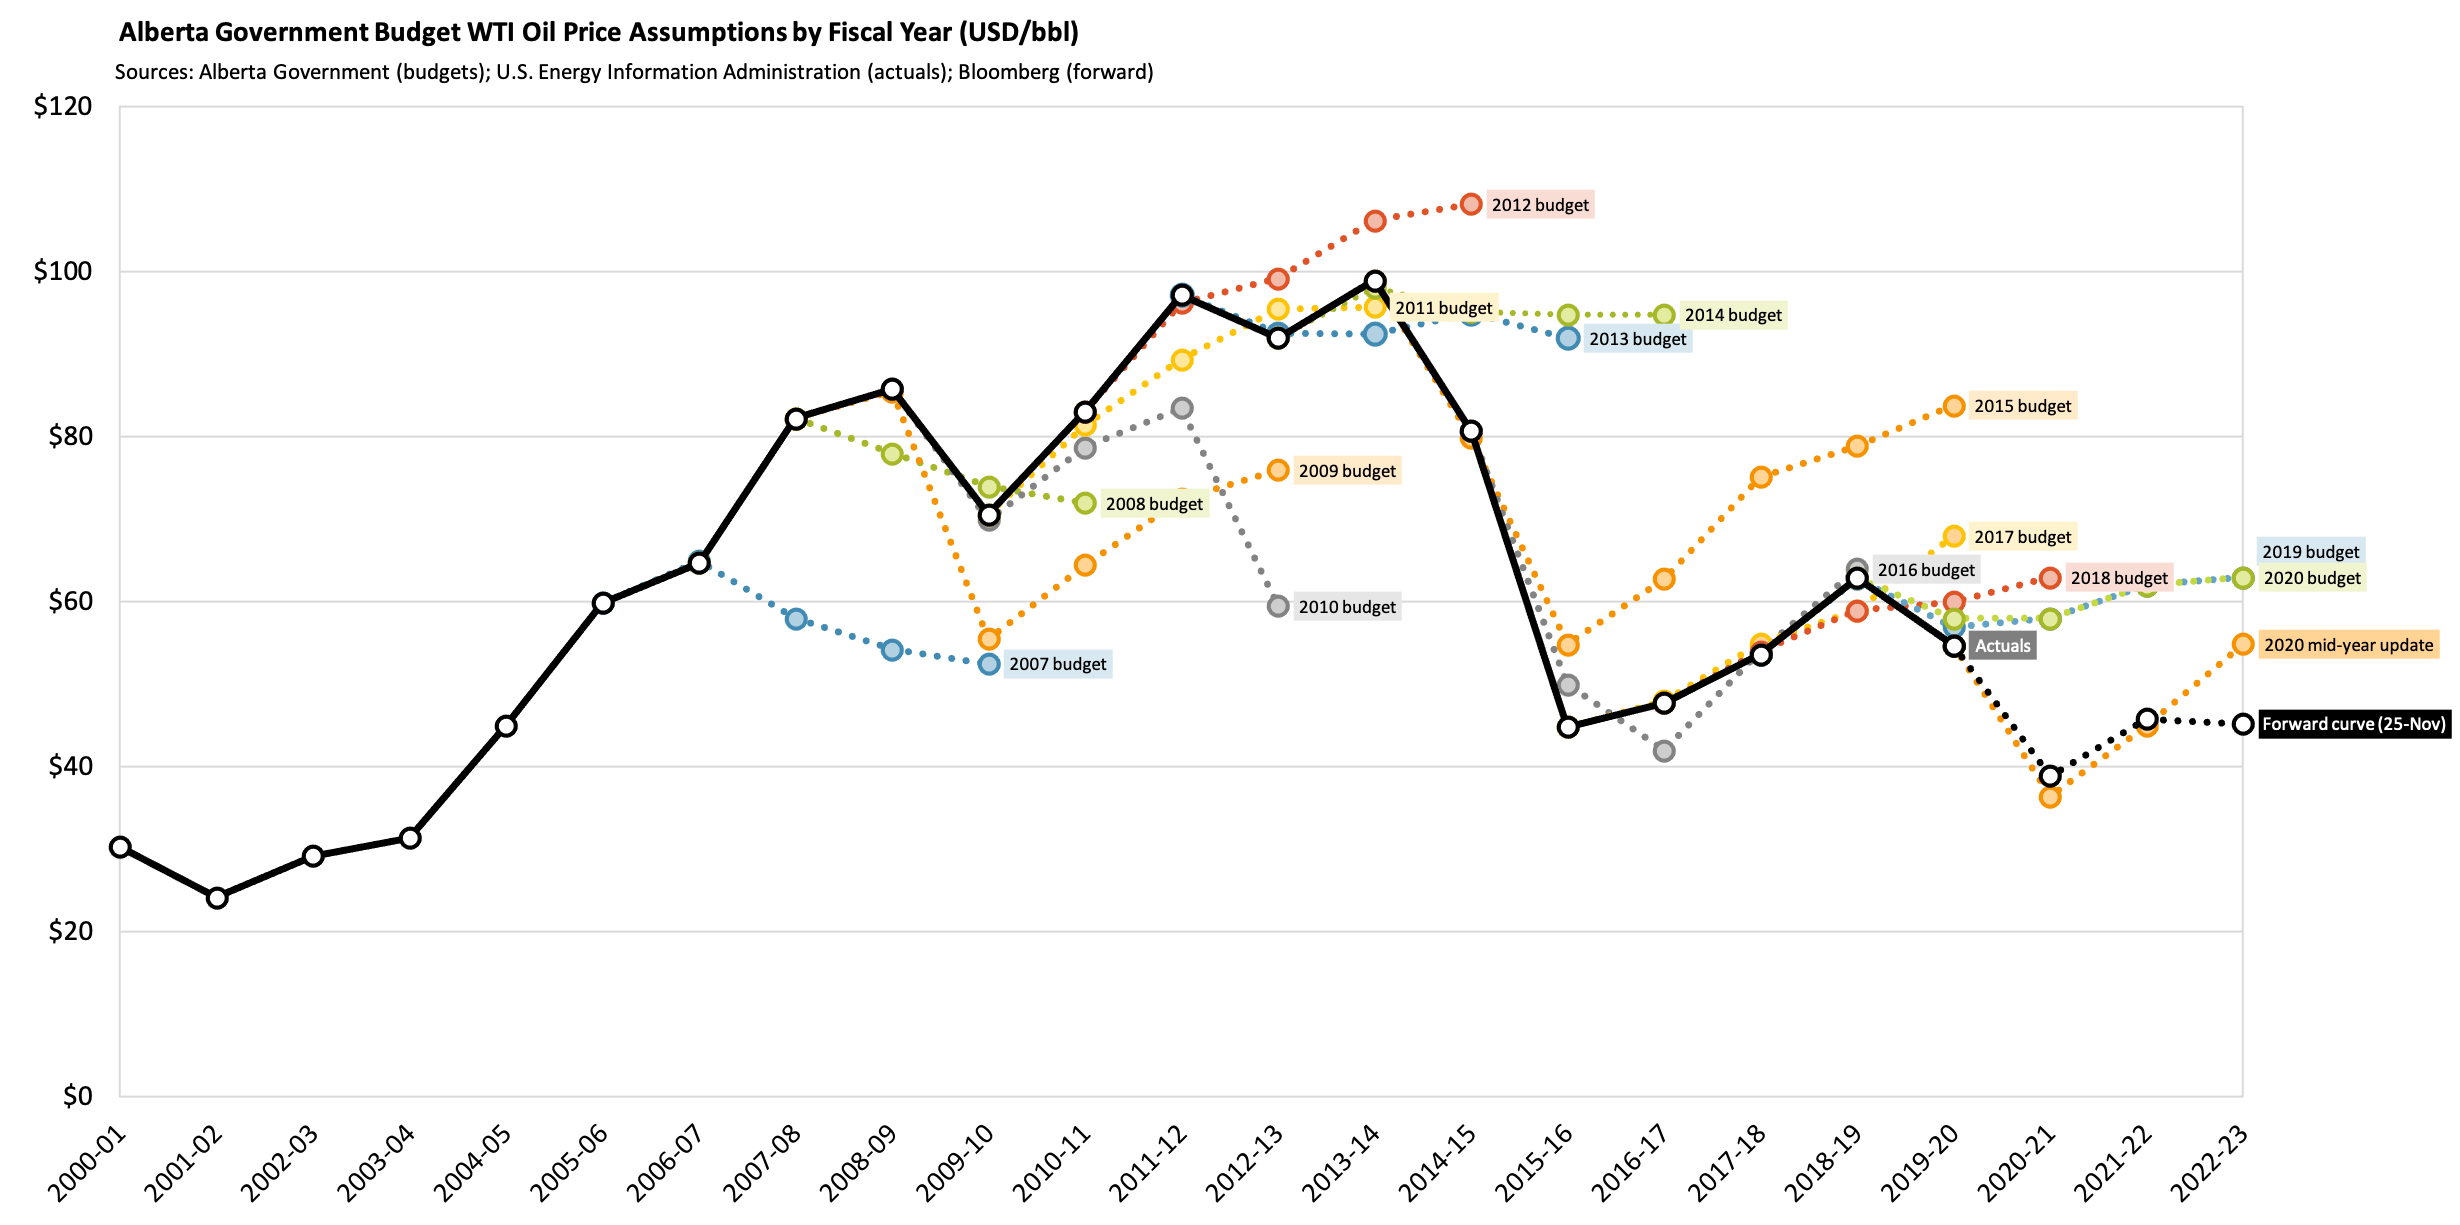
The Alberta Government released their 2020-21 Mid-year Fiscal Update on November 24, 2020 and Albertans can now rejoice that their government has finally aligned its West Texas Intermediate (WTI) oil price assumptions with the market (forward curve) for the current fiscal year. That being said, let’s take a moment to reflect on some of our recent budgets.
The Alberta Government is really bad at making oil price forecasts. I can say this because 1) it’s obvious, and 2) I used to be a part of the team at Alberta Energy that made these projections for the budget each quarter. Oil price forecasting is hard and as we, scenario modellers, like to say, “All projections are wrong, it’s just a matter of how wrong they’ll be.” But that brings me to my next point. Why does it matter so much to Alberta? It need not.
Alberta governments of all shapes and sizes have long relied on non-renewable resource revenue to fund themselves and the economy. This is a choice and it bears repeating, it is a choice we do not have to make. The overall portfolio of taxes, income and fees should be diversified. There is no reason for government revenues to be this heavily tied to the price of oil.
Stable institutions are an important precondition for a prosperous economy. Our need for teachers, doctors, transit systems, and, yes, a strong public service, does not vary with the price of WTI and our spending decisions should not either. The public sector and the private sector alike, work hard to contribute to Alberta’s future success. We have been blessed as a province with an abundance of energy resources, but our most important asset is the people that live here. We should strive to provide them with stable institutions and essential public services, regardless of the daily fluctuations of a global commodity market.
Shoppers leaving a smaller footprint
Karl Schamotta, chief market strategist, Cambridge Global Payments, (@vsualst)
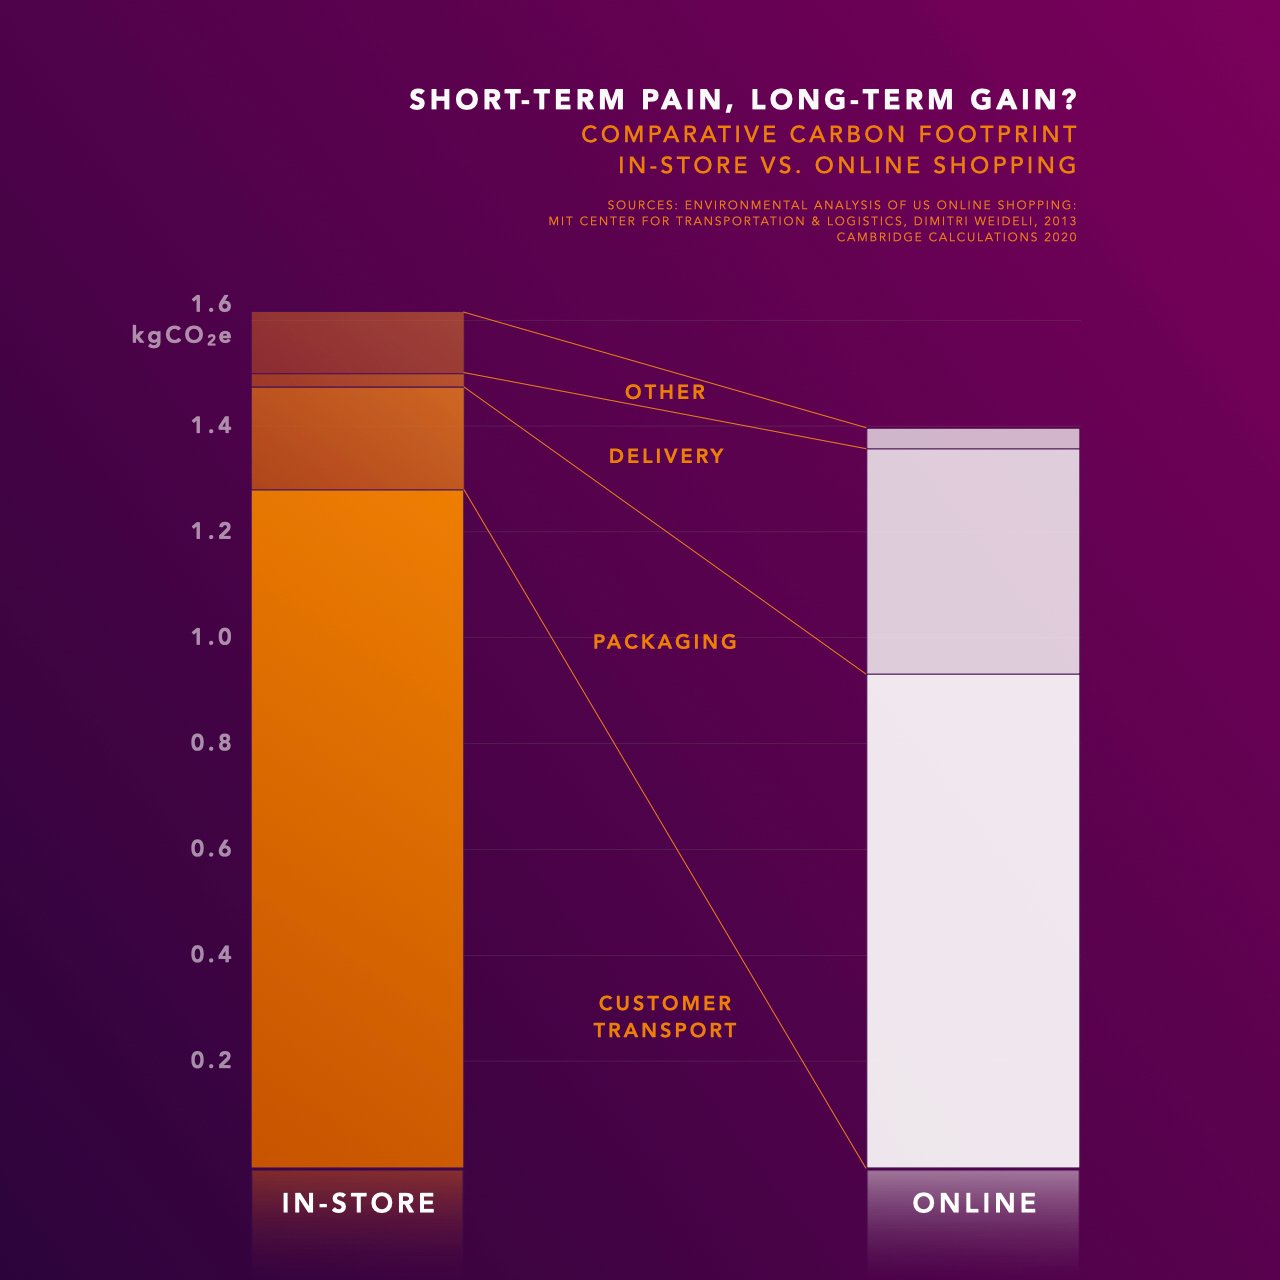
In the space of less than ten months, the coronavirus pandemic has forced the world to undergo more technological change than often occurs over decades. Traditional bricks-and-mortar retailers have suffered terribly. But research shows that by drastically reducing the transportation costs involved in finding and purchasing products, online shopping reduces economic and environmental waste. If we can find ways to redeploy newly-available resources and retrain workers, the productivity gains unleashed by COVID-19 could generate spectacular rewards in the years to come.
The spread of the Gutenberg printing press was hell on scribes, but it made us all far better off in the long run.
What’s next for carbon prices in Canada?
Joel Wood, associate professor, School of Business and Economics, Thompson Rivers University (@JoelWWood)
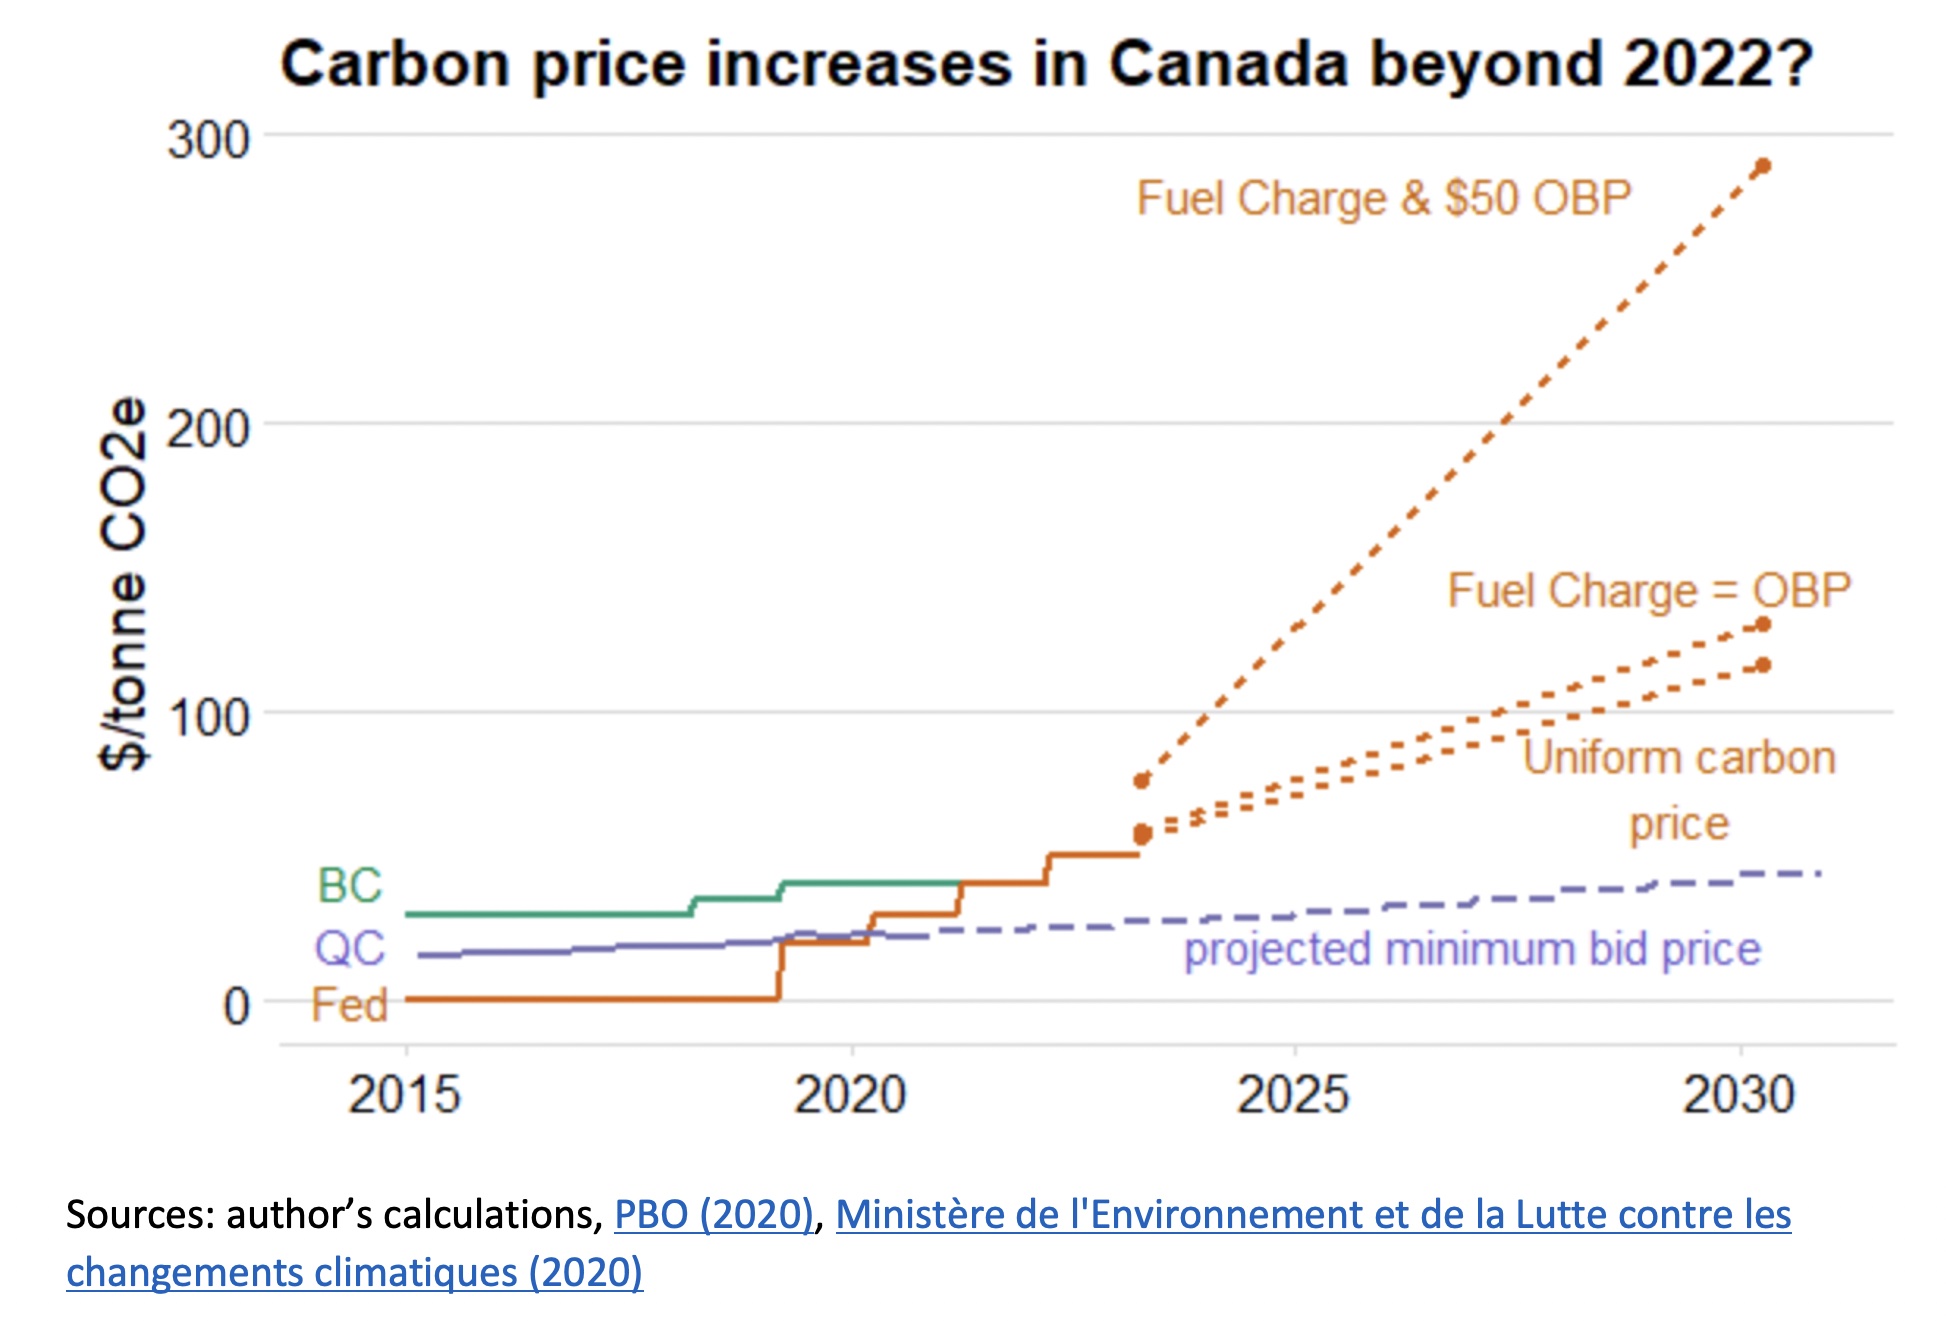
The federal carbon price (implemented through the federal Fuel Charge and the Output-Based Pricing System [OBPS]) currently has no additional increases planned past 2022. However, modelling by the federal government shows that existing and planned climate policies are insufficient to achieve Canada’s 2030 emissions reduction target. Recently, the Parliamentary Budget Officer released a report detailing three carbon pricing pathways that could close the gap and achieve the 2030 target: One with a uniform carbon price (OBPS is replaced), one in which the Fuel Charge remains equal to the OBPS, and one in which the Fuel Charge increases but the OBPS does not. In 2021 I will be watching to see if the federal government adopts one of these pricing pathways, or instead chooses less flexible but more opaque policies.
Will Canada keep pace in electric vehicle adoption?
Hilliard Macbeth, author and portfolio manager, (@hmacbe)
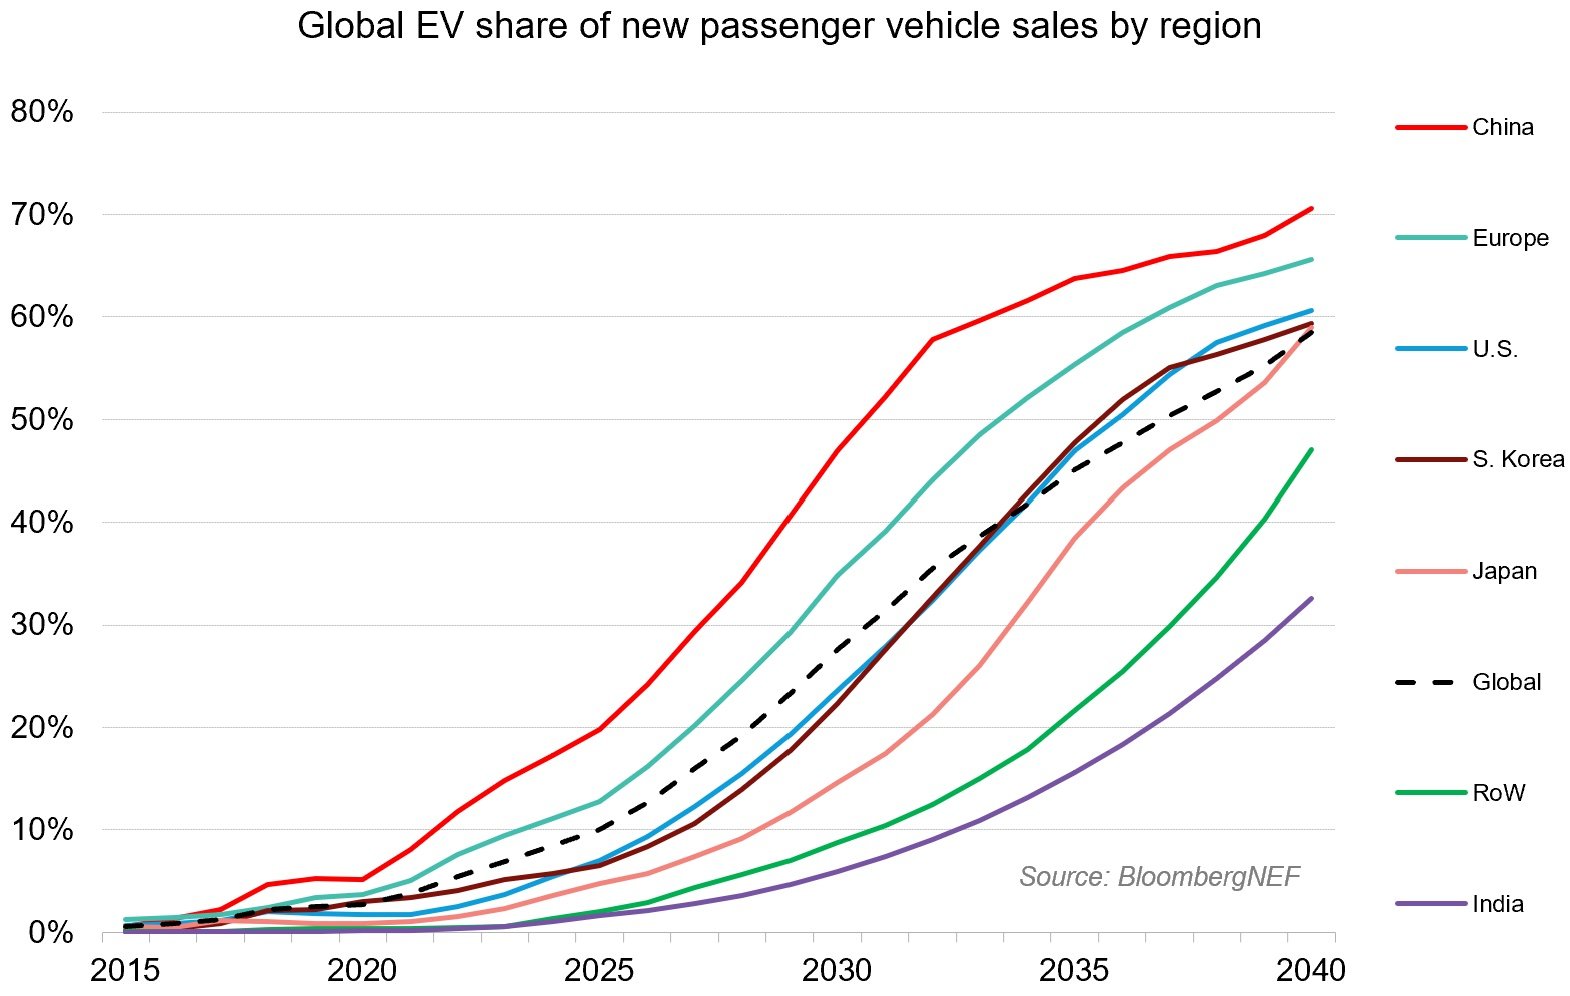
New passenger electric-powered vehicle sales will hit 60 per cent of global total by 2040, according to a forecast by BloombergNEF. A shift to electric passenger vehicles may happen even more quickly, if current trends accelerate. Canada’s electric vehicle sales are at 1.7 per cent share, slightly lower than the U.S. at about two per cent. Without a new strategy, Canadian auto manufacturing will be left in the start gate during this important change in consumer preferences.
Markets
SHOP till you drop
Alexander MacDonald, Cowan Asset Management (@alex_macdonald )
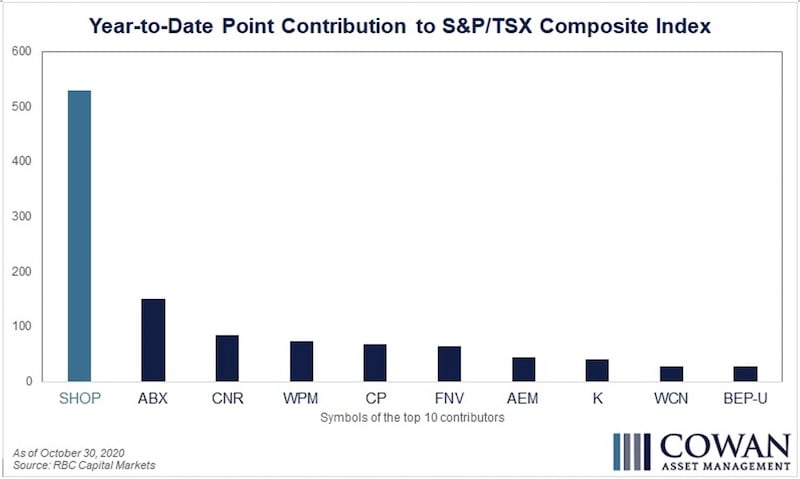
The S&P/TSX Composite Index hasn’t had a great 2020 thanks to the pandemic: it’s down 1,483 points, equivalent to a nine per cent drop through the end of October. However, if not for the remarkable returns generated by a single stock, things would be much worse. Shopify Inc. (ticker symbol “SHOP”) is up 138 per cent over the same time, which has helped it surpass Royal Bank of Canada as our country’s largest public company. This combination of incredible returns and incredible size resulted in SHOP alone contributing +529 points to the index’s performance through October. To put that in perspective, it’s more than the next seven biggest contributors combined; if SHOP’s gain this year was excluded, the index would have been down 12 per cent. At the time of writing, a potential COVID-19 vaccine has just been announced. This has caused the so-called “stay at home” stocks, a group that includes SHOP (as the company specializes in online storefronts), to sell off: the stock is down 15 per cent in the two days following the vaccine announcement. Many Canadian investors will be watching whether continued progress in fighting the pandemic and getting life back to normal will lead to continued pressure on SHOP — and the TSX — in 2021.
Copper comeback bodes well for the global economy
Avery Shenfeld, chief economist, CIBC Capital Markets
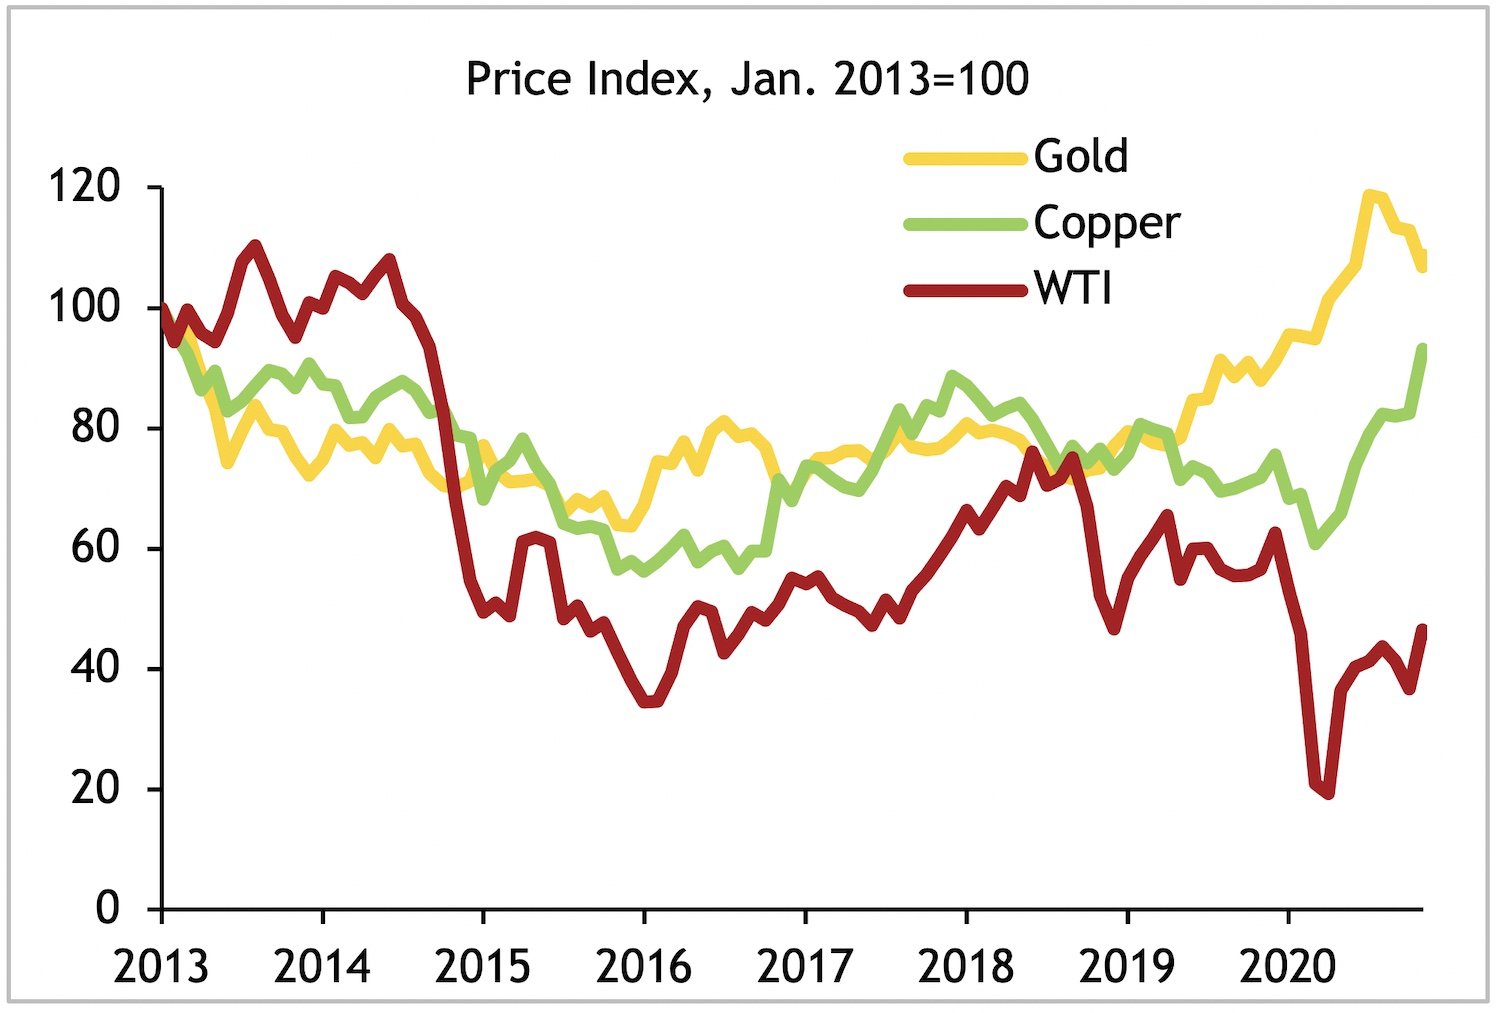
In looking for turning points in the global economy, it pays to be a heavy metal fan. Don’t dust off your Motley Crue albums, but keep an eye on prices for industrial metals, where demand is closely tied to the business cycle, rather than gold, which has actually benefited from economic uncertainty and very low interest rates on major currencies. Copper is already showing strength, and not only due to supply disruptions. But unfortunately for Canada’s economy, WTI crude oil prices are likely to lag behind, with demand so closely tied to driving and flying, two activities that will need a full year of vaccine deployment to really get going again.
The acceleration of digital currency
Barry Schwartz, chief investment officer, Baskin Wealth Management, (@BarrySchwartzBW)
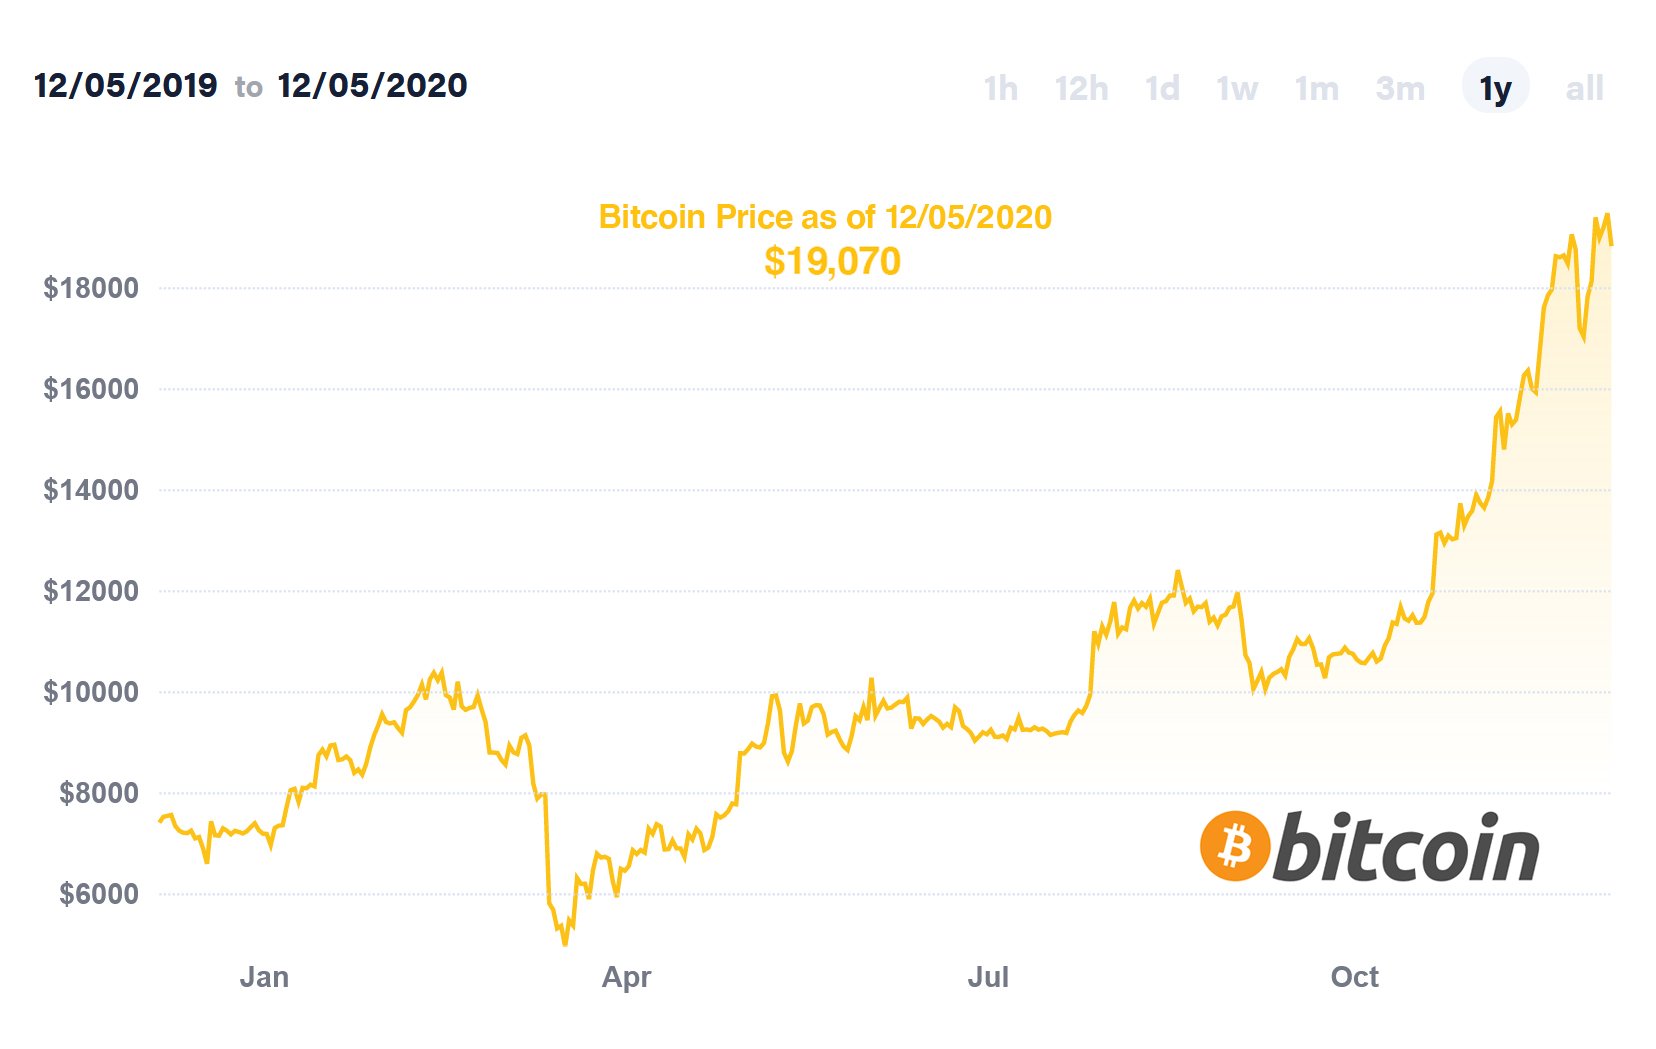
No one knows who invented it, few understand it, but many are shocked at the parabolic price move of Bitcoin during 2020. Whatever views you have about Bitcoin, this much is true: It can no longer be ignored. Large financial institutions, such as Blackrock and Guggenheim, are considering investing in it, and virtual payment platforms, such as PayPal and Square, are enabling customers to buy, sell and transfer them. Covid-19 has accelerated our shift toward the virtual world, so it only makes sense that our currency becomes digital, and Bitcoin may have a major role in how we transact with each other going forward.
The U.S. equity market’s sectoral edge over Canada
Kurt Reiman, senior strategist for North America, BlackRock
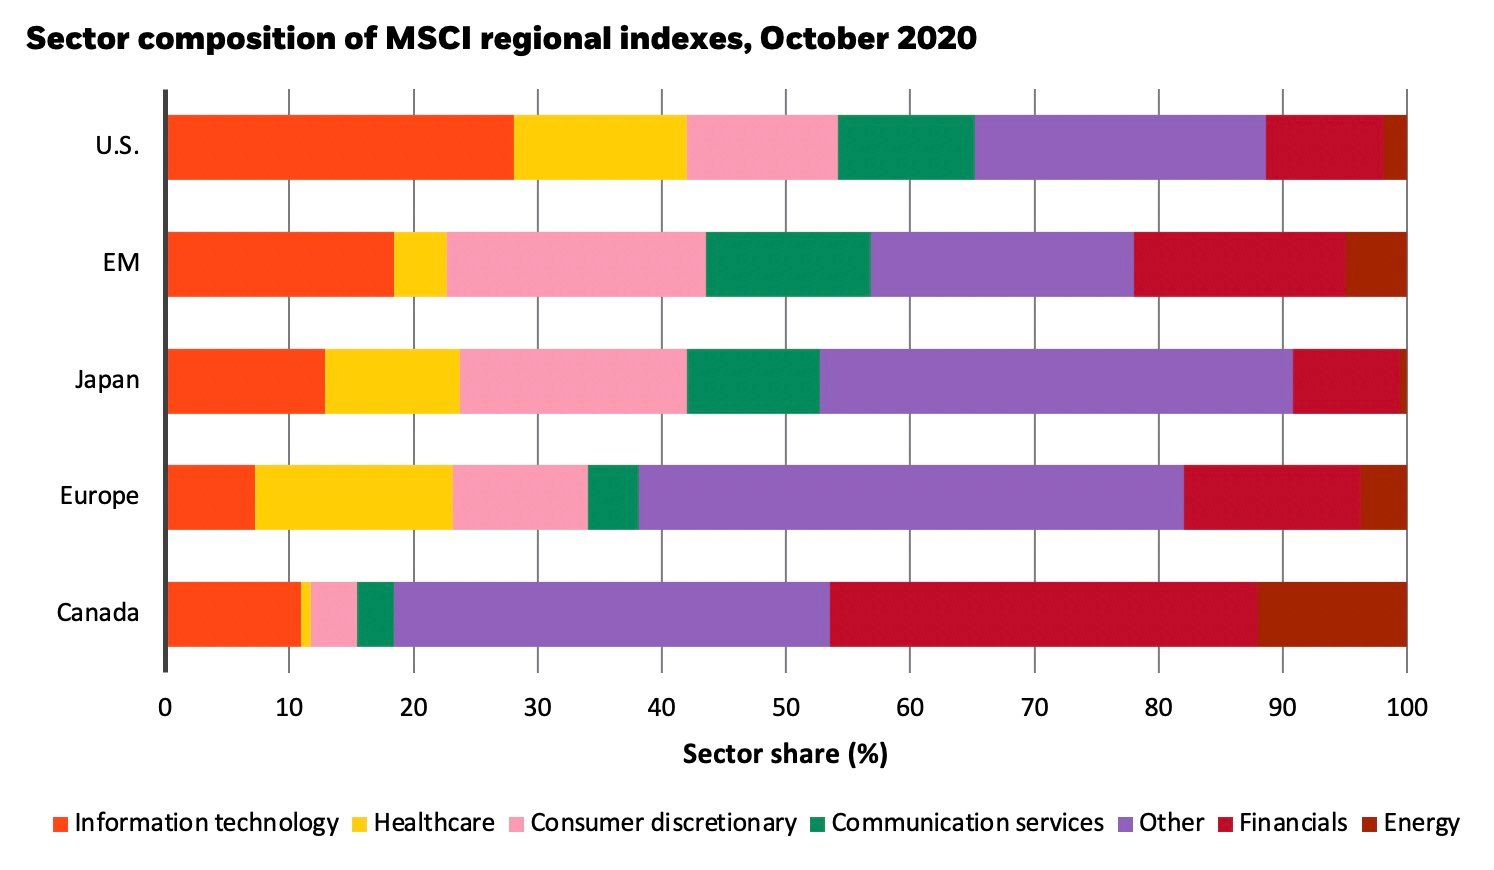
We believe the usual business cycle playbook doesn’t apply to the pandemic: the same way the activity “stoppage” was different from a “recession,” the “restart” is different from a “recovery.” This is not a broad-based cyclical recovery story. This is playing out at the sector level: an uneven rebound across sectors combined with turbocharged transformations related to sustainability and technological adoption that were already very much in motion.
Canada’s economy and financial markets have been at the centre of this transition for years. During the past five years, the information technology sector has grown to 11 per cent of the MSCI Canada equity index from just under three per cent in 2015, whereas the energy sector has shrunk to under 13 per cent of the index from 20 per cent. Accelerated demand for software and e-commerce are at the heart of the flourishing Canadian tech sector, whereas energy companies are facing divestments and limited production growth amid oversupplied conditions and a transition to low-carbon energy sources. This transition offers a hopeful sign for improving return on equity in Canadian stocks, but the stock market is still heavily exposed to sectors facing structural headwinds, such as energy and financials.
We prefer the U.S. equity market for its greater exposure to secular growth sectors, like tech and healthcare. It has a higher share of quality companies in sectors that exhibit above-average return on equity and that are also backed by long-term growth trends such as tech and healthcare. A divided U.S. government may also benefit these same sectors as it likely takes corporate tax increases and big legislative changes off the table, in our view.