Canada’s housing bubble looks disturbingly familiar
On several key metrics, Canada’s housing market has far surpassed the U.S. at its peak

(Shutterstock)
Share
Last March, Canada’s unstoppable bull market in housing entered its eighth consecutive year since recovering from a brief downturn amid the global financial crisis. Even that contraction looks like a mere blip when viewed against the long-term trend. The country’s real estate market has been on a tear for nearly two decades, enriching homeowners, burdening new home-buyers with debt and alarming policymakers.
READ MORE: How Canada completely lost its mind over real estate
Here on the inside, it’s easy to become complacent and assume the current trends are normal, if not sustainable. But step back, and Canada’s monster housing market becomes all too apparent. One way to do that is to compare it to the United States. On a few key metrics, Canada has far surpassed the U.S. at its peak. As David Rosenberg, the chief economist at Gluskin Sheff told BNN Thursday, “This bubble is on par with what we had in the States back in ’05, ’06, ’07. We have to actually take a look at the situation. The housing market here is in a classic price bubble. If you don’t acknowledge that, you have your head in the sand.”

Such comparisons are only useful to a point, of course. Simply because the U.S. housing market crashed spectacularly doesn’t mean Canada is headed for a similar fate. (One further caveat: Vancouver and Toronto have a significant impact on the Canadian market as a whole.) Even so, there are plenty of reasons to be worried.
Home prices
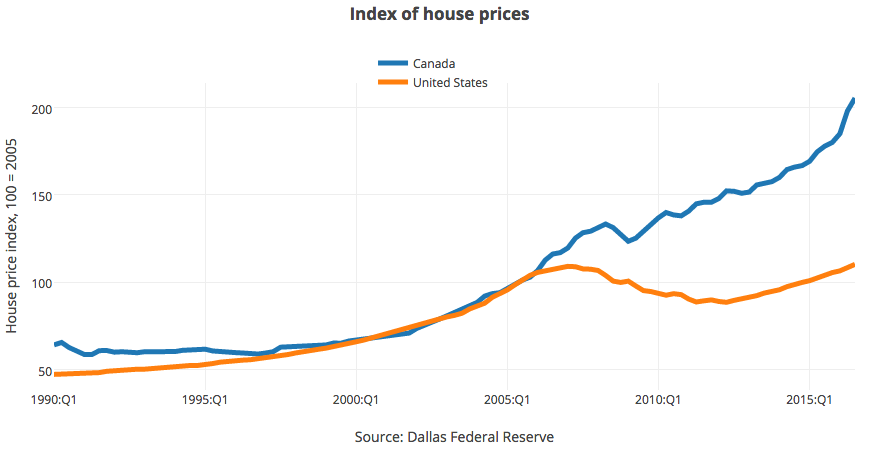
Canada’s boom is glaringly obvious from a quick look at home prices. The chart above is pulled from the International House Price Database provided by the Federal Reserve Bank of Dallas, which uses an index to take the pulse of markets around the world. Canada actually surpassed the U.S. back in 2006, a year before the subprime mortgage meltdown. Interestingly, that was the same year the Canada Mortgage and Housing Corporation started to insure mortgages with amortization periods of up to 40 years, and loans with zero down payment. That decision was reversed two years later.
The divergent path of each housing market is not surprising on its face: the recession in the U.S. was far more severe than in Canada. But Canada’s economy hasn’t exactly boomed over the past few years. Between 2010 and 2015, GDP growth averaged just over two per cent.
Affordability
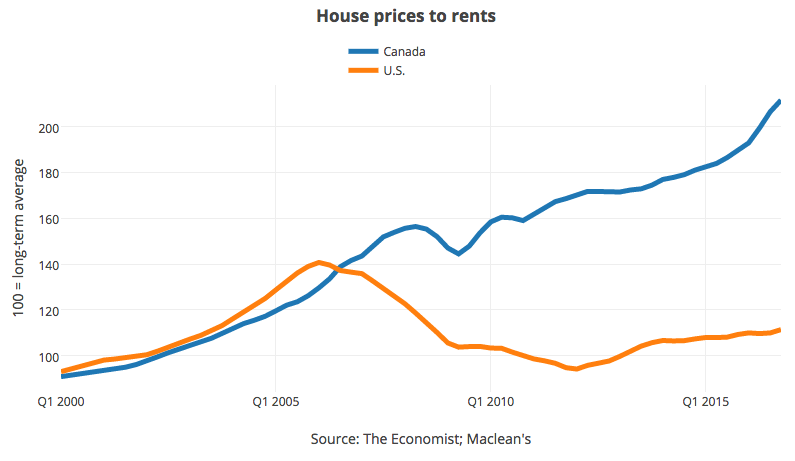
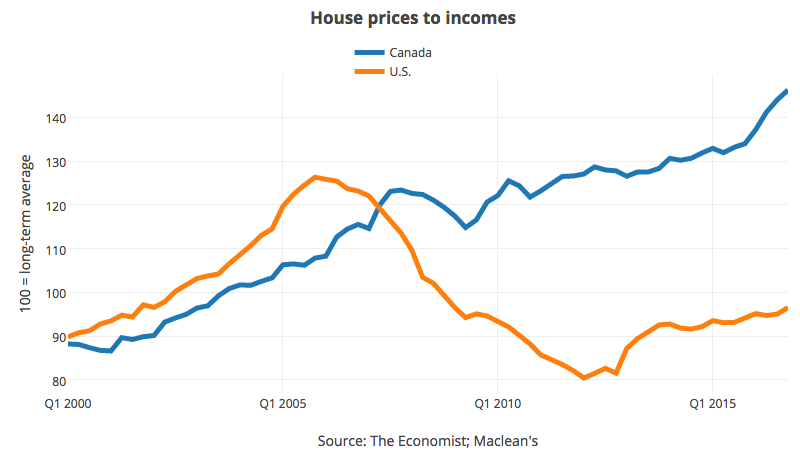
The Economist magazine measures housing affordability by comparing home prices to both incomes and rent. The higher the ratio, the less affordable the market. Canada is far beyond the U.S. peak on both counts . (Canada, according to the Economist, is “severely overpriced.”)
Talk to real estate agents, though, and some will argue the price-to-income ratio is misleading these days. Young home-buyers, who are generally new to the workforce, often get help from their parents, especially in pricey markets like Toronto and Vancouver. A recent survey commissioned by HSBC found 37 per cent of millennials turned to their parents for financial assistance to cover housing costs. That trend isn’t captured in the income data.
Still, should that provide assurance about the sustainability of the market? Only if incomes catch up down the road. Or if mom and dad are ready with their chequebooks to help their indebted children when interest rates—and mortgage payments—inevitably rise. The HSBC survey found that 21 per cent of millennials do exactly that when unexpected costs arise after purchasing a home.
Household debt to GDP
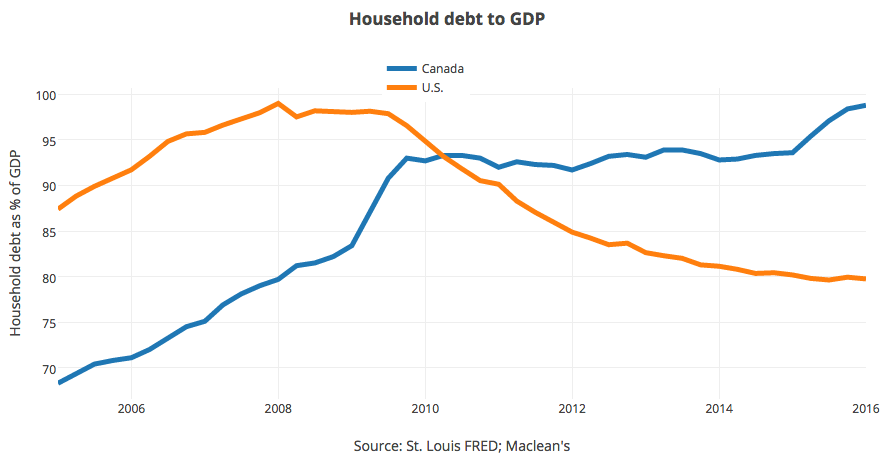
Low interest rates have helped fuel Canada’s housing boom. As a result, Canadian households are more indebted than their American counterparts relative to each country’s GDP. As countless economists and think tanks have warned over the past few years, elevated levels of debt leave Canadians vulnerable to economic shocks and rate increases.
U.S. households, meanwhile, went through a period of deleveraging after the financial crisis. But the trend is reversing. Last year, the total amount of household debt climbed at the fastest pace in more than a decade. The total amount is not far off from the all-time peak reached in 2008. This time, auto and student loans are fuelling the debt binge.
Debt service ratio
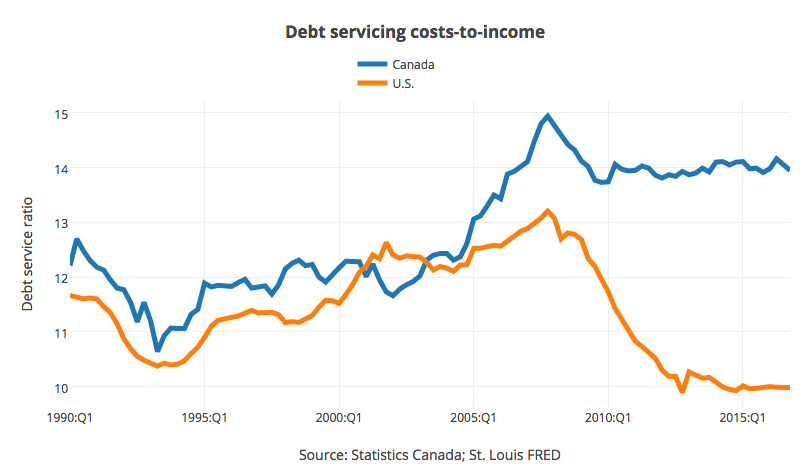
Given these trends, it’s not surprising that Canadians are spending a good chunk of their disposable income to service debt. The above chart measures both the principal and interest payments relative to income. Again, Canadians appear to be in a more precarious position.
Some economists caution that the composition of debt is an important distinction between Canadian and U.S. borrowers. The financial crisis was driven in large part by subprime mortgages—the kind of rotten debt we’re told is rare in Canada.
It’s true the U.S. doesn’t make for a perfect comparison, which is why a look at history is useful, too. Economists at the Bank of Montreal recently drilled down into mortgage payments as a percentage of income in Ontario, home to the country’s hottest real estate market. That figure is rising fast. BMO estimates that at this pace, mortgage payments as a percentage of income will hit 1989 levels within 24 months—the same year the Toronto real estate market crashed.
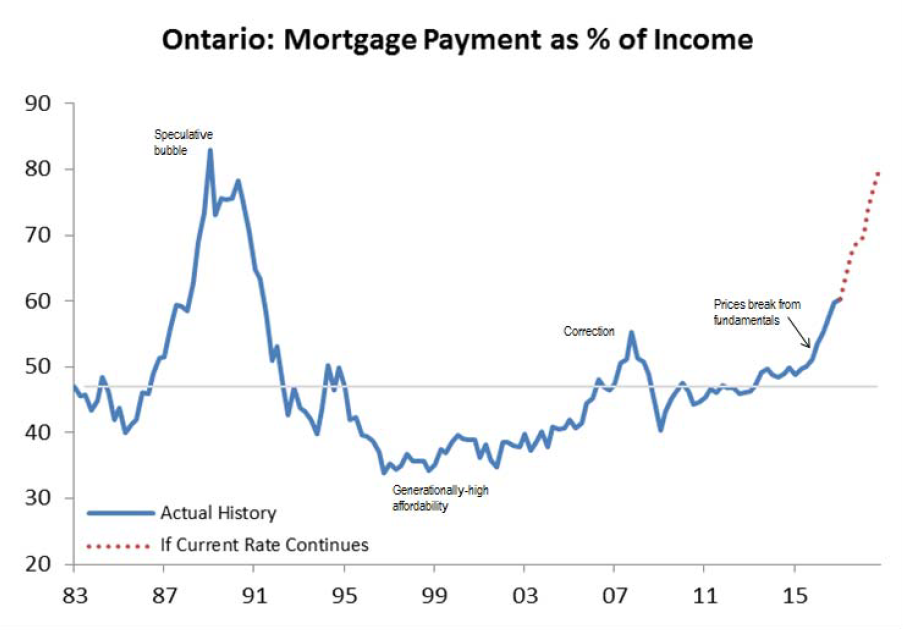
That doesn’t mean a severe correction will be triggered at that point, of course. But the more debt homeowners take on, the more painful a contraction will be.