This month in (U.S. oil production) history
The top songs, movies and news events from the last time U.S. oil production was so high
(Shutterstock)
Share

It’s difficult to wrap the mind around what is happening in America’s oil patch. The shale revolution, which almost no one anticipated a decade ago, has driven U.S. oil production to levels not seen in decades. That, along with several other global factors, is helping to drive global oil prices down. As of Oct. 10, the price for West Texas Intermediate crude has fallen more than 20 per cent from its June high to less than US$86 a barrel.
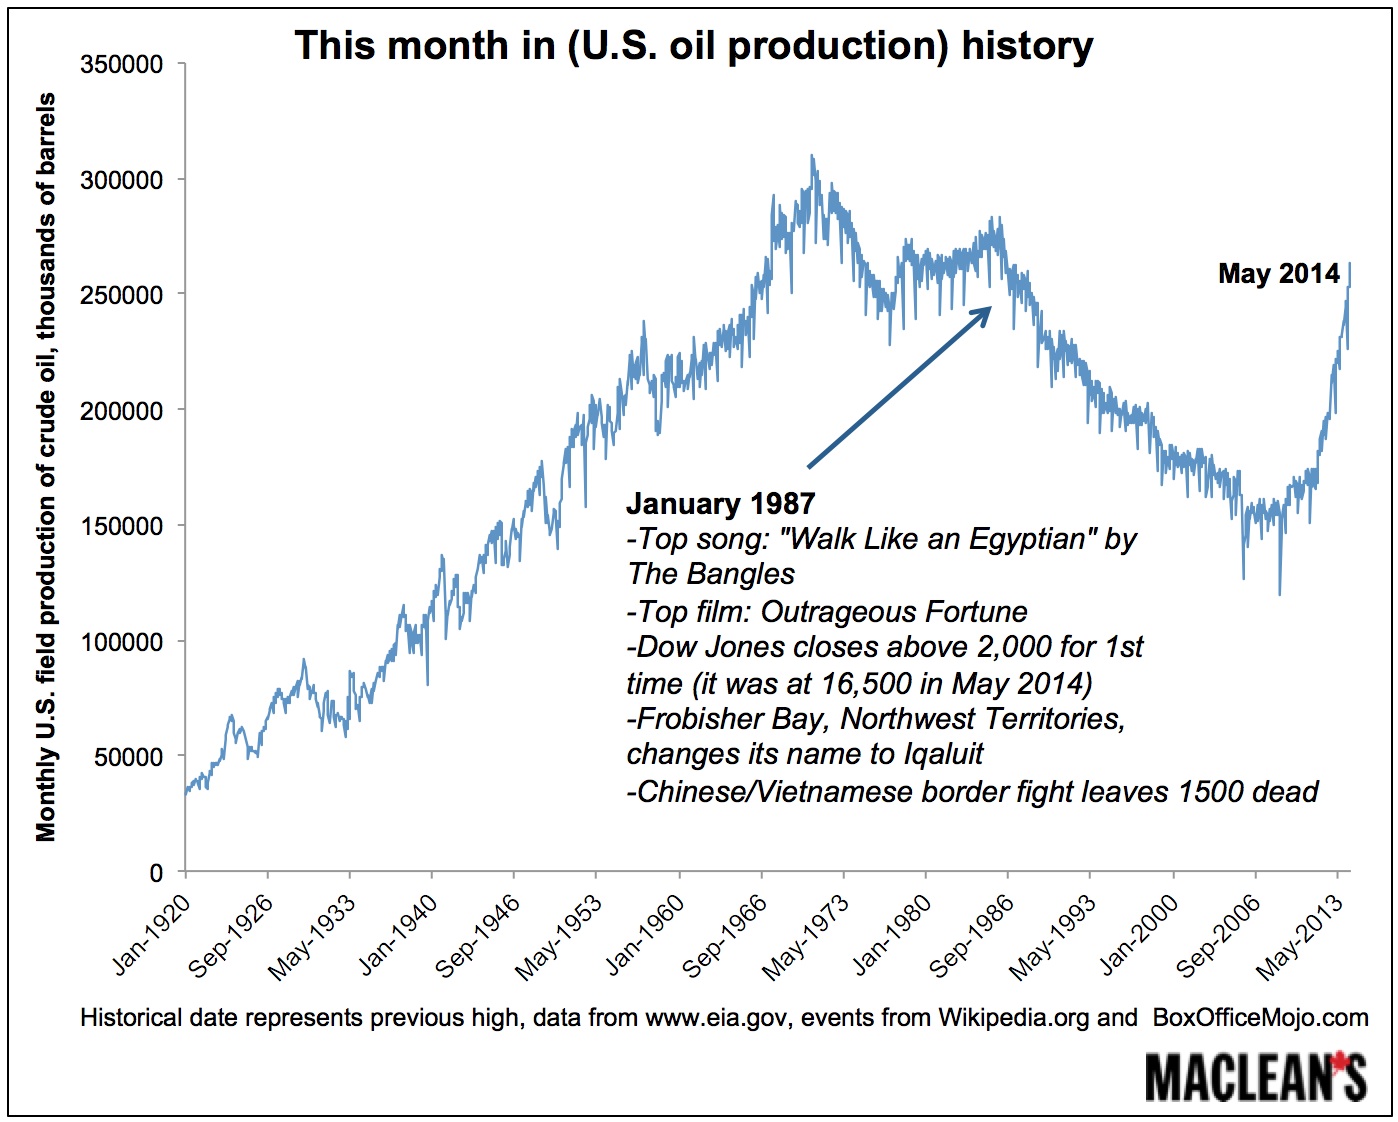
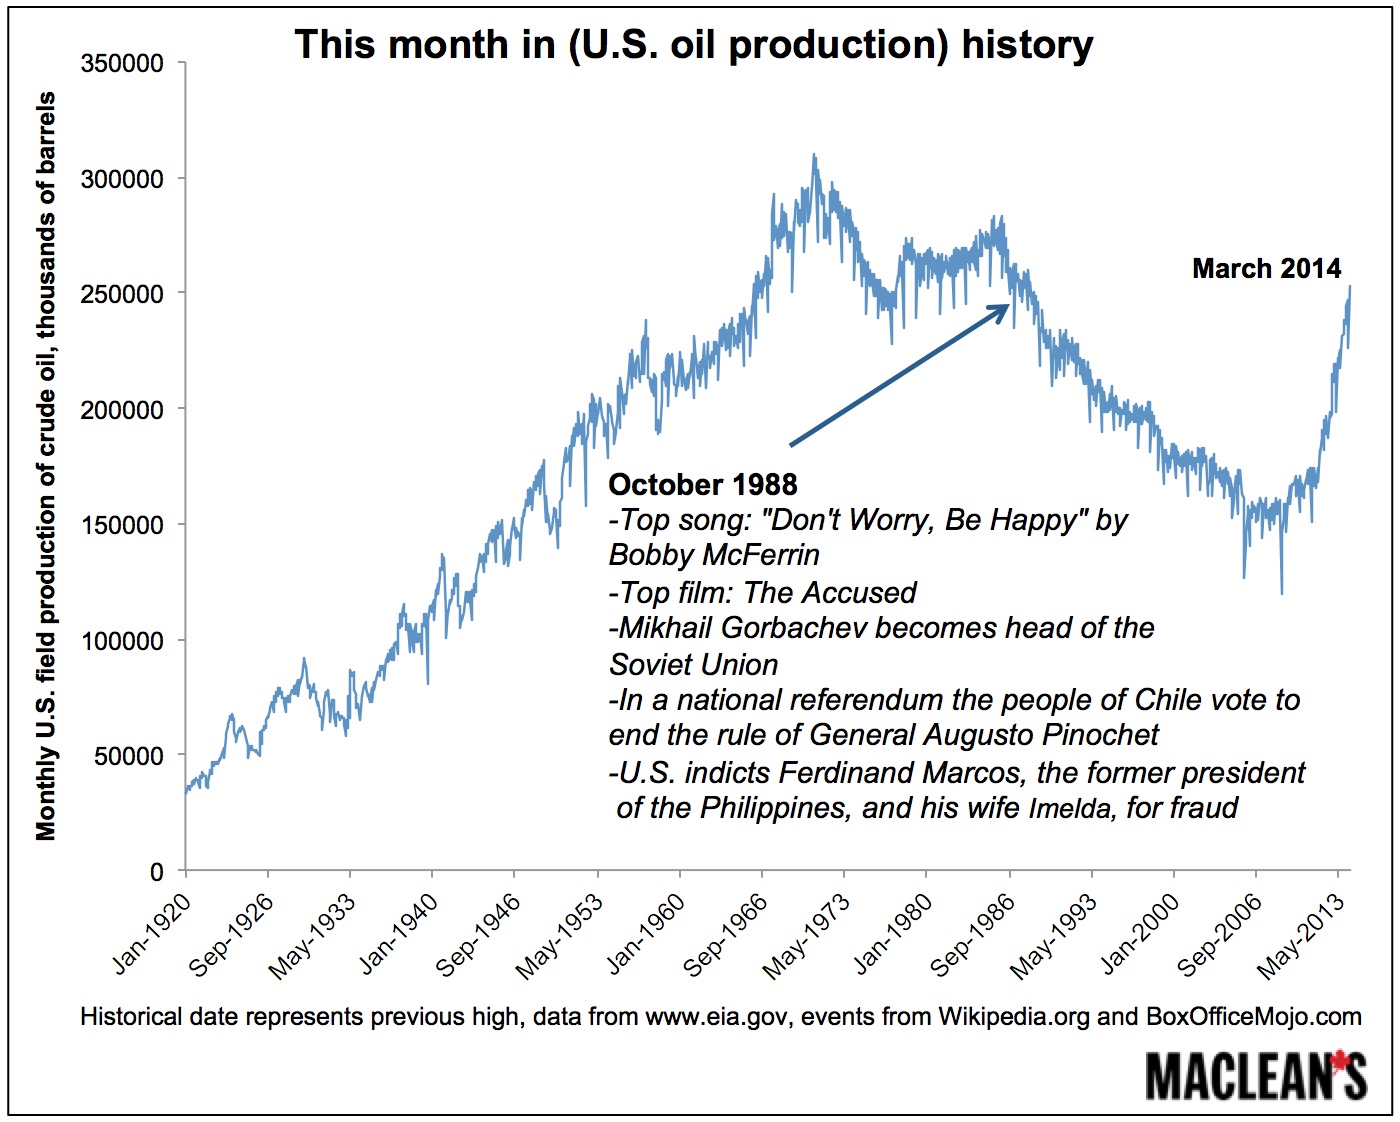
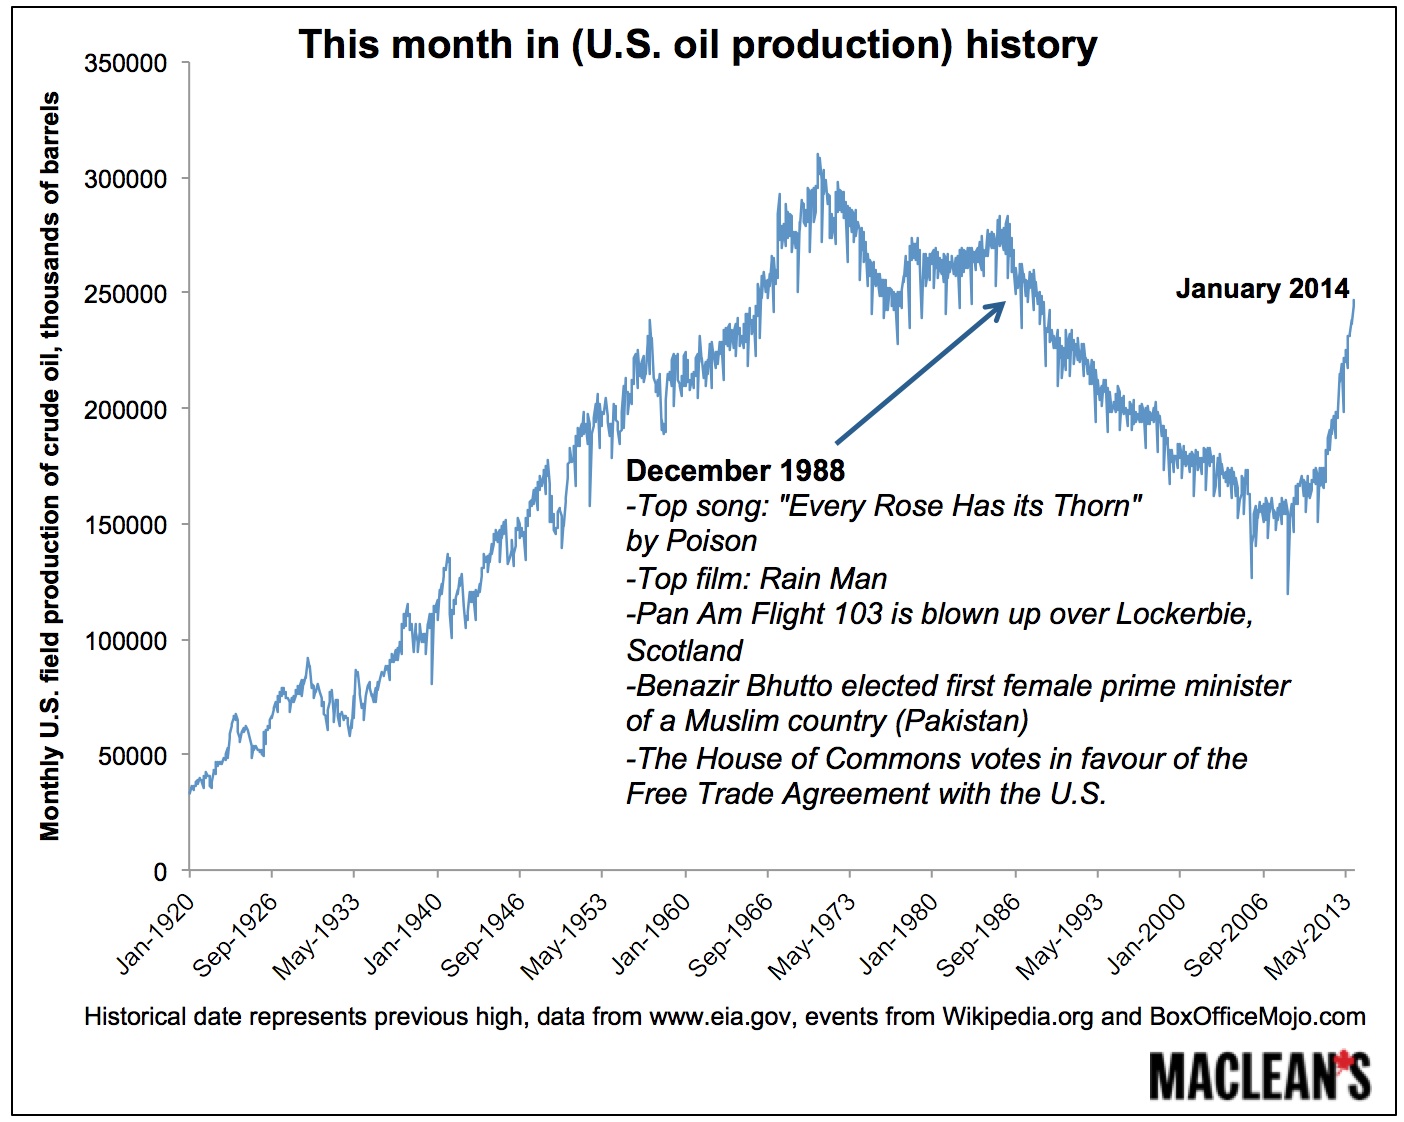
To put this surge in oil production into perspective, I’ve created this ongoing post—part oil boom tracker, part history lesson. Each month that U.S. oil output reaches a new high*, I’ll add to this page with a new oil history chart showing what was going on in the world the last time monthly production was at that level.
Here are a few to start things off, marking the three most recent months when production broke records. The latest milestone came in May, according to figures from the U.S. Energy Information Administration, when production exceeded the level it was at in January 1987.
*Note: Only production highs that break new records will be included. For instance, production in July, the most recent month for which figures are available, was higher than May, but not by enough to set a new record.