Uncovering the mystery of Statistics Canada’s disappearing jobs
Summer vacation wreaks havoc with our employment data
Share
By now most Canadians have probably heard about the Great July Jobs Mystery – the one in which Statistics Canada said the economy created just 200 new jobs last month, only to come out this week and say it was a big mistake. (Specifics are due out tomorrow.)
Statistics Canada releases reams of data on everything from beer consumption in Alberta, to mushroom farming in Ontario. However, its monthly employment data is one of the few numbers that have a crucial impact on the economy. The jobs numbers are widely used by both government and private industry. Global currency traders pushed the Canadian dollar down by half a cent on last week’s poor jobs report only to push it back up this week on news of the error. Ottawa has said it won’t process any new employment insurance claims until it gets the revised numbers— since EI eligibility is based on the local unemployment rate.
Given its importance to the country, how could such a grandiose mistake happen?
When Philip Cross, the former Statistics Canada chief economic analyst, saw the data he thought of two words: summer vacation. “When mistakes happen, they tend to happen in summer,” says Cross. “There’s less eyeballs and fingers pointing.”
Summer vacations also make it difficult to contact the Canadians who are interviewed for the jobs survey, since many of them are also away. “It corrupts your samples,” says Cross. “You phone somebody and they don’t answer because they’re on holiday. So what do you do? You just have fewer samples.”
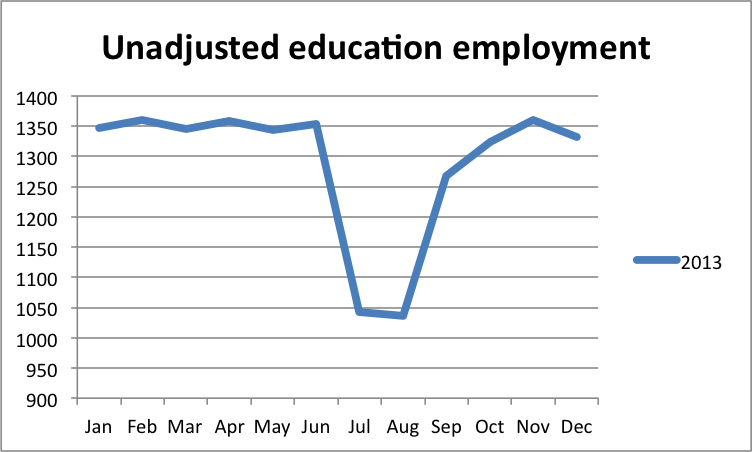
It’s not just vacations that make summer a statistical nightmare when it comes to employment data. July and August are months of pretty major change on the jobs front. High school and university students take on short-term summer jobs, or swap their part-time employment for full-time. In order to avoid dealing with the bureaucracy of vacation pay, many school boards officially lay off their teaching staff in the summer and then rehire them in September. In 2010, for instance, Stats Can reported that 68,000 teachers were laid off in July and retired in August. Construction workers have the opposite problem – their numbers tend to surge in the summer months and drop in the winter.
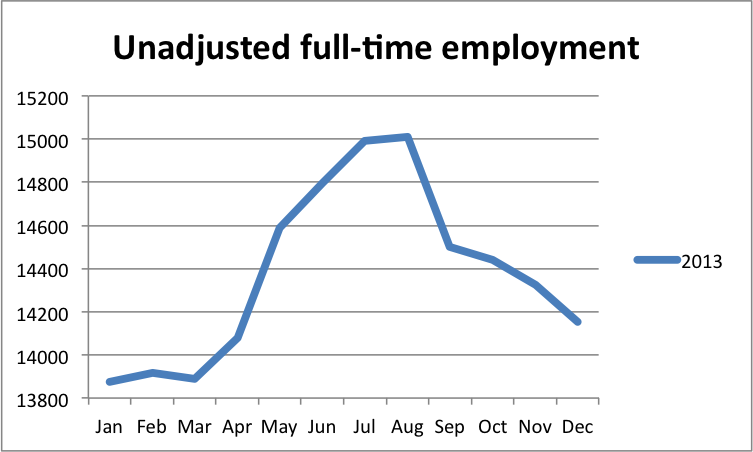
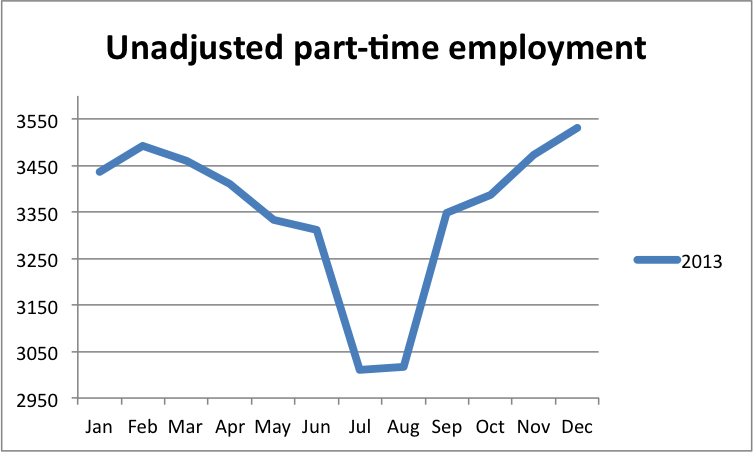
Statistics Canada updates its data to compensate for these predictable changes (which it calls a seasonal adjustment.) But a look at unadjusted data from previous years show just how drastically things can change in the summer.
Full-time versus part-time jobs:
Yet to fully understand just how this sort of mistake could happen it’s helpful to know how exactly Statistics Canada goes about collecting and crunching its highly influential jobs data.
Sylvie Michaud, the director-general of education, labour and income statistics, told The Globe and Mail that the error related to changes the agency was making as part of an update to the data that was planned for January of next year. So far, Statistics Canada has yet to reply to calls and e-mails from Maclean’s for clarification on exactly what went wrong. But here’s an educated guess:
To conduct the monthly Labour Force Survey surveyors go out and knock on the door of 56,000 Canadian homes, chosen from the latest census data, and quiz their inhabitants about their working lives. “For the first six months You go into the sample for six months, for the first month they like to sit in your living room and talk to you and get to know you,” says Cross. “After that you get to phone it in.”
The interviews take place during the same week of every month (usually starting after the 15th of the month). Methodologists then analyze the answers, comparing them to baseline data about the population and the job market in order to transform them into “representative” samples of the entire country. Their answers are “weighted” to make sure they accurately reflect where they live, their age and gender and their occupation and industry. (For example, if it turned out that too many people in the survey lived in Toronto, their answer might be given a lower weight so that they don’t end up skewing the results for the entire country.)
It’s here that there is the greatest room for error. In order to make sure that 56,000 people can accurately reflect the working lives of more than 34 million Canadians, researchers have to compare them against a baseline set of data about the Canadian population as a whole. Those numbers — local population counts, the number of people working in various industries, the number of workers in different age groups — are all taken from the census. The labour force survey happens once a month; the census is updated once every five years. So Stats Can researchers have to estimate the changes that are happening to population and the job market in those intervening years.
Even after the new census comes out, it takes time for Statistics Canada to update all of its statistical models and correct all its past data. The result is that it can take several years after the most recent census data is released for those numbers to make their way back into the employment data. The farther we get from the last census, the more Stats Can has to guess about what is happening. This year’s monthly job surveys use data that is based off the 2006 census. In other words, Statistics Canada is comparing the answers of 56,000 Canadians in July to a picture of what Canada looked like eight years ago and then guessing at how things have changed. That obviously leaves considerable room for error, particularly in parts of the country that have seen major population changes or in industries that are rapidly growing or shrinking.
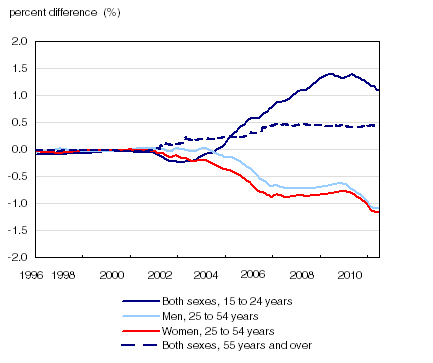
Here is Stat Can’s own chart of the gap between its estimates of the age of the Canadian population in 2010, which were based on the 2001 census data, and what the population actually looked like when it finally updated its numbers using the 2006 census:
According to Statistics Canada its internal estimates undercounted the number of young people aged 15-24 (the reason the line for that age groups go up over time is because Stats Can had to revise its data upward to reflect population growth.) It overestimated the number of working aged Canadians, meaning it had to adjust those figures downward.
Here is how the agency says the switch from 2001 to 2006 census affected its employment numbers in the provinces at the time:
In 2010, employment levels were revised downward by 1% or more for New Brunswick (-2.3%); British Columbia (-2.1%); Newfoundland and Labrador (-1.5%) and Prince Edward Island (-1.0%) while estimates for Alberta were revised upward, by 1.0%.
Statistics Canada does eventually go back through all of its past data and adjust it to reflect actual population changes, thereby making it more accurate. But that process takes time. In fact, that update was set to take place in January 2015, when all our national jobs numbers were set to be revised so that they would be based off of the 2011 census.
Chances are this is the same update that caused last month’s jobs errors. It is easy to see how someone who accidentally plugs in a series of monthly job counts into the wrong model – one that isn’t supposed to be used until January and which contains eight years worth of revised data — could make a mess of things.
Cross argues that such errors are few and far between and that Stats Can data has been gradually getting more accurate over the years. He points to former chief statistician Munir Sheikh, who quit in 2010 to protest the end of the mandatory long-form census, as someone who dramatically improved the rigour of the agency’s data verification process, including tying the error rate to job performance reviews. “He would start every meeting with ‘we’re making too many mistakes. We have to reduce them. This is unacceptable,’” says Cross. Those processes have continued to improve under the new chief statistician Wayne Smith.
The agency publishes reams of data, but its most prized divisions are those that produce what are arguably the three most important numbers in the country: the GDP (a measure of economic growth), the Consumer Price Index (a measure of inflation) and the Labour Force Survey. Those divisions were spared from budget cuts and Cross says the CPI division is actually on a hiring spree. Nor was the labour force survey affected by the Conservative government’s decision to swap the mandatory long-form census for a voluntary survey, since it’s based off of the short-form census, which is still mandatory.
Even so, the furor over Statistics Canada’s July numbers shows just how much our understanding of the job market is still, in many ways, a guessing game, subject to plenty of human error and assumption. That’s true of most of the data that’s collected by Statistics Canada. “There isn’t one major data point that over time I haven’t seen a mistake,” Cross says. “It’s a huge place. It processes a lot of data. It’s full of human beings and human beings make mistakes.”


