The most important Canadian economic charts to watch in 2020
Our sixth annual chartapalooza includes more than 80 charts from the experts on jobs, GDP, real estate, trade plus so much more
Share

It’s back. For the sixth straight year Maclean’s asked economists, analysts, investors and financial observers to each select a chart about Canada’s economy they feel will be particularly important to watch in 2020 and in their own words, explain why.
As in past years, certain themes emerge in this year’s chart collection. The stability of Canada’s housing market and the dangerous levels of household debt remain an obvious concern, even if there’s less focus now on rising interest rates. Canada’s weak climate for business investment and the risk from global trade tensions are also top of mind among the experts. So too are environmental and energy issues. You’ll also find charts on how Canadians live, work and shop, how Canada’s waning competitiveness is holding the economy back, and even how a deficit of amorousness could lead to a slowdown down the road.
So thank you to everyone who took the time to contribute a chart this year.
Share your thoughts with the hashtag #Chartapalooza and as always, enjoy.
- Business
- Economic cycle
- Energy and the environment
- Government finances
- Households and demographics
- Housing market
- Inequality
- Jobs and incomes
- Markets, monetary policy and currency
- Trade and competitiveness
Business
Falling business investment a bad sign for productivity growth
David Wolf, portfolio manager, Fidelity Investments
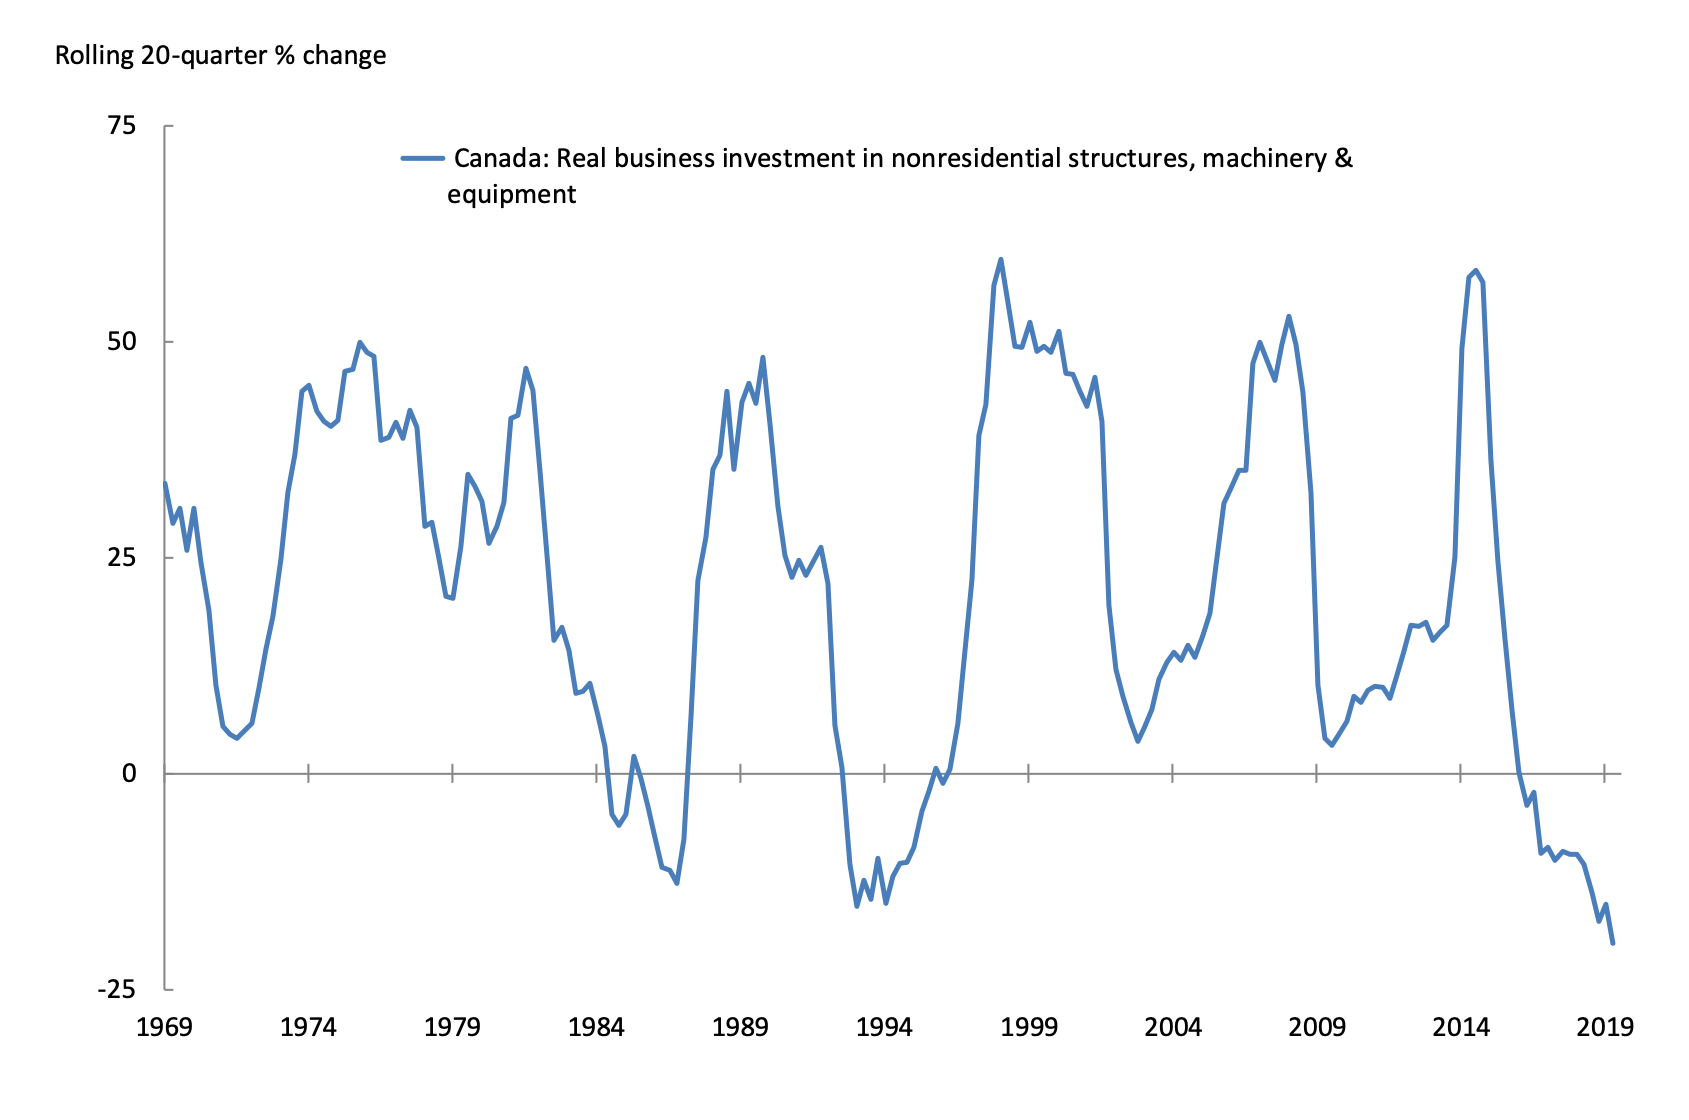
Investment in plant and equipment by Canadian businesses has dropped 20 per cent over the past five years, the worst performance in more than five decades. And despite the emergence of some high-profile tech clusters, total Canadian investment in intellectual property products has also fallen outright. This bodes ill for Canada’s already-anemic productivity growth, and leaves the economy ever more reliant on continued inflows of people and money to sustain growth.
Canadian factories more sensitive to wage inflation
Benjamin Tal, deputy chief economist, CIBC World Markets
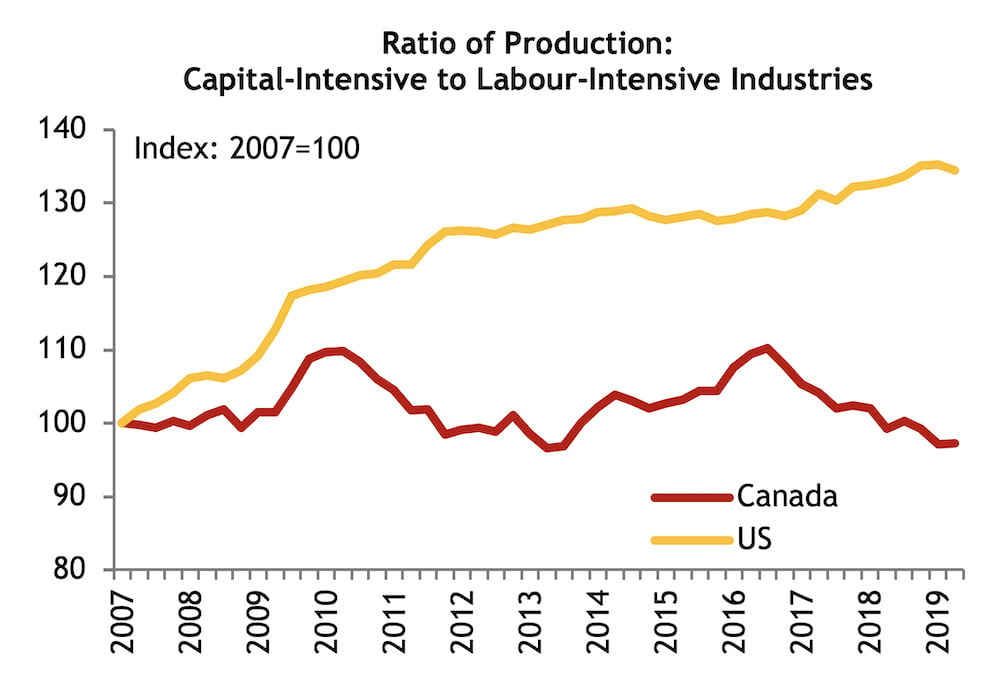
Tight labour markets in both the U.S. and Canada are finally seeing some acceleration in wage inflation. The negative impact on profitability in the manufacturing sector, however, will be felt more in Canada. Since the Great Recession more than three-quarters of the improvement in U.S. manufacturing activity has been in capital-intensive industries, such as transportation, computers and electronics, primary metals and machinery, rather than labour-intensive industries. The situation in Canada is very different. The recovery was more evenly distributed, as some increase in capital-intensive activity earlier in the decade was offset, more recently, by activity dominated by labour intensive industries, such as fabricated metal products, miscellaneous manufacturing, plastic and rubber. As a result the ratio of production in capital-intensive industries to non-capital-intensive industries in Canada is below the level it was at before the recession, while in the U.S. it is 30 per cent above that level.
The increased reliance of U.S. manufacturing on capital, in an environment of falling capital costs and rising labour costs, might work to shield profitably at the margin. The opposite, of course, is the case for Canada. The current acceleration in wage inflation will probably work to squeeze manufacturing profit margins relative to the US—another reason why we believe a weaker Canadian dollar is needed.
Foreign direct investment in Canada is recovering
Erik Hertzberg, financial journalist, Bloomberg, @ErikHertzberg
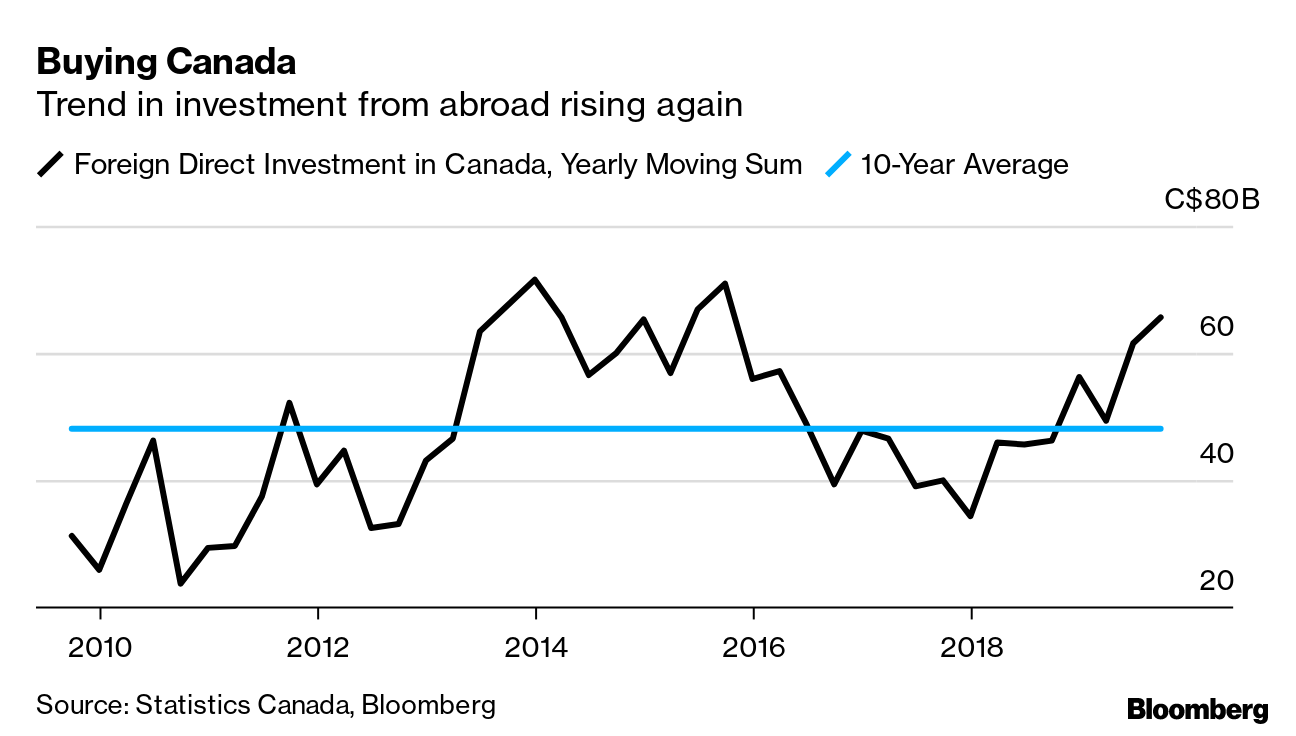
Foreign direct investment is flowing into Canada at levels not seen since oil prices collapsed, a welcome development following years of weakness in the energy sector. Over the past twelve months, capital inflows from abroad totaled $65.8 billion, led by the manufacturing sector and services, according to Statistics Canada.
Broader business investment remains sluggish however, down nearly a fifth since 2014. Until global uncertainty and trade tensions abate, Canadian firms are unlikely to make major capital expenditures, but at least foreign interest in the country is recovering.
Back to 2008 for business investment
Jock Finlayson, executive vice president, and David Williams, vice president of policy, Business Council of B.C.
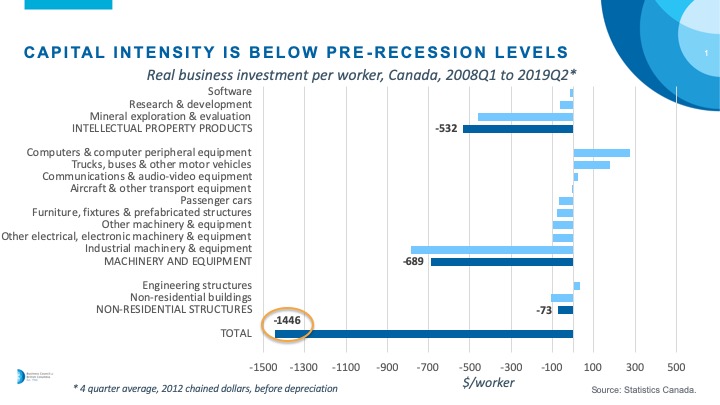
Sluggish business investment is a key factor behind Canada’s feeble gains in real GDP per person. This chart shows that real business investment per worker in mid-2019 was noticeably below the levels recorded in early 2008 across most categories of investment, including machinery and equipment and intellectual property products. Simply put, Canadian firms aren’t investing enough in the things that make both employees and the overall economy more productive.
Canada’s corporate debt binge
Ben Rabidoux, president of North Cove Advisors Inc. Twitter:@BenRabidoux
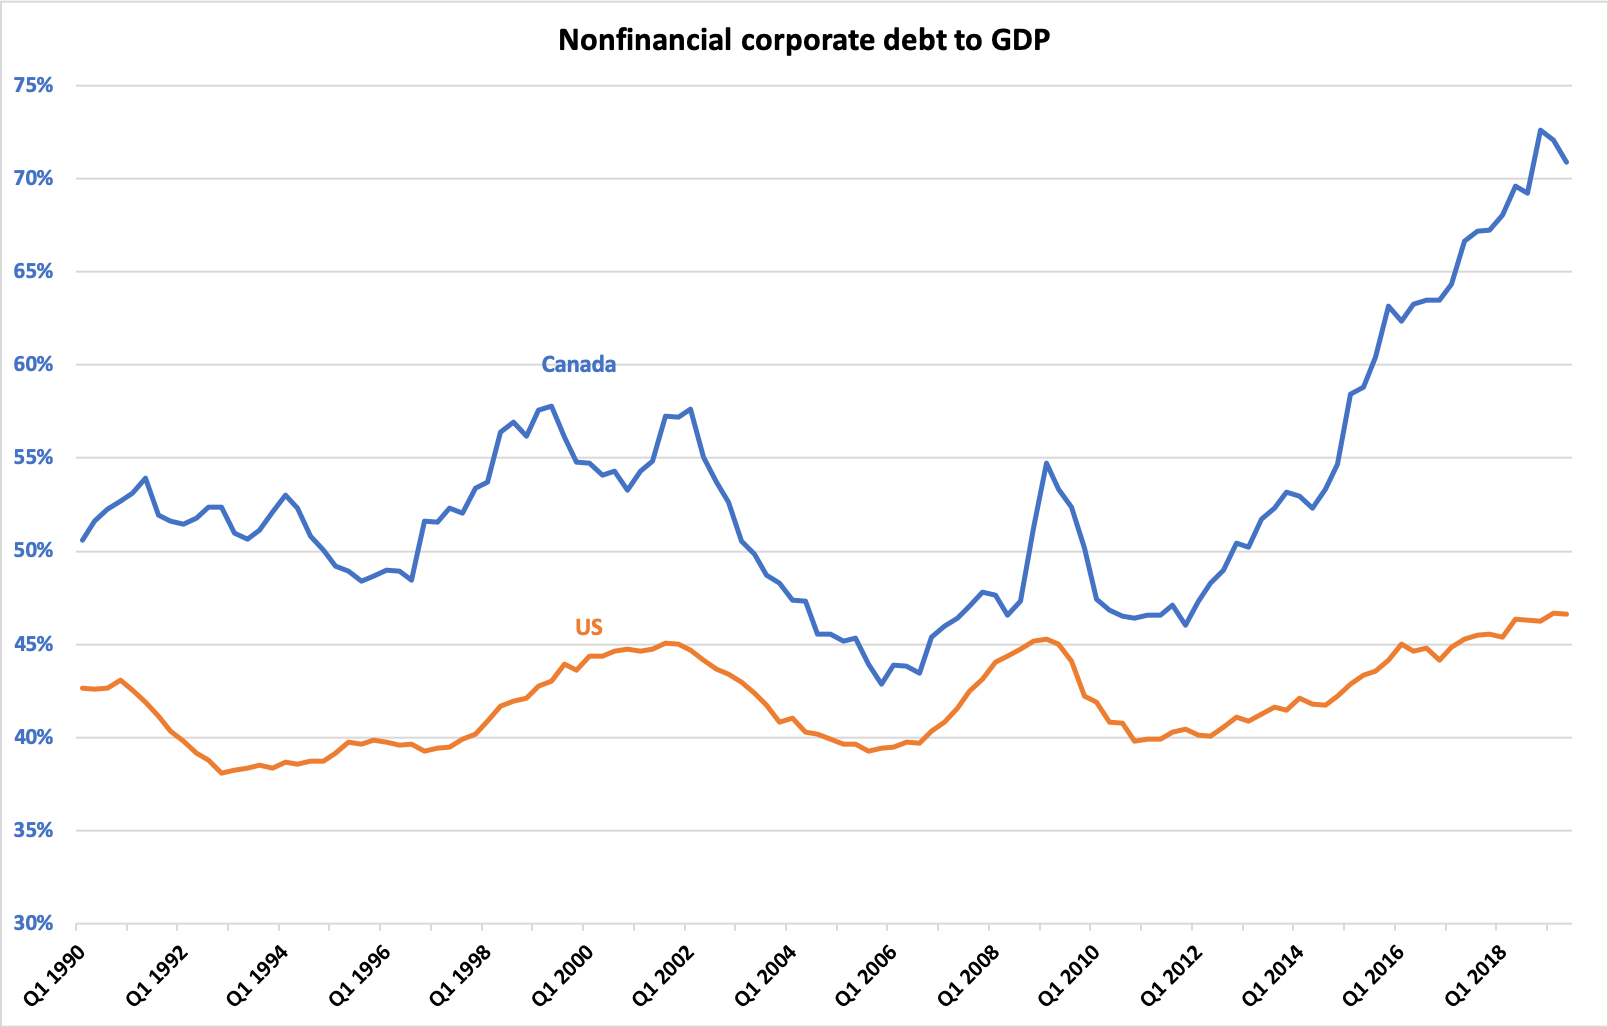
Policy makers continue to keep a watchful eye on household debt levels, and rightfully so. The share of disposable income required to service debt levels is at 30-year highs while interest payments are rising 4x the rate of disposable income growth. It’s no wonder that consumer insolvencies are up eight per cent year-over-year so far in 2019 in spite of a labour market that by most measures is as strong as it’s ever been. But while all eyes have been on household balance sheets, Canadian corporations have quietly been undertaking their own borrowing binge. Non-financial sector corporate debt now sits at 71 per cent of GDP. That level stands 18 points above long-term averages and makes the U.S level of 48 per cent look pedestrian by comparison. In fact, over the past five years, the rate of growth in this ratio in Canada has more than tripled the G20 average. The Bank of Canada recently warned that, “resiliency of the Canadian economy will be increasingly tested”, which makes rising corporate debt burdens one more thing for policy makers to keep tabs on.
Canada’s bloated inventories
Derek Holt, head of Capital Markets Economics at Scotiabank
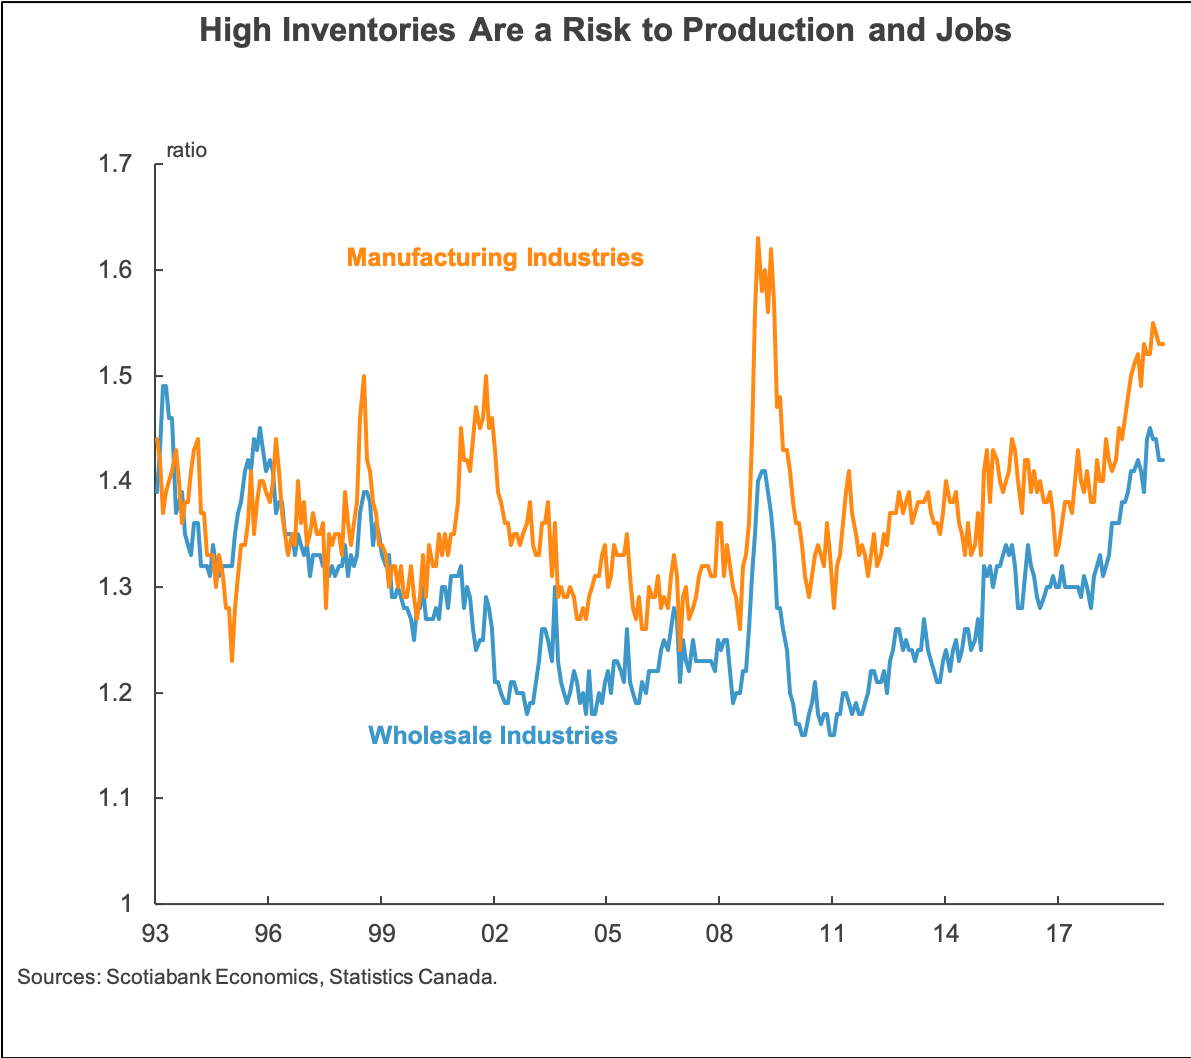
Canada has a large overhang of unsold goods in key parts of the economy that is near levels last seen in the 2009 recession. Continent-wide supply chains were hit by Trump’s trade wars and now we have to deal with the aftermath even if trade peace is partially achieved. Excess inventories will have to be sold down since they are costly to finance and store. That is likely to mean softening production and hiring into 2020 and possibly weaker inflation. What looked like a jobs miracle with inflation on the two per cent target in 2019 could quickly fade along with wage growth in part due to the inventory problem. Combining easier monetary policy through our forecast for rate cuts with fiscal policy stimulus would offer downside protection to this and other risks. Will Ottawa act in time?
An untapped supply
JP Gladu, President & CEO, Canadian Council for Aboriginal Business (@jp_gladu)
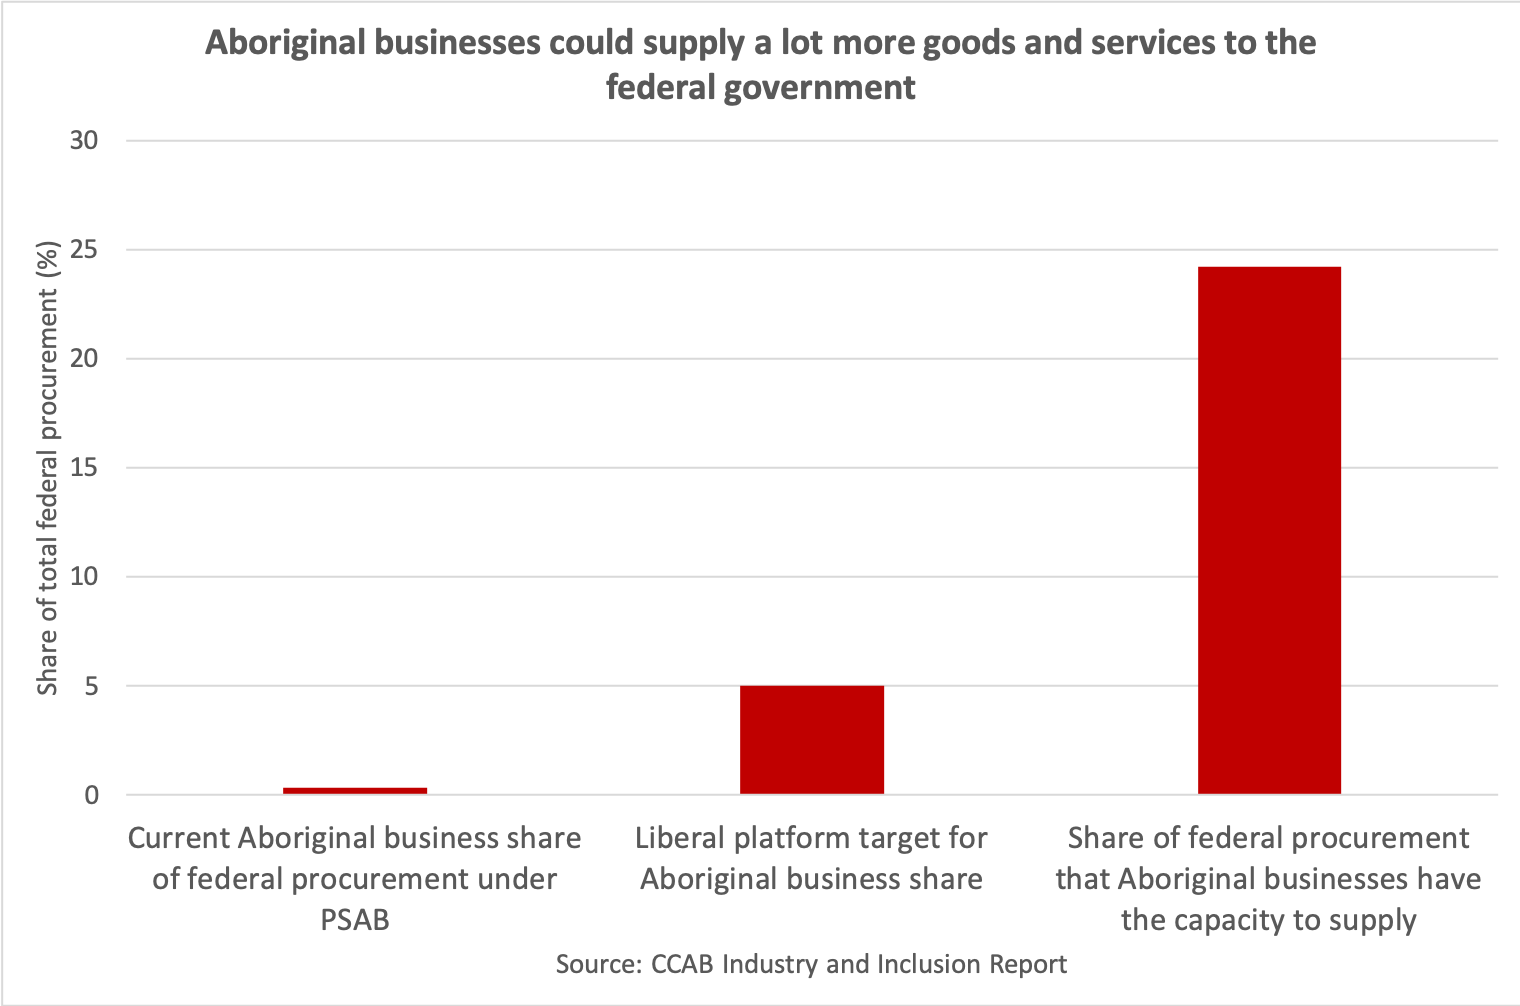
There are over 50,000 Aboriginal businesses in Canada operating in every sector, size and region. In 2016, the Indigenous economy contributed over $31 billion to Canada’s GDP with about $12 billion of that coming from Indigenous entrepreneurs and those numbers are growing. Each year the federal government spends on average roughly $60–$100 million procuring goods and services from Aboriginal businesses. Under one per cent (0.32 per cent) of total federal government spend was through the Procurement Strategy for Aboriginal Business (PSAB) program. A realistic and more than achievable five per cent Aboriginal procurement spending target was a Liberal party platform promise in the recent election. With the federal government committing to five per cent Indigenous procurement, over $1 billion dollars will go into the Indigenous economy. An overlap analysis conducted by CCAB found that Aboriginal businesses have the capacity to supply 24 per cent of the goods and services purchased by the federal government annually. Full Indigenous participation in government supply chains, and all supply chains, strengthens the Indigenous economy and a strong Indigenous economy means a stronger Canadian economy.
Decline in business investment is pulling down growth
Trevin Stratton, chief economist, Canadian Chamber of Commerce, @TrevinStratton
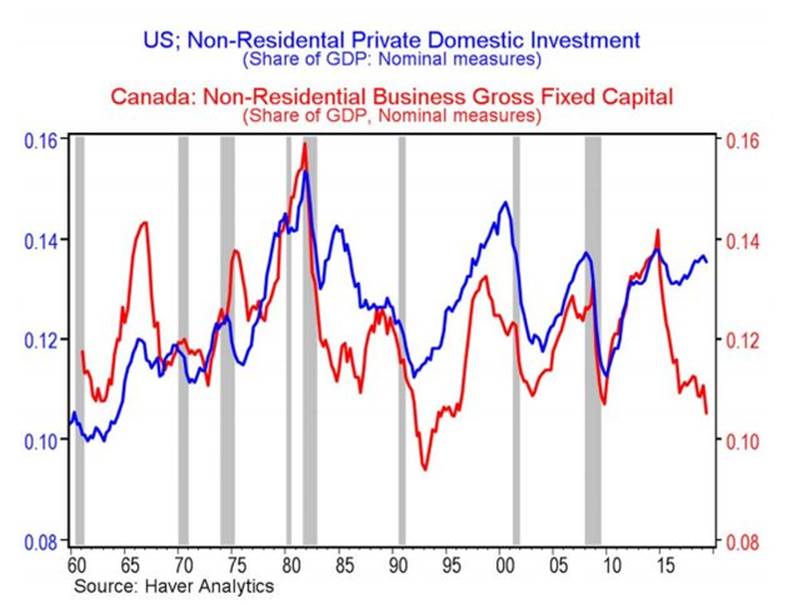
Canadian economic growth has been pulled down by an outright decline in business investment the past few years and this year is no different. Our 2019 growth drivers are consumption (0.9 percentage points), government spending (0.4) and net exports (0.6), while business investment is projected to be a net -0.4 percentage point drag on real GDP. This is particularly concerning since our already flagging productivity levels have been diverging from other countries, such as the United States, in recent years because businesses have not been provided with the incentives and certainty to invest in the technologies and skills that help national economies compete. Some of this uncertainty is out of our control, such as geopolitical instability and global trade tensions. But many of our challenges are of our own making, such as our broken regulatory system, inter-provincial trade barriers, and a cumbersome and antiquated tax system. All these factors increase the cost and ease of doing business in this country. This is why the business community has been so focused on competitiveness of late – we urgently need to improve the Canadian investment environment. If we can fix this, then our economy would be operating near its growth potential.
Canada’s manufacturing held back by weak demand
Arlene Kish, IHS Markit Economics

Canada’s manufacturing industry is languishing. Only a few provinces are making any kind of notable advances. Quebec’s manufacturing industry is toiling successfully, keeping total manufacturing afloat. Challenges abound in many provinces, that have resulted in manufacturing shutdowns or layoffs, resulting in lower manufacturing capacity. Recently, manufacturing new orders have failed to get any traction, putting downside risks to manufacturing activity heading into 2020. As such, there is more downward pressure on Canada’s industrial production outlook which is already facing significant headwinds from soft commodity prices, lower oil and gas extraction output and cutbacks in mining activity. After stalling in 2019, industrial production is expected to advance around one per cent in 2020, which is far below the 2017 and 2018 gains. Regional real GDP growth expectations have been downgraded for 2020 as Canada’s economy grows at a muted and decelerating rate of 1.3 per cent. Don’t expect much support to come from the goods-producing industries.
B.C. softwood lumber production cut down
Joel Wood, associate professor, School of Business and Economics, Thompson Rivers University, @JoelWWood
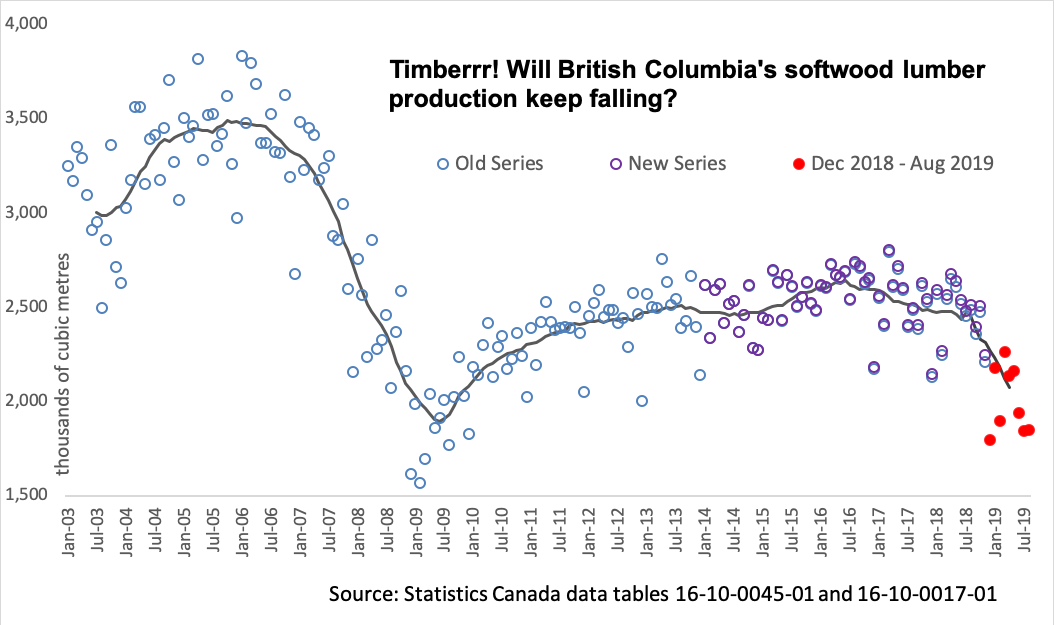
After record highs in 2018, lumber prices in 2019 have returned to levels consistent with long run averages. Meanwhile, B.C.’s timber supply has been affected by repeated years of forest fires. These conditions have contributed to reduced lumber production and several permanent mill closures this summer in B.C.’s interior. With global economic conditions potentially worsening, I am watching to see if lumber production continues to drop to the levels experienced in 2009. Forestry is not a large share of Canada’s economy, but the resulting transition is causing difficult times in many of B.C.’s small, forestry dependent communities.
What will it take to fill the investment gap in Canada?
Pierre Cléroux, chief economist, Business Development Bank of Canada. Twitter: @PierreCleroux
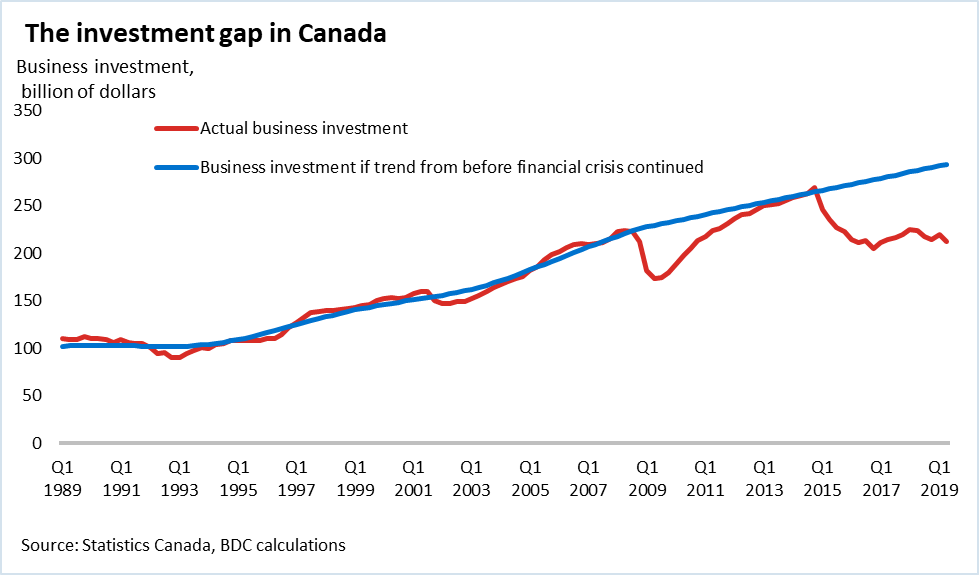
Business investment in Canada has been in a slump since the 2014 collapse in oil prices. Investment had been on track to return to its long-term trend following the financial crisis before suffering a sharp drop in 2015. Five years later, it’s still depressed and has even worsened in the last two years.
To encourage investment, especially after U.S. corporate tax cuts, Canada allowed businesses to write off capital investments quicker. However, this measure apparently wasn’t enough to offset the impact of macroeconomic conditions. Uncertainty has been weighing on business investment this year and we expect it to continue to do so in the coming year. Indeed, a BDC survey of 1,000 entrepreneurs found that only a small portion are planning to increase their investment spending in 2020 compared to 2019.
Business investment is critically important for the economy. It contributes to higher labour productivity, operational efficiency and growth. Since private investment remains subdued, so too does Canada’s growth potential.
Canada is still too dependent on the energy sector
Hilliard Macbeth, author and portfolio manager, @hmacbe
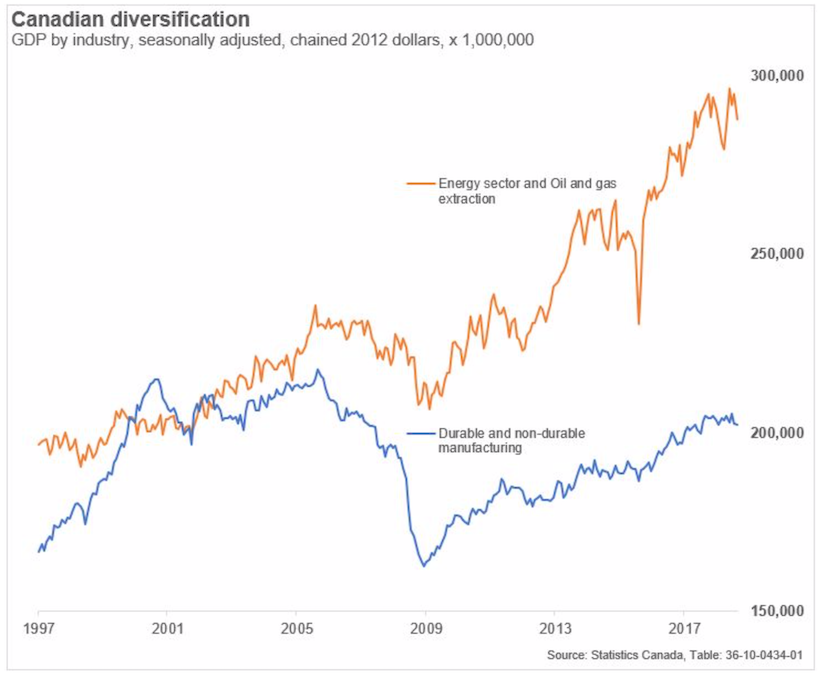
Canada, like a few other countries that enjoy substantial resource income, suffers from “Dutch disease”. That label describes a country that enjoys the income from selling non-renewable resources but is hurt by the side effects of that activity, such as elevated currency valuation, inflated costs and atrophy of other important industries, such as manufacturing. The term Dutch Disease was coined by “The Economist” in 1977 to describe the poor performance of the Dutch economy after a major natural gas discovery in 1959, called the Groningen field. The profits from natural gas pushed the Dutch currency higher and generated inflation, hurting the competitiveness of Holland’s export sector.
Heated arguments over Canada’s “Dutch Disease” status occurred when oil prices were much higher than today. Mark Carney, former Governor of the Bank of Canada, dismissed the idea that Canada’s wealth from the commodity boom was a curse. In a 2012 speech, Carney argued that higher income from oil sands development, natural gas and other non-renewable resources outweighed any negative effects on the manufacturing sector and Canada’s competitiveness. “Higher commodity prices are unambiguously good,” he said. Today it looks like this view was too complacent. Canada’s dependence on the energy sector is dangerous. Canada needs to restore balance.
Economic cycle
Alberta’s Double-Dip Recession?
Trevor Tombe, associate professor of economics, University of Calgary and research fellow at The School of Public Policy (@trevortombe)
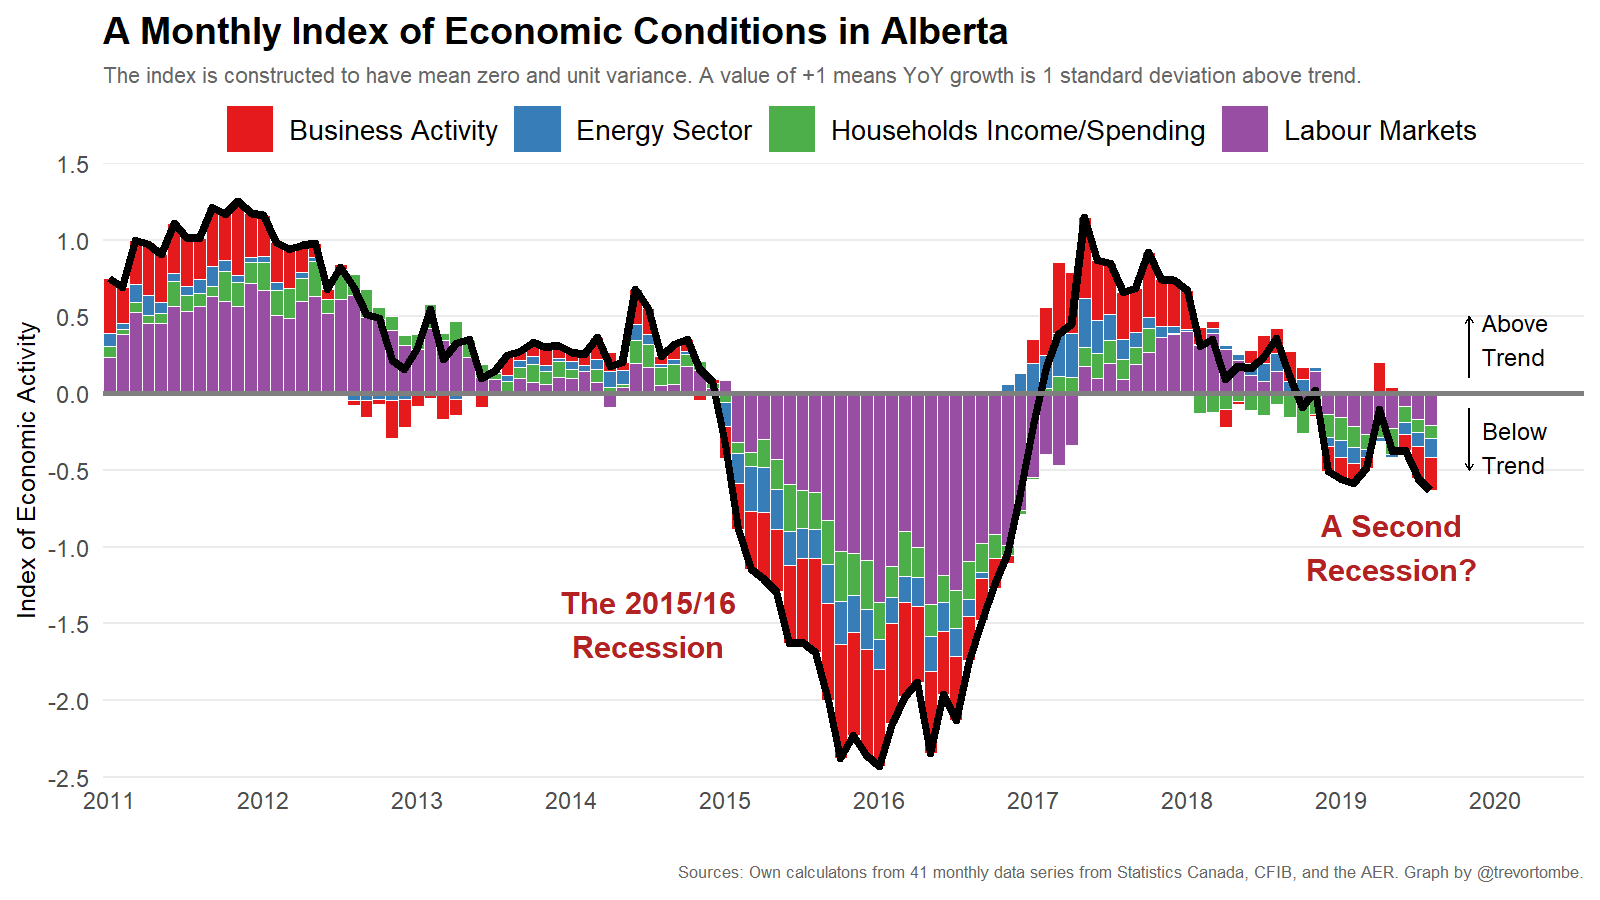
Oil producing provinces have faced a difficult five years. Low oil prices cut into revenue, investment, employment, wages, and overall economic activity. Government budgets are increasingly strained, unemployment is stubbornly high, social assistance enrolment is at record highs, and the end is not yet in sight. In fact, a second recession might (just might) be in Alberta’s future. As this graph illustrates, my index of monthly economic activity in Alberta has been negative for most of 2019 – signalling a possibly contracting Alberta economy. A worsening economy in Alberta affects employment and growth throughout Canada, but the ripples go far beyond the dollars and cents. Rising frustration and disappointment are increasingly directed at perceived failures of the federal government and Alberta politicians are happy to oblige. A second recession may exacerbate these tensions and further strain Canada’s confederation. For these reasons, and more, this indicator will be one to watch in 2020.
GDP per capita shows Canada’s lost decade
Martin Pelletier, portfolio manager, TriVest Wealth Counsel, @MPelletierCIO
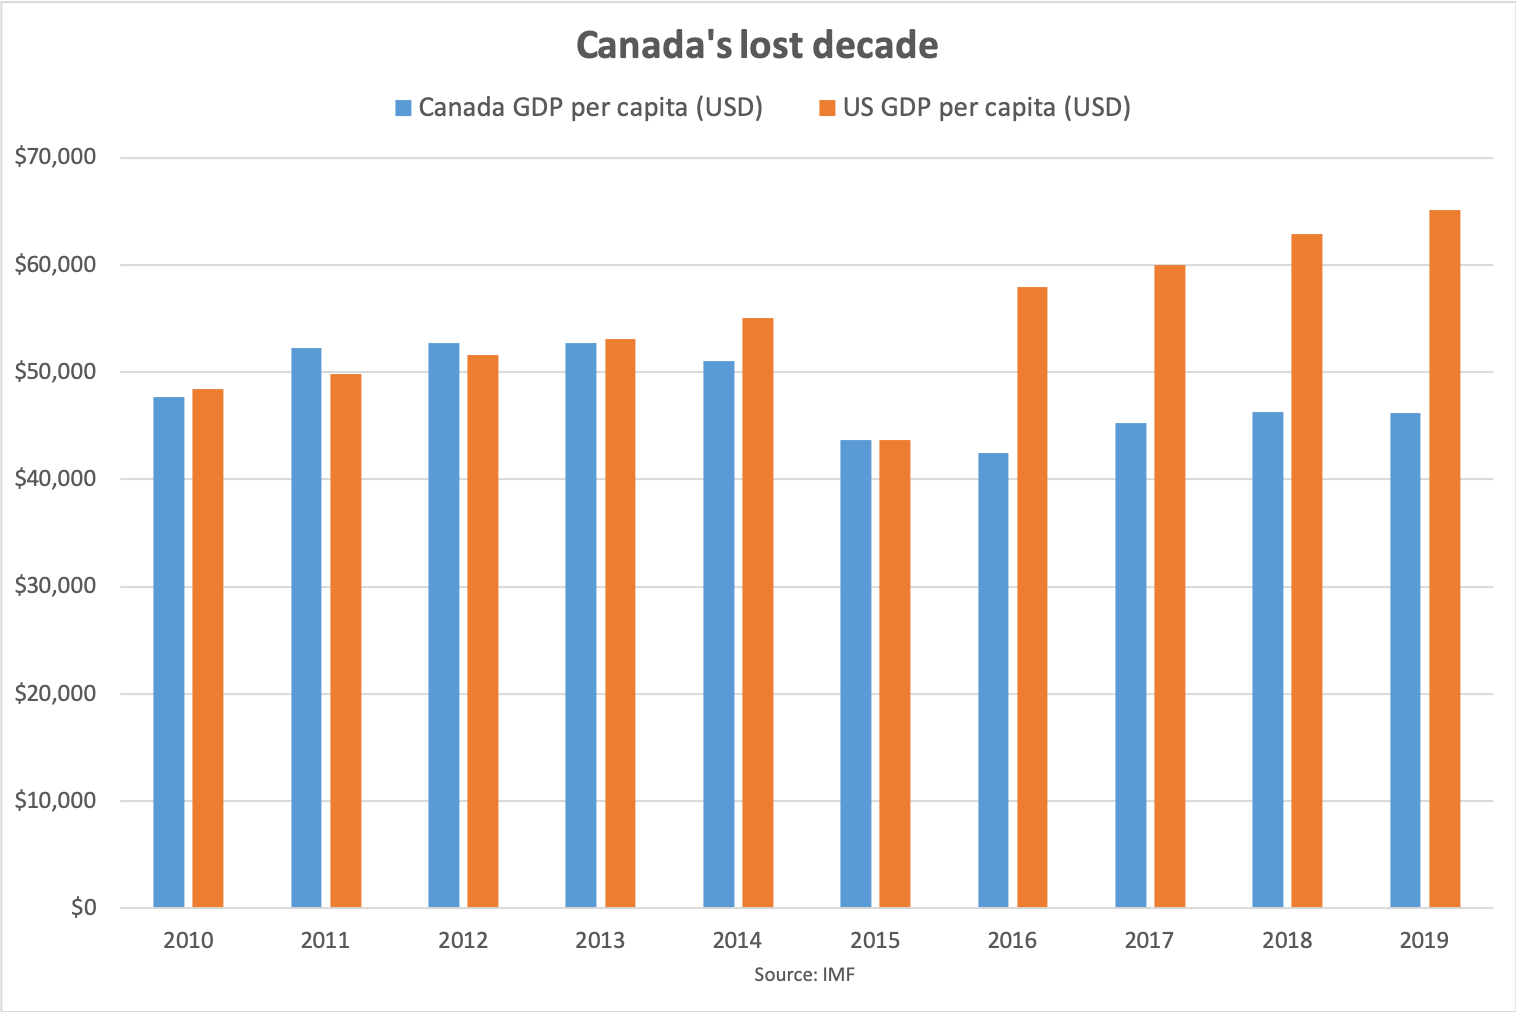
Canada has a serious growth problem that few realize thanks to a sense of complacency being fostered by the ongoing residential real estate boom in key regions of the country. As a result, the situation in Alberta and Saskatchewan has been allowed to worsen thinking it is an isolated problem when in fact it is impacting the entire country.
Fast forward and here we are with GDP per Capita actually 3 per cent lower than 2010 levels while our neighbours to the south have experienced a 35 per cent increase over the same period.
Unfortunately, it may take a real estate contraction for the rest of the country to finally wake up and start addressing our overall economic situation. However, housing speculation is still rampant further creating a false sense of security while doing absolutely nothing to the economic benefit of all Canadians.
Therefore, this is our chart of 2020. One that we hope catches the attention of those driving fiscal and monetary policy.
The leading edge of a global slowdown
David Rosenberg, chief economist and strategist, Gluskin Sheff, @EconguyRosie
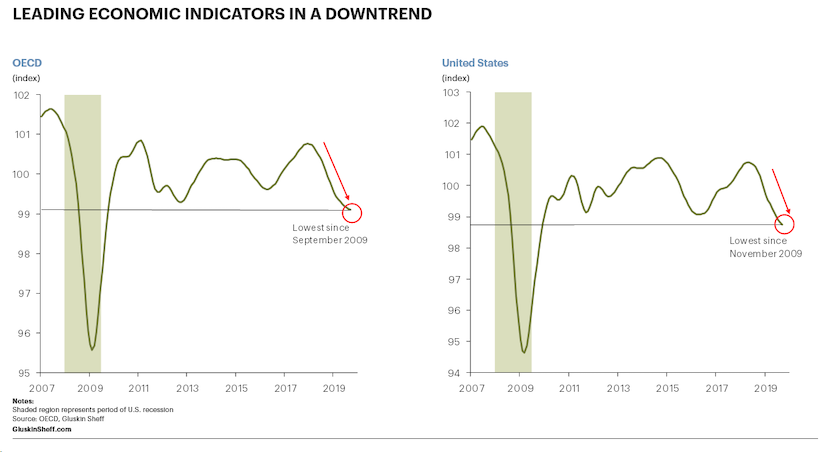
The OECD leading indicator has declined now for 21 consecutive months to a ten-year low. If you are bullish on risk-assets, have a different reason than a constructive outlook for the economy — liquidity, momentum, or sentiment. The fundamental macro outlook is clouded in 2020 to say the least.
Flatlining GDP per capita
Stephen Punwasi, co-founder of Better Dwelling, @StephenPunwasi
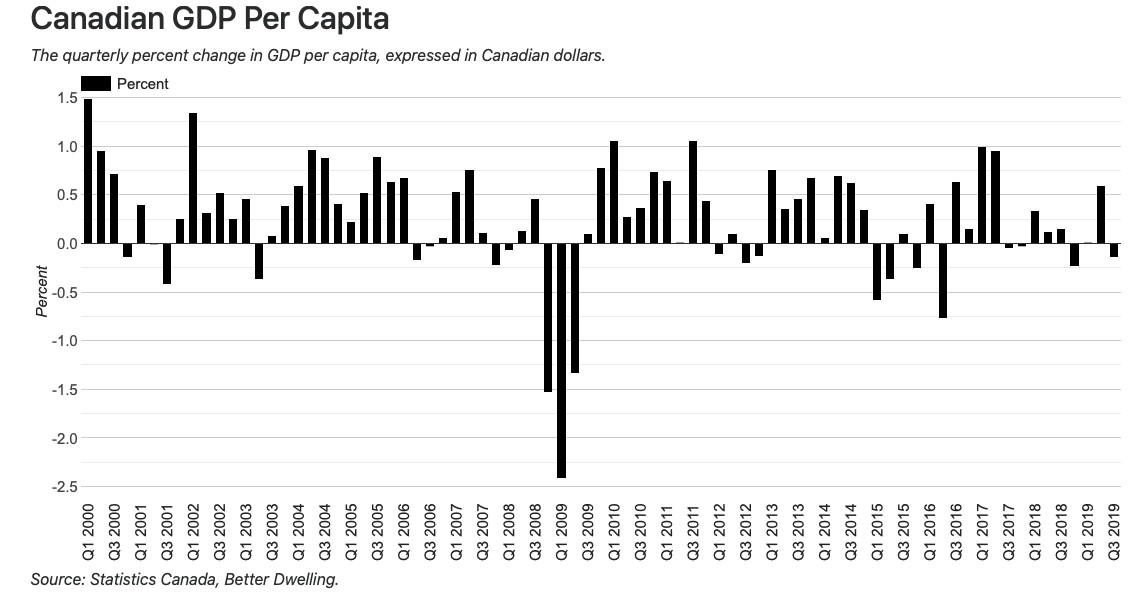
Gross domestic product (GDP) per capita is easy to figure out, but its importance is less obvious. GDP is a measure of a country’s aggregate economic output. That is, the total value of goods and services created/provided by a country. GDP per capita, is the value of those goods and services, divided by the population. Just that simple division gives us a *huge* improvement on perspective.
By itself, a country’s GDP is only useful as a pissing contest for world leaders. For the most part, it only tells us if GDP is getting higher, and if the government has control. GDP per capita on the other hand, gives us an idea of how the population is doing. If it goes higher, living standards are likely to improve. If it’s falling, the population may be seeing their quality of life stagnate or decline. What’s more important – if the economy is larger than a place you’ve never been? Or if you and your neighbour are seeing a deteriorating standard of living? The answer’s obvious if you’re not a politician or economist.
Canada’s GDP per capita is flatlining. Real GDP grew 1.3 per cent at Q3 2019, but the population increased 1.43 per cent. That means the population is growing faster than the output of the economy. That’s not obvious until you look at GDP per capita, which fell to $55,845 per person – down 0.15 per cent from the previous quarter. Compared to the same time last year, it’s up 0.21 per cent from 12-months ago. To contrast, the 12-month growth was 2.08 per cent, just two years ago. To be blunt, Canada’s large immigration numbers are window dressing a struggling economy.
Canadian yield curve is flashing a warning sign
Kevin Muir, strategist and author of the Macrotourist newsletter, @kevinmuir
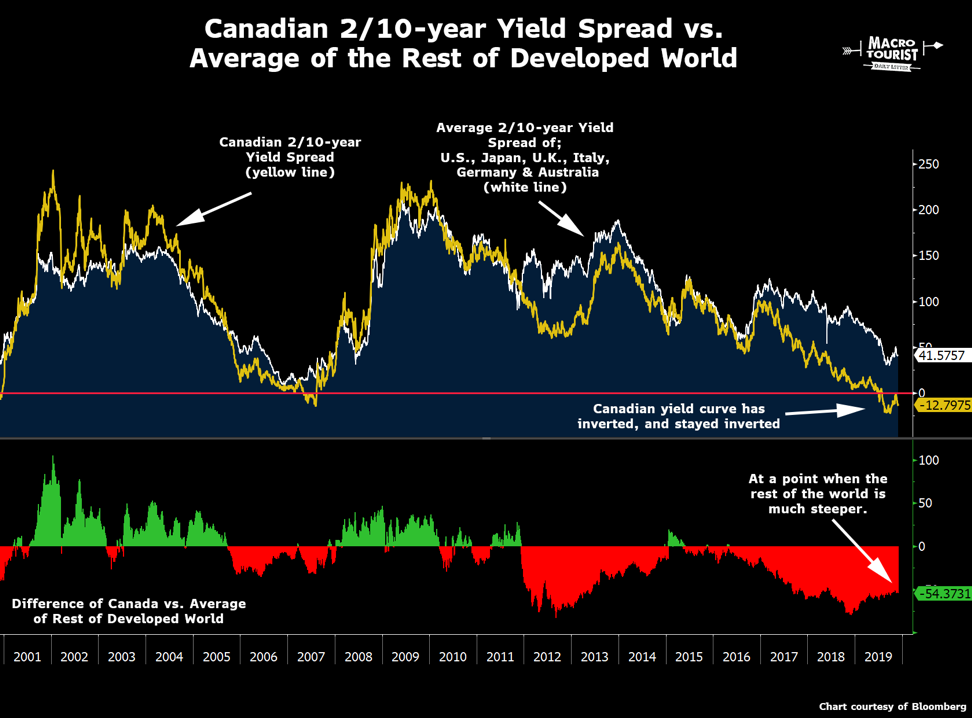
This past summer markets experienced a growth scare. Bonds throughout the world went bid in a mad scramble as investors desperately tried to buy fixed-income to lock in the quickly diminishing yields. Worries that economic activity would collapse sent yields plummeting.
During this period a few countries’ yield curves did something not seen since 2006 – they inverted. In a regular economic environment, short-term fixed-income instrument yield less than longer ones. However, when markets are concerned that a recession is right around the corner, investors rush into longer-dated bonds pushing those yields below the short-term rates.
This inversion of the yield curve has been one of the best economic signals for forecasting future economic activity.
However, with a couple of cuts to the Federal Funds rate and a reversal of the quantitative tightening policy to one of balance sheet expansion, the United States’ yield curve has reversed its inversion. The rest of the world’s yield curves have followed the U.S. higher, except for one country.
Canada is the only country in the developed world with an inverted yield curve. The difference between our yield curve and the rest of the world is almost as wide as it has ever been during the past couple of decades.
If Canada’s bond market is correct, it is flashing a very big WARNING SIGN.
U.S. recession signals flashing yellow
Beata Caranci, chief economist, TD Economics
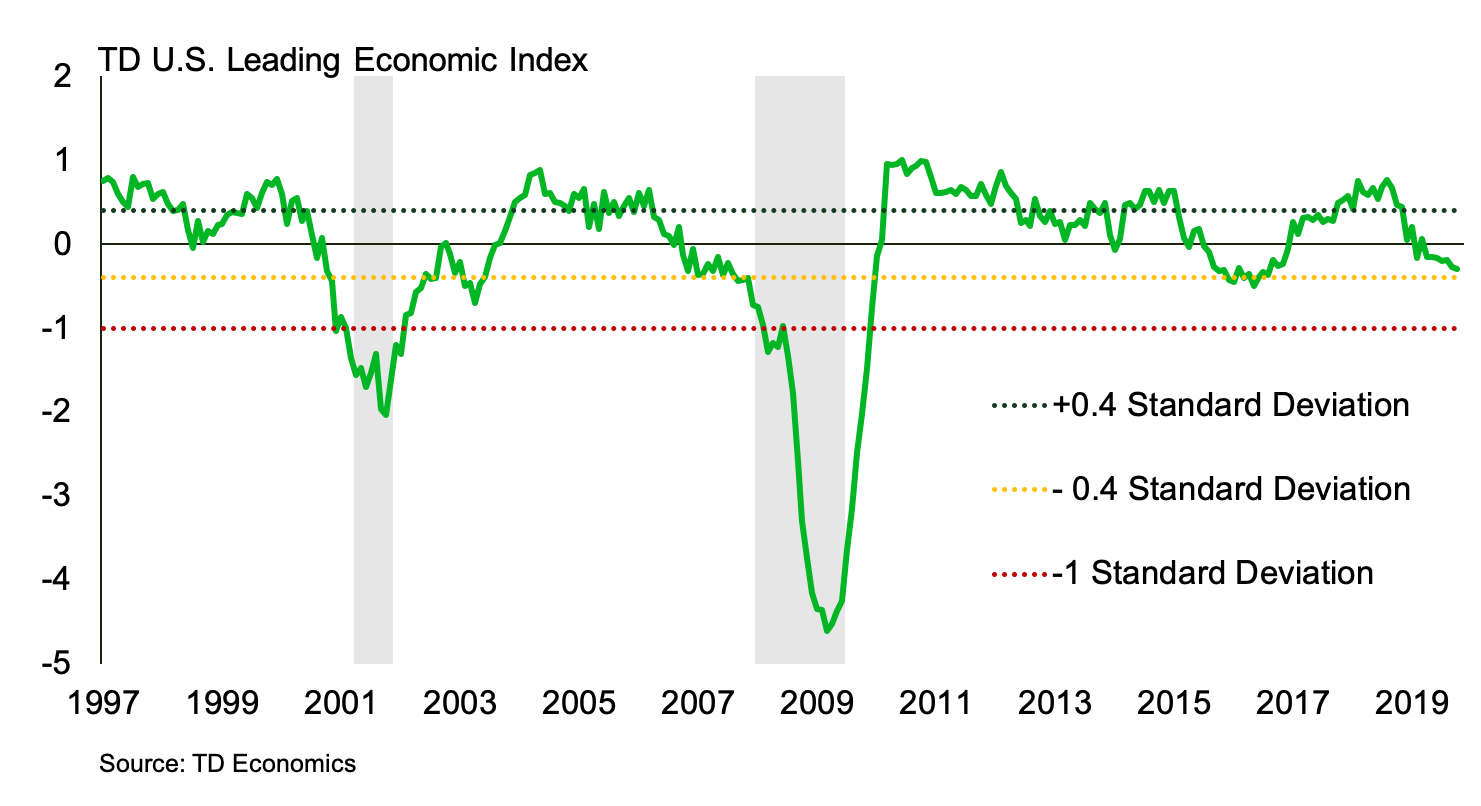
We’re closely monitoring our TD Leading Economic Index, which began demonstrating greater breadth of a slowing U.S. economy towards the end of the summer. Once this index crosses the yellow threshold, recession odds become more of a coin toss. The current pattern points to lower near-term growth in the one per cent to two per cent range, but not an outright contraction. What’s keeping the index above the critical threshold? Households. Interest rate cuts by the Federal Reserve have created a positive impulse into housing and consumer spending. As long as the household sector holds up, Canada’s largest trading partner won’t tip into recession, even with a contracting manufacturing sector weighing our index down.
No further ahead
Philip Cross, senior fellow, Macdonald-Laurier Institute
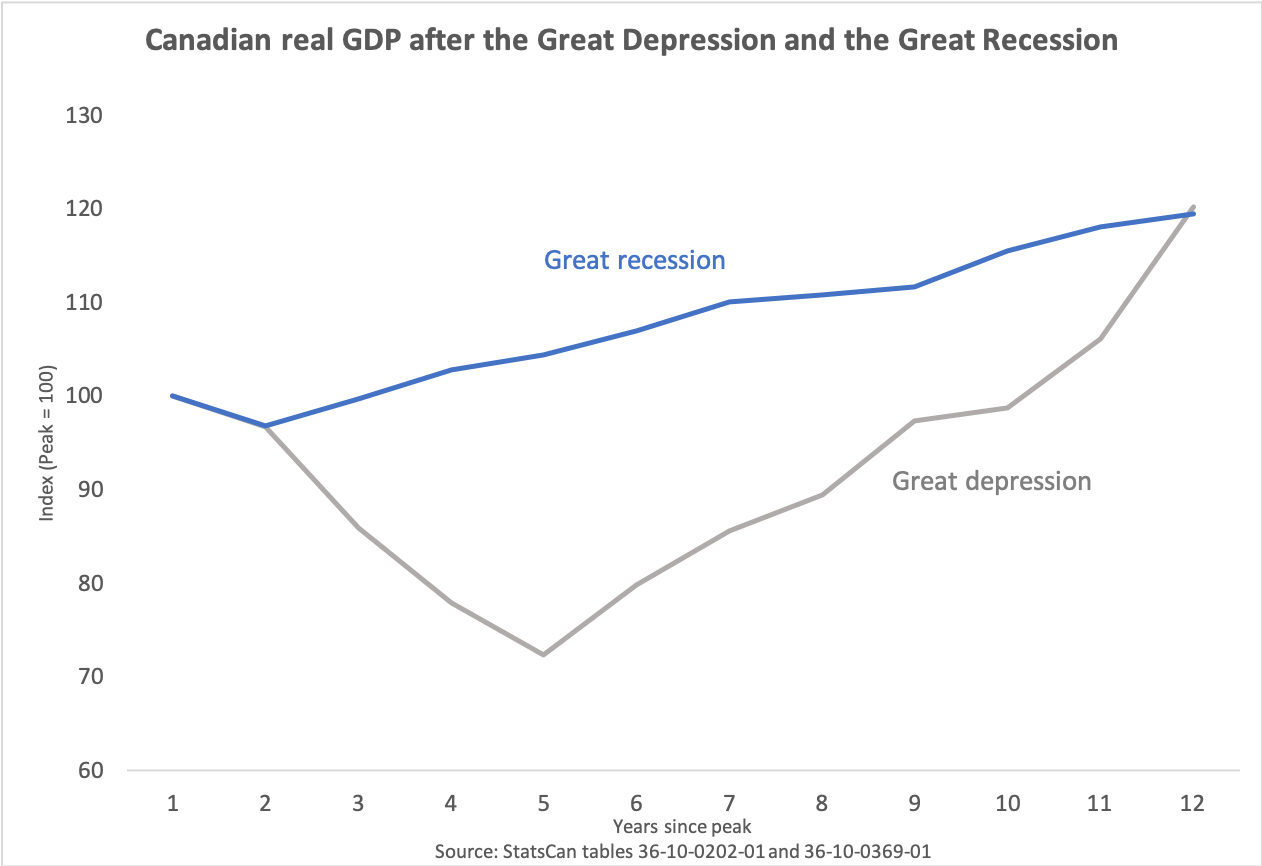
After 11 years of recession and slow recovery, real GDP since 2007 has not risen any faster than during the 11 years after the Great Depression began in 1929 in Canada. This despite unprecedented monetary and fiscal stimulus in Canada and in the major G7 nations. It is a damning critique of modern macroeconomics that despite all the tools, data and analysis that have been developed since the 1930s, policymakers were not able to improve on the performance of the economy during the 1930s. While the worst of the initial contraction after 1929 was averted, this came at the price of years of subdued economic growth.
Canada’s economy appears remarkably resilient
Kurt Reiman, chief investment strategist for Canada, BlackRock

Global growth, as indicated by the yellow line in the chart showing our G3 Growth GPS, slowed in 2019 on fading U.S. fiscal stimulus, mounting protectionist concerns and the delayed effect of monetary policy tightening in 2017 and 2018. A temporary ceasefire between the U.S. and China, easier monetary policy and a steady recovery in financial conditions, as indicated by the red line in the chart, suggests the slowdown will trough in 2020. Interestingly, our Canada Growth GPS, as indicated by the green line, has shown a steady pickup in recent months alongside the improvement in global financial conditions. We would note that a cheap Loonie, reversal of steel and aluminum tariffs, reduced uncertainty over the NAFTA 2.0 renegotiation and ratification, relatively stable oil prices, solid underlying labor market fundamentals, and a turnaround in housing augur for a reasonably constructive outlook for the Canadian economy in 2020.
Energy and the environment
Decision time for Canada’s greenhouse gas emissions
Andrew Leach, associate professor, Alberta School of Business, University of Alberta, @andrew_leach
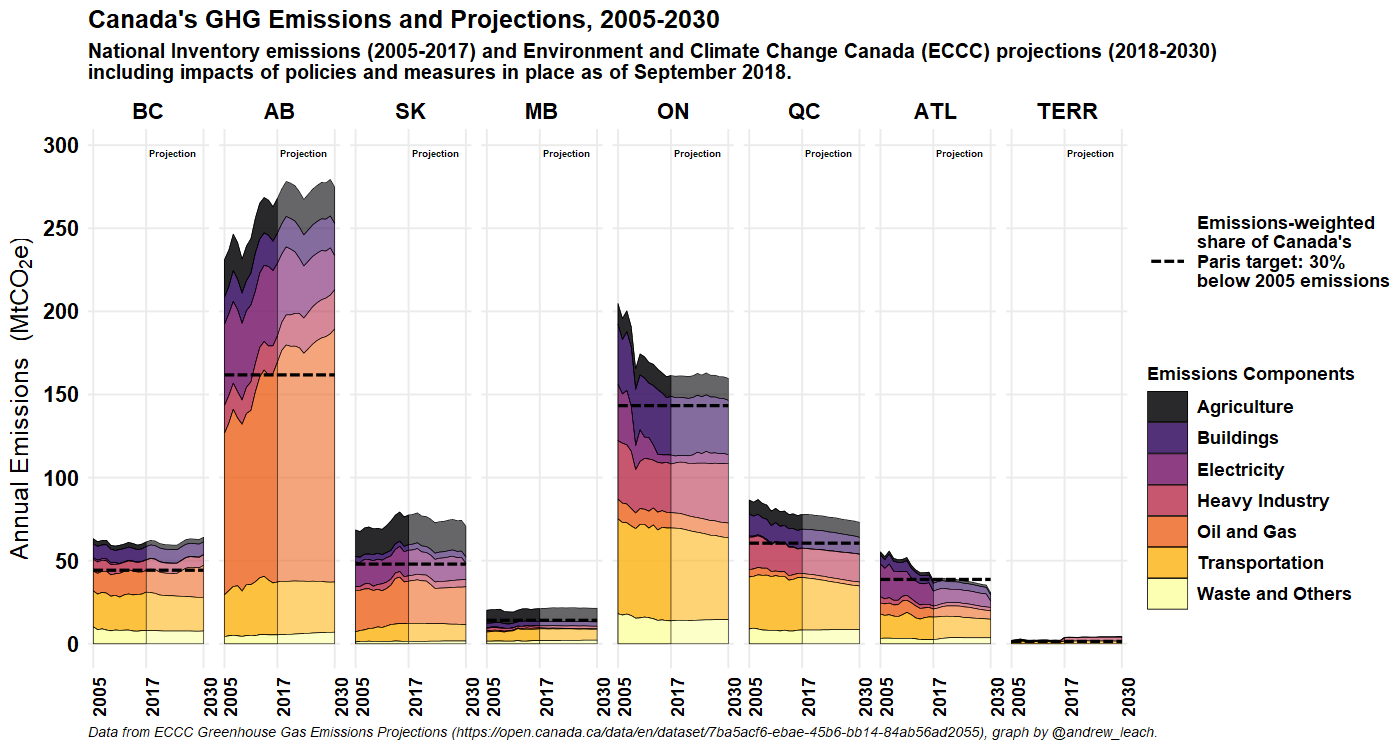
Under the Paris agreement, Canada committed to reduce its greenhouse gas emissions to 30 per cent below the 2005 level of 732 Mt CO2 eq by 2030. We’re currently projected to exceed this target of annual emissions of 512 Mt. Environment Canada’s projections, shown above, hold that policies in place as of September of 2018 will see our emissions decline only slightly from today’s levels, to 701Mt by 2030. Even with planned additional policy measures including the Clean Fuel Standard and policies already-implemented including carbon pricing and the phase-out of coal-fired power, and accounting for credits we get for land use practices and forestry, Environment and Climate Change Canada’s most recent projections have use on track to emissions of 592 Mt CO2 eq in 2030. 2030 is only 10 years away, and so to avoid missing yet another international commitment on greenhouse gases, we’re going to need to find more emissions reductions.
The challenge facing the Trudeau government is significant, and will likely occupy a lot of his attention during this minority government. Prime Minister Trudeau will face pressure from the left to strengthen our policies and likely also our targets and pressure from the right not to increase costs on Canadians or further constrain resource development. At the same time, we’ll see a Supreme Court challenge to Canada’s carbon pricing policies decided over the course of 2020. As such, my chart to watch for this year is Canada’s emissions inventory and emissions projections.
My chart shows emissions and projections by province and economic sector assuming we stick with the policies in place in September of 2018. The chart also shows how regional emissions have changed relative to 2005 levels. Some regions, including Ontario and the Atlantic provinces are on track to exceed a 30% reduction below their 2005 emissions by 2030. Others, including my home province of Alberta, are likely to see emissions remain well above 2005 levels even with additional policies in place. You’re going to hear a lot about emissions over the next 12 months. Hopefully this chart is useful to you.
Are truck and SUV sales topping out?
Jamie Carson, economic analyst, @carsjam33
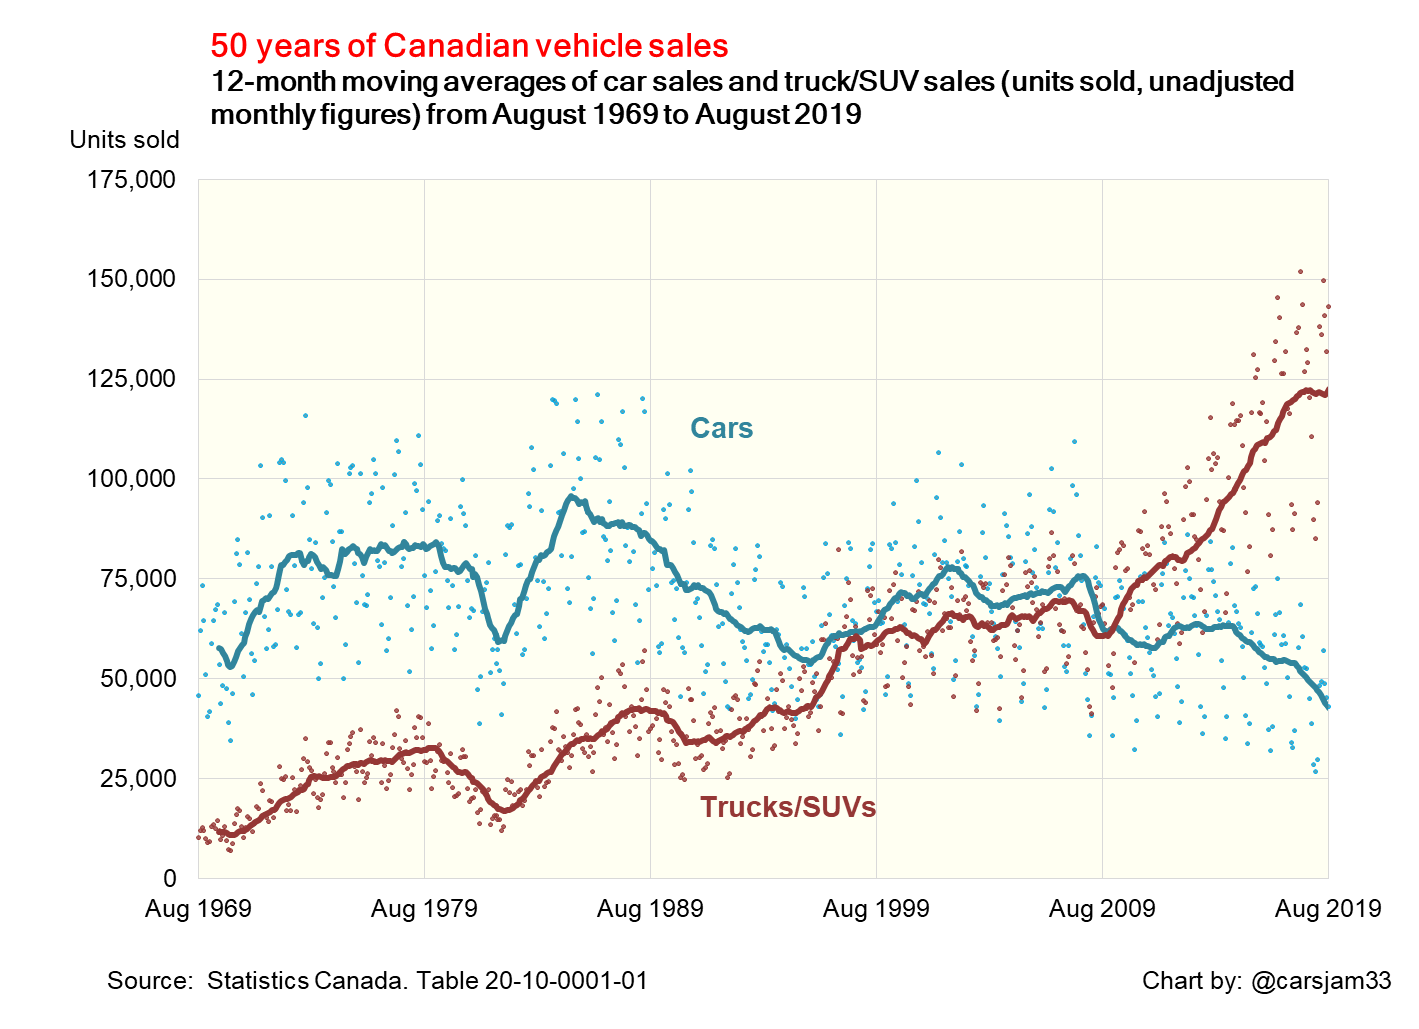
In August 2019, there were 100,000 more new trucks and SUVs sold than new passenger cars in Canada. What’s more, the 43,000 cars sold was less than the sales volume in August 1969. My chart to watch for 2020 is an updated version of what I submitted for 2018. (What can I say? I was early.) The decline in the 12-month moving average of new cars sales is nothing new. There are now roughly three trucks and SUVs sold for every car. What’s new is the flattening of the trend in truck and SUV unit sales. Heading into the slow season for new vehicles sales, are we headed for a downturn, and could it be sizeable? Could this be a turning point for the Canadian consumer? You can see the monthly unit sales dots on the charts and have a sense for the growing month-to-month volatility in the trucks/SUVs category.
Of course, I’d be remiss if I left out the environmental aspect of the story: According to the International Energy Agency, trucks and SUVs were the second-biggest contributor to CO2 emissions after power utilities. The added fuel consumption by trucks and SUVs is offsetting efficiency gains in compact cars, the decline in diesel, and the growth of electric cars. Given the current political turmoil in terms of fuel emissions policy south of the border (with spillover effects here), our greenhouse gas reduction targets look harder and harder to reach.
One last point: A major factor for buying trucks and SUVs is occupant safety. Indeed, crash data indicate that occupant fatalities are trending downwards. At the same time, these larger and heavier vehicles have been cited as a contributor to the increase in pedestrian fatalities. Something to ponder when adding up the social costs of road transport.
Ontario electricity prices are rising again
Kirsten Smith, graduate research assistant, LBJ School of Public Affairs, University of Texas at Austin, @kirst_nicole
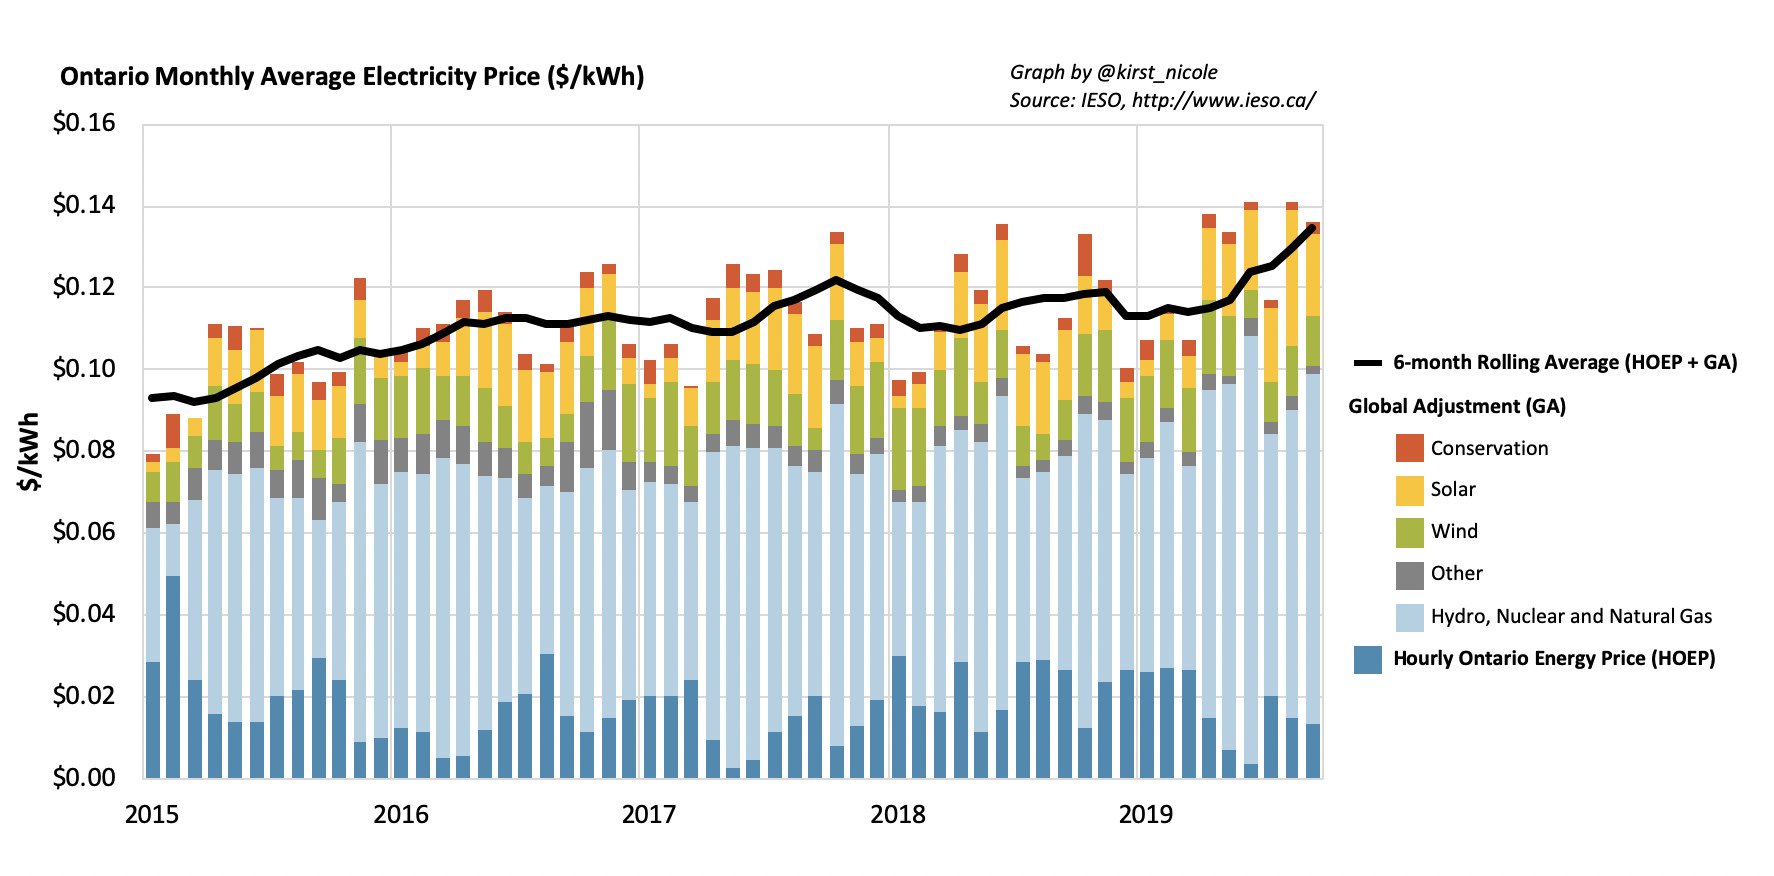
Ontario’s electricity market prices have been increasing again in 2019. As of September, year-to-date prices were ¢12.6/kWh on average, up almost 12 per cent over the same period last year.
The price of electricity that consumers in Ontario face has two components: the Hourly Ontario Energy Price (HOEP) and Global Adjustment (GA). Although HOEP is determined in the wholesale market, as most generation in the province receives a guaranteed price of electricity, the Global Adjustment mechanism is used to fill the gap between the price as determined in the wholesale market (HOEP) and the price necessary to cover contracted generation. If HOEP goes up then GA goes down and vice versa.
In order to maintain system reliability and avoid blackouts, the Independent Electricity System Operator currently maintains a 17.4 per cent reserve margin of excess capacity above forecasted peak demand. This reserve margin is forecast to increase to 21.7 per cent next year with new contracted capacity additions. When supply exceeds demand, the province exports electricity to neighbouring provinces and states. In 2018, it exported 18.6 TWh, 84 per cent of which went to Michigan and New York. For comparison, Ontario consumed 137.4 TWh of electricity in 2018.
While this allows the province to export low-carbon electricity to neighbouring jurisdictions, exports are sold at HOEP for a fraction of what it costs to ensure that supply is available to Ontario consumers. As electricity prices are on the rise again and the province will reach peak contracted capacity in 2020, Ontario might consider asking how much it’s willing to pay to maintain its current level of system reliability going forward.
A shift from gasoline to electric vehicles
Blake Shaffer, adjunct professor of economics, University of Calgary, @bcshaffer
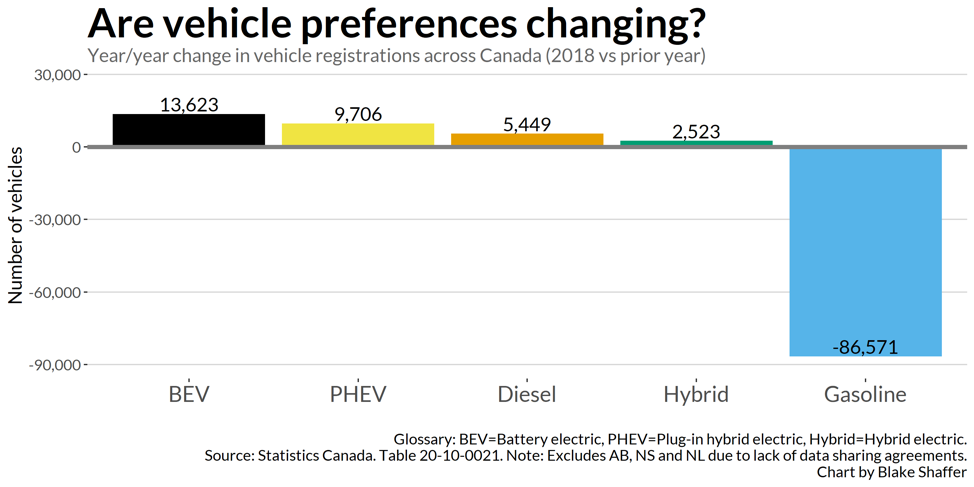
2018 saw some big changes in new vehicle registrations in Canada. First, the total number of new vehicles fell. This is not specific to Canada, but rather part of a broader global trend recently. It could be a harbinger of a pending recession, or be due to related impacts from global trade frictions, or a trend towards densification and less resulting need for car ownership. It could also be a sign that car buyers are delaying purchasing traditional vehicles as they anticipate further cost declines in electric vehicle alternatives.
Which brings us to the second noteworthy change: electric vehicles (notably battery and plug-in hybrid varieties) led the change in new vehicles in Canada in 2018, increasing by 153 per cent and 85 per cent respectively. While still only 3.5 per cent of all new vehicles, the share of EVs is increasing rapidly. Recent data in B.C. has the EV share at 10 per cent of all vehicles, and substantially higher as a share solely of passenger cars.
The speed of EV adoption will have large impacts in the way we fund roads, the deployment of charging infrastructure, demand for gasoline, and emissions from the transportation sector. Keep an eye on this sector, as it may continue to surprise to the upside in Canada and abroad.
Rise of the electric car
Matthew Klippenstein, cleantech consultant, @ElectronComm
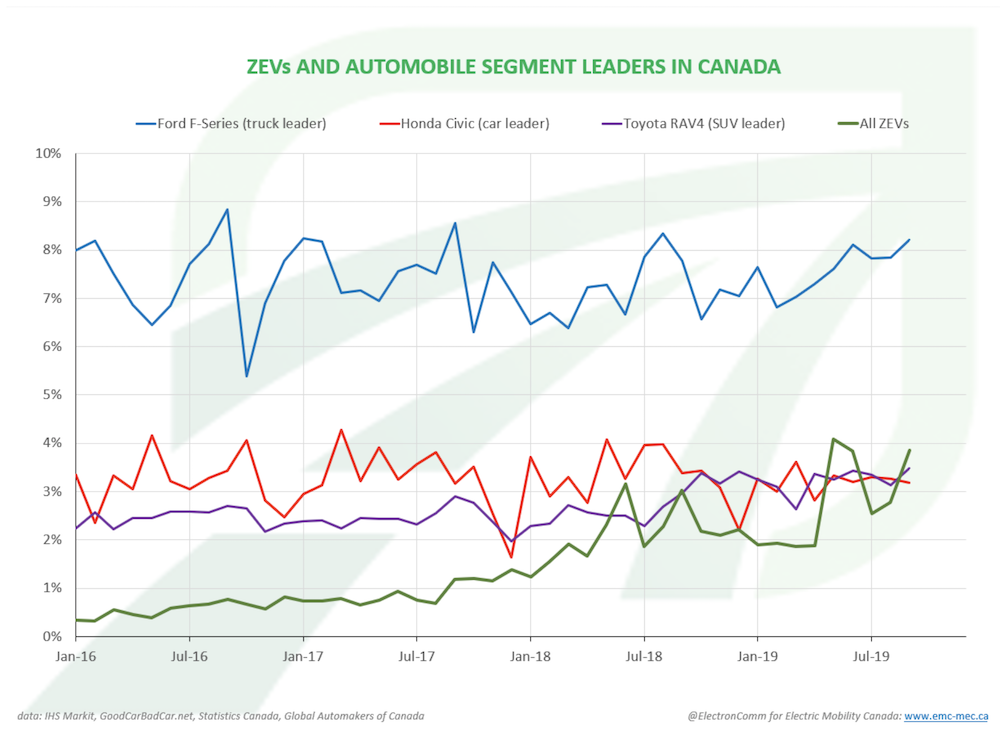
Zero Emission Vehicle (ZEV) sales in Canada have soared in recent years, helped by broader selection, longer electric ranges, greater buyer awareness, and public policy support. Data compiled on behalf of Electric Mobility Canada, a non-profit dedicated to advancing e-mobility, shows that since the launch of the federal government’s purchase incentives in May, their combined market share has reached about 3.5 per cent, a roughly tenfold increase from 2014 levels.
Monthly sales of Zero Emission Vehicles – a category which encompasses battery-electric, plug-in hybrid and early hydrogen fuel cell vehicles – are now roughly on-par with the Honda Civic and Toyota RAV4, Canada’s best-selling car and SUV respectively.
While Ford’s F-series trucks maintain a dominant eight percent market share, the arrival of many new models in the next two years, including ZEV versions of the F-150 and RAV4, give advocates hope that Zero Emission Vehicles can challenge the F-series sales totals in a “Charts To Watch” in the early 2020’s.
The growing gap between oil supply and pipeline capacity
Rob Roach, managing director of research, ATB Economics, @RobRoachCalgary
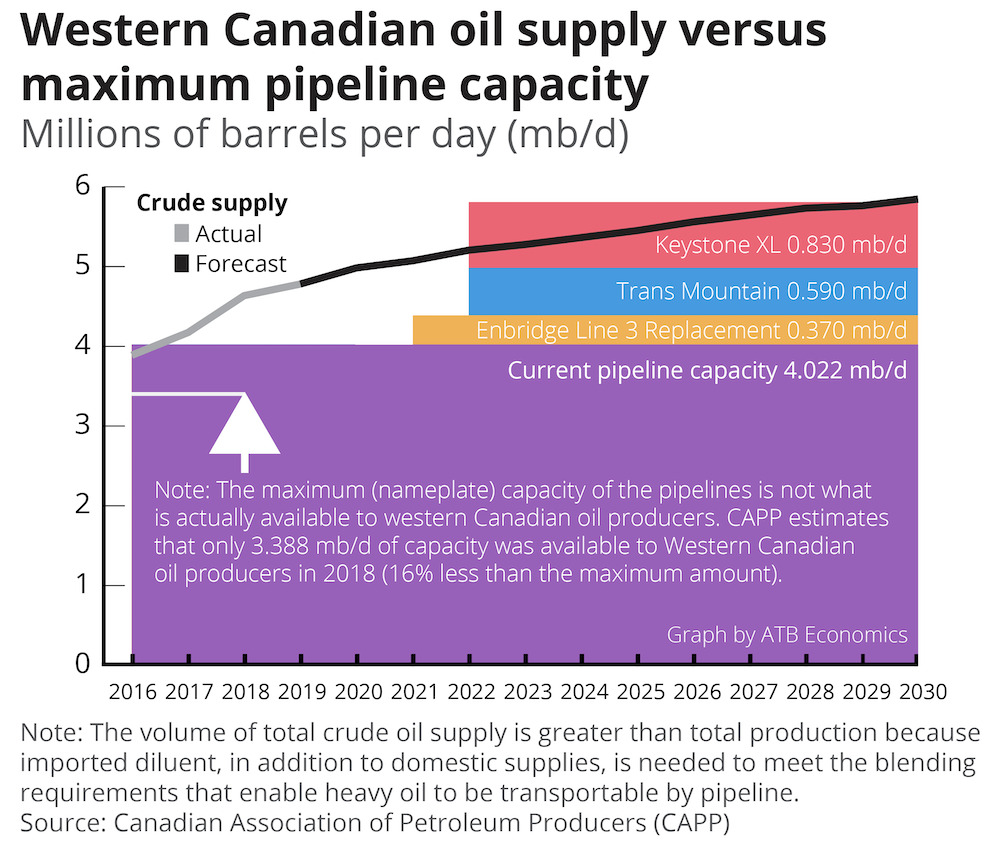
The Canadian economy depends on expanding oil production as a source of economic activity and growth. The problem is that a lack of pipeline capacity is threatening to stymie the future expansion of oil production in western Canada. Total oil supply in western Canada began to exceed the maximum capacity of current pipelines in 2017, with the gap growing to 635,000 barrels per day (b/d) in 2018. Some of this oil can, and does, move by rail, but the rail option is more expensive, more dangerous, and has its own capacity limits. What’s more, the maximum, or nameplate, capacity of pipelines is not what’s actually available due to maintenance, outages, downstream constraints and other factors. The Canadian Association of Petroleum Producers (CAPP) estimates about 635,000 b/d of capacity was unavailable to western Canadian oil producers last year. This brings the actual gap between supply and pipelines in 2018 to 1.27 million b/d.
The Line 3 Replacement Project is the closest to completion and will add an additional 370,000 b/d of nameplate capacity if it comes online as expected late next year. This will still leave a gap between supply and maximum capacity of about 700,000 barrels per day in 2022. If the Trans Mountain expansion is completed, this will help close the gap, but we will also need Keystone XL to come online to keep up with the supply forecast—a forecast that is already lower than what it could be because of the delays and uncertainty surrounding pipeline construction. And, even with all three new projects in service—which may not happen—supply will start to outstrip maximum capacity again within ten years.
Corporate renewable energy procurement taking off
Sara Hastings-Simon, Research Fellow at University of Calgary, @S_HastingsSimon
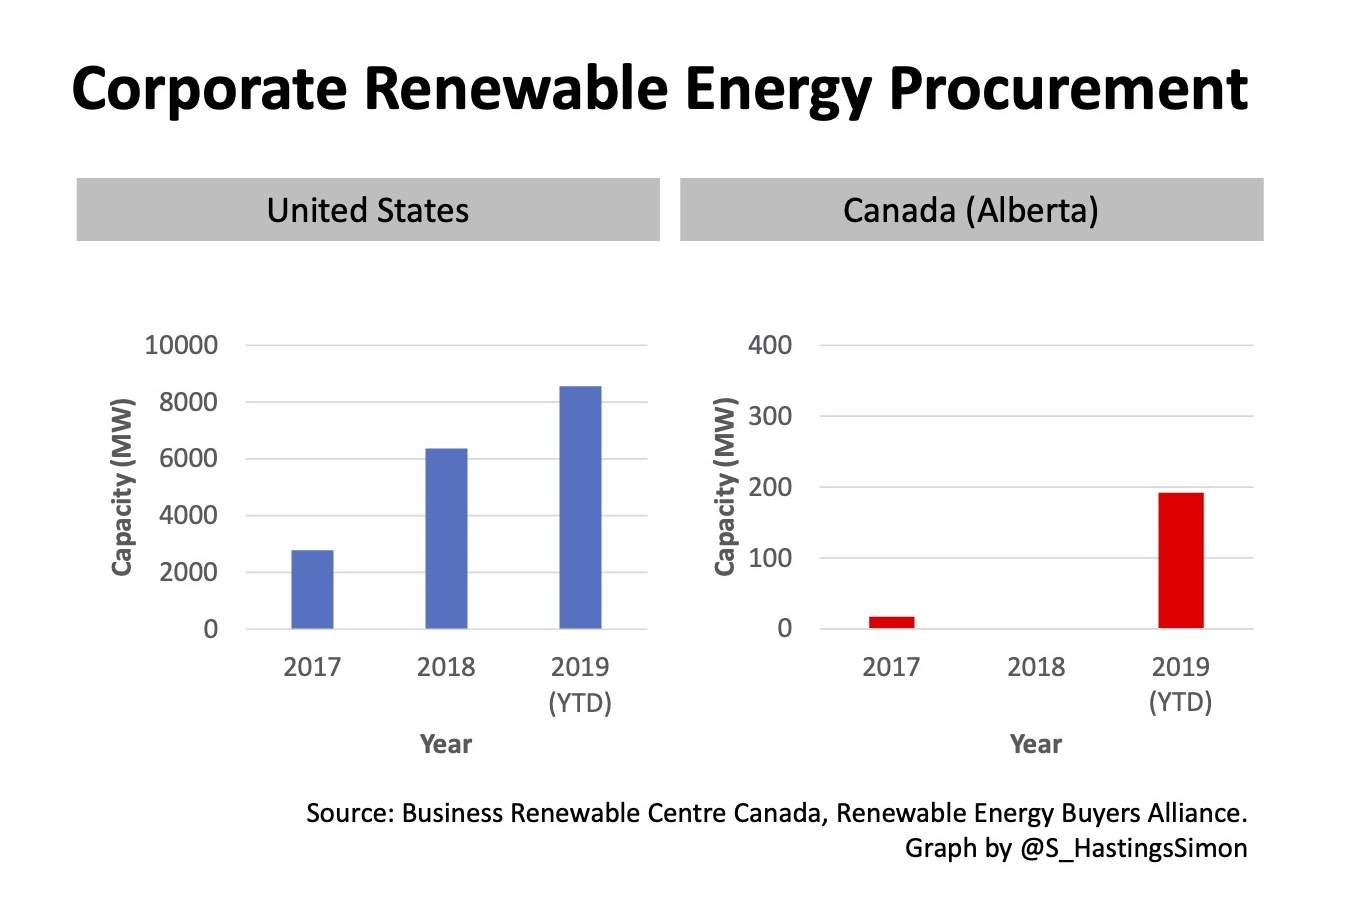
The last three years have seen a dramatic increase in the practice of corporations and institutions purchasing renewable energy directly from developers in the US. Falling cost of renewables along with an increasing number of corporate sustainability targets is behind this market growth. Canada has remained on the edges of the opportunity, with a handful of deals over the years in Alberta – the only deregulated electricity market with real potential. Alberta’s market is heating up on the heels of the government renewable energy procurement which attracted a number of developers to fill the project pipeline and provided a price discovery. The industrial carbon tax creates another market opportunity for procurement in the province.
The end of 2019 saw a meaningful increase in Alberta with 2 major deals signed by corporates in the fourth quarter for new wind and solar projects. The deals represent almost 200 MW of capacity and will lead to $400 million in investment. Looking forward the potential for future growth is significant – with over 10,000 MW of renewable energy projects in the queue and many corporate buyers actively shopping for deals 2020 could be the breakout year with projects and investments in Canada more than doubling.
Fossil fuel consumption continues to rise
Ian Lee, associate professor, Carleton University’s Sprott School of Business
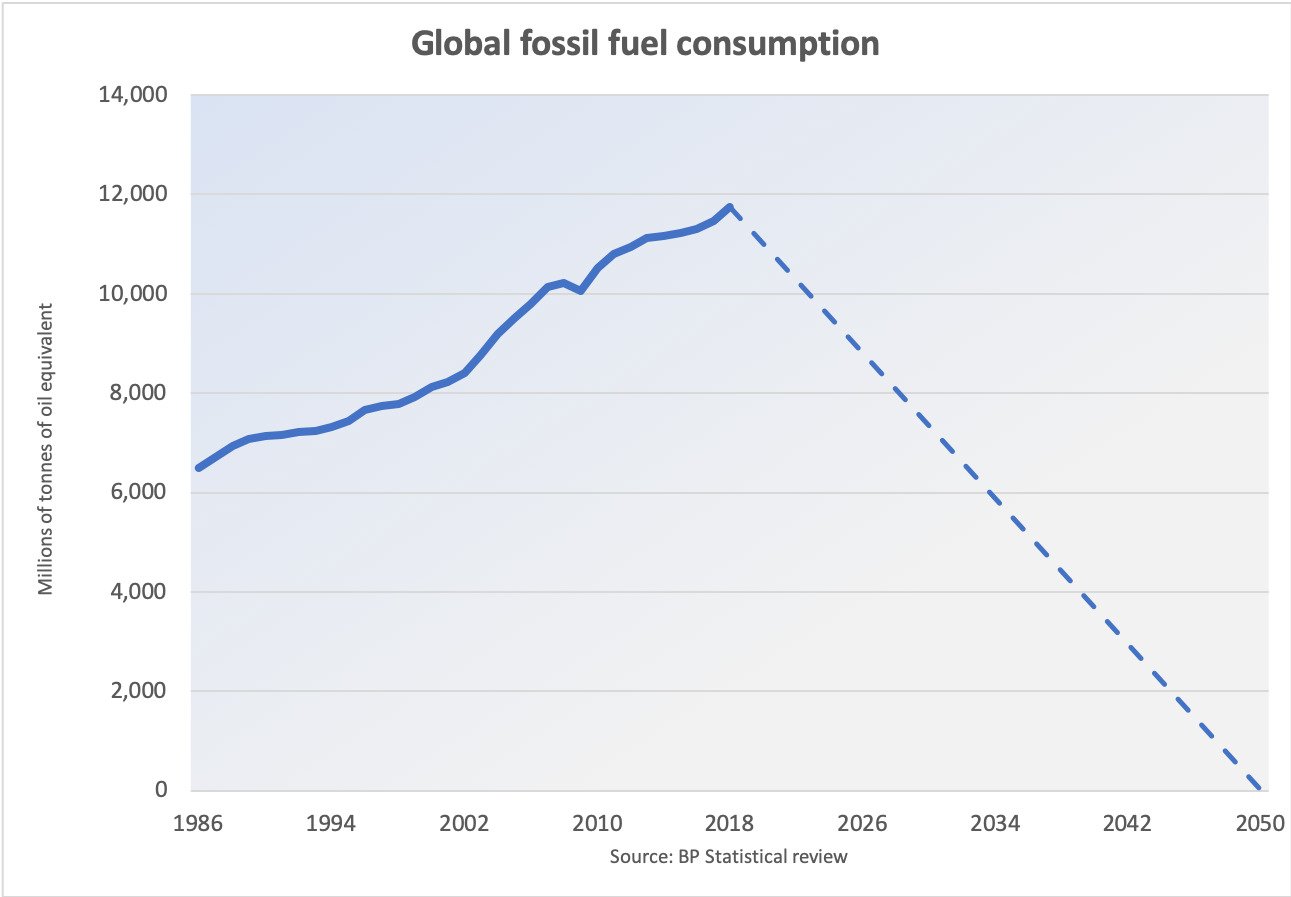
This graph reveals and demonstrates the near impossibility – barring a technological breakthrough in carbon capture or mass electricity storage breakthrough – of achieving net zero global carbon emissions by 2050. To replace the equivalent of 11,865 mtoe (millions of tons of oil equivalent) fossil fuels consumed in 2018 (BP Statistical Review of World Energy, 2018) will require building the equivalent of 1 nuclear power plant a day every day in the approximate 11,000 days until 2050.
Government finances
Alberta’s resource revenue roller-coaster
Steve Lafleur and Ben Eisen, Fraser Institute, @Steve_Lafleur, @benkerteisen
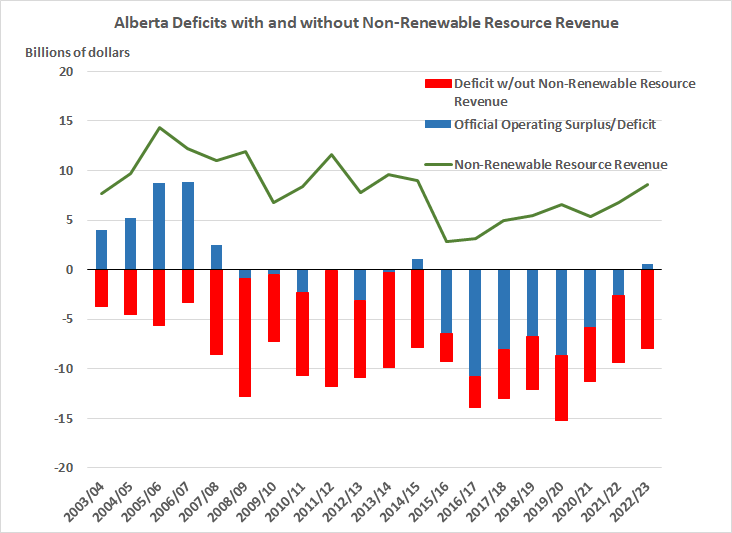
Alberta’s government finances are in shambles. Last year, the province ran a $6.7 billion operating deficit. Even this deficit number, however, understates Alberta’s fiscal woes because last year the government collected $5.4 billion in non-renewable resource revenues and applied it to current spending. To use a common metaphor, the government is selling the family silver to pay today’s bills.
There’s nothing new about this approach to Albertan budgeting. As the chart shows, if you excluded natural resource revenues, Alberta would have run uninterrupted budget deficits in recent years, even during good economic times. Since 2003, those deficits would have ranged from $3.7 billion to $13.9 billion. Even when the province has balanced the budget during that period, it’s leaned heavily on the “resource revenue roller-coaster,” relying on this volatile source of revenue to paper over fiscal problems. With plans for spending reductions announced in the recent budget, some may wonder whether the new fiscal plan will finally end the wild roller-coaster ride. The answer, in the near term at least, is no. The Kenney fiscal plan relies on resource revenues increasing by 58 per cent between 2018/19 and 2022/23, shaving $3.2 billion off the deficit.
In other words, hold on for another ride on the roller-coaster. Solving Alberta’s fiscal problems means more than balancing the budget, it also means getting off the roller-coaster. This process won’t be over in 2022/23—not by a long shot. The provincial government must make many more hard choices in the years ahead.
Federal debt-to-GDP rule will likely be breached
Kevin Page, president, Institute of Fiscal Studies and Democracy, University of Ottawa
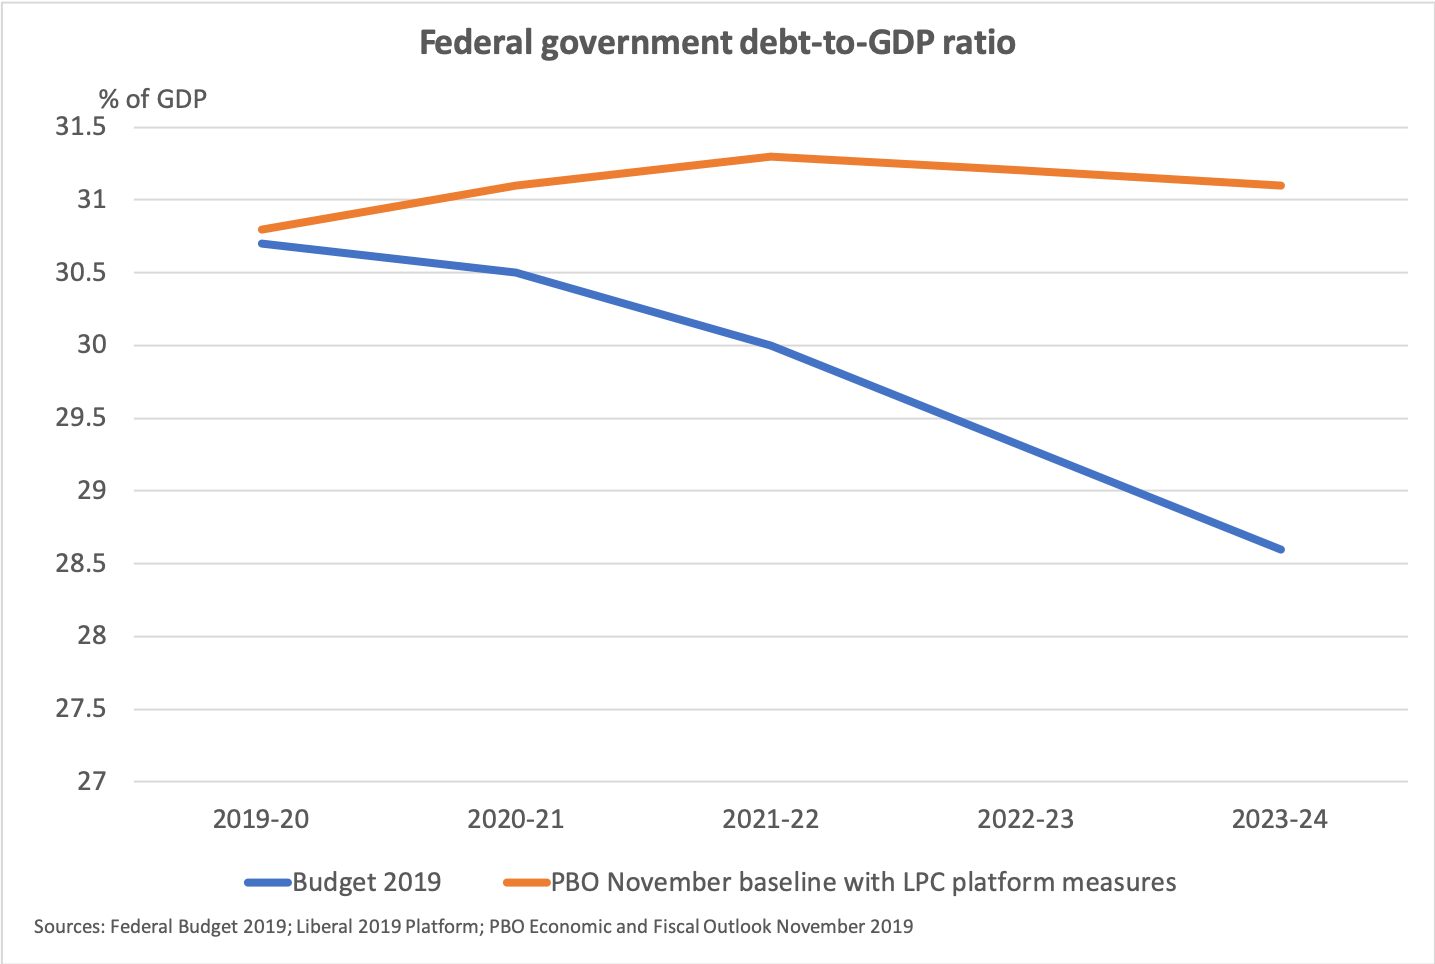
The Liberal Party 2019 platform (Forward: A Real Plan for the Middle Class) indicated that a Liberal government fiscal (budget constraint) rule would continue to be based on a declining debt-to-GDP ratio over the medium term planning horizon. IFSD analysis suggests that this fiscal rule will likely be breached – the federal debt-to-GDP ratio will likely go up (not down). The chart provides a projection of the ratio based on four assumptions – use of the (updated) PBO November 2019 Economic and Fiscal Outlook; full implementation of the Liberal Party 2019 platform policy agenda; a $3 billion annual reserve for risk; and a calculation for higher public debt charges due to the platform policy measures. If these assumptions are realized, the new Liberal Government will face a choice between constraining implementation of its policy agenda or adjusting (relaxing) its fiscal rule.
Provincial debt watch
Philip Smith, economist, @PhilSmith26
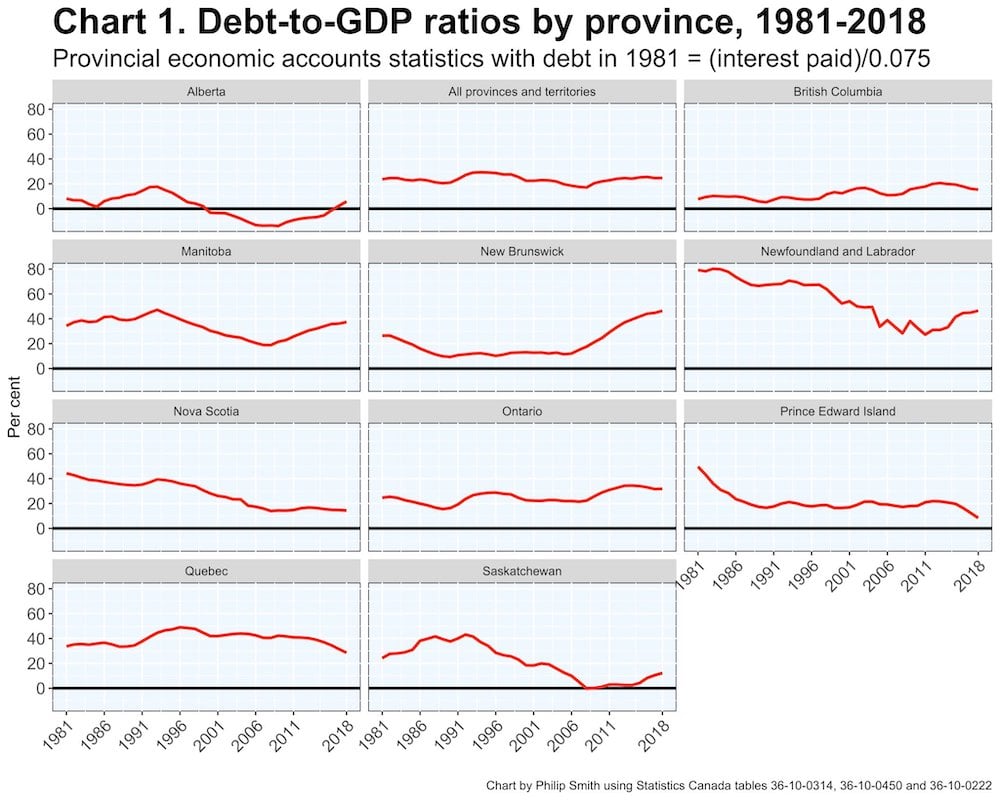
Growing public debt is an important issue in several provinces, despite very low interest rates. The larger a province’s debt is, relative to the size of its economy, the less maneuverability it will have when coping with future crises. Newfoundland and Labrador, New Brunswick and Manitoba need to be especially concerned. The statistics in the charts are derived from Statistics Canada’s provincial economic accounts up to 2018. In the chart, provincial debt is calculated by accumulating deficits and surpluses (net lending or borrowing in national accounts terminology) through time. The starting values in 1981 do not matter much, but were estimated by assuming an effective interest rate of 7.5 per cent and dividing this into total interest paid in that year on each province’s debt. National accounts deficit and debt numbers differ from provincial government figures because the provinces’ accounting rules vary from government to government, and through time. The national accounts data have the advantage of being comparable across provinces and conceptually consistent through time, and they are not affected by political manipulation of public accounting conventions. They are derived from the detailed information in the provincial public accounts, but are adjusted to a standard set of accounting rules, on a calendar year basis.
Federal transfers should be on everyone’s radar in 2020
Dominique Lapointe, economist, Laurentian Bank Securities
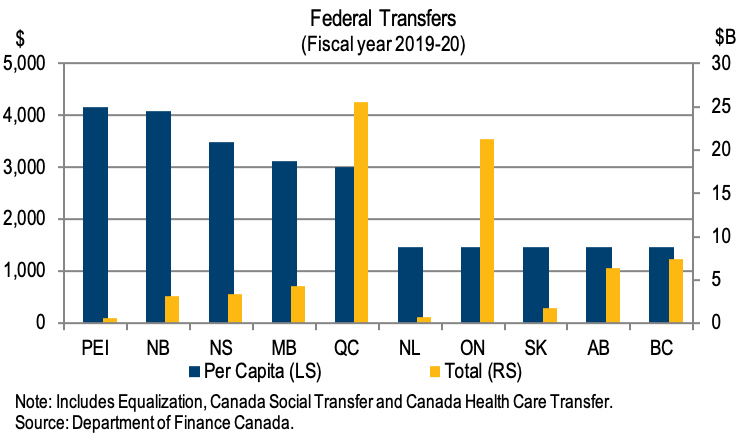
Federal transfers, how they are attributed and how fast their envelope grows, were always at the epicenter of many federalism issues. In 2020, they should receive an increasing amount of attention. Equalization is more and more in the spotlight. Indeed, Alberta Premier Jason Kenney mentioned his intention to hold a referendum over equalization if the federal government does not modify Bill C-69 regarding major infrastructure projects approval. Also Saskatchewan Premier Scott Moe asked the federal government for a modification of the program, claiming it fails to address the economic reality of energy-producing provinces. 2020 may also bring around the introduction of a national pharmacare program. Based on a federally appointed committee’s recommendation, it would require the introduction of a brand new federal transfer, also subject to negotiations with provinces. Federal transfers should be on everyone’s radar in 2020.
Municipal governments are bucking the deficit trend
Farah Omran, policy analyst, and Bill Robson, CEO, C.D. Howe Institute
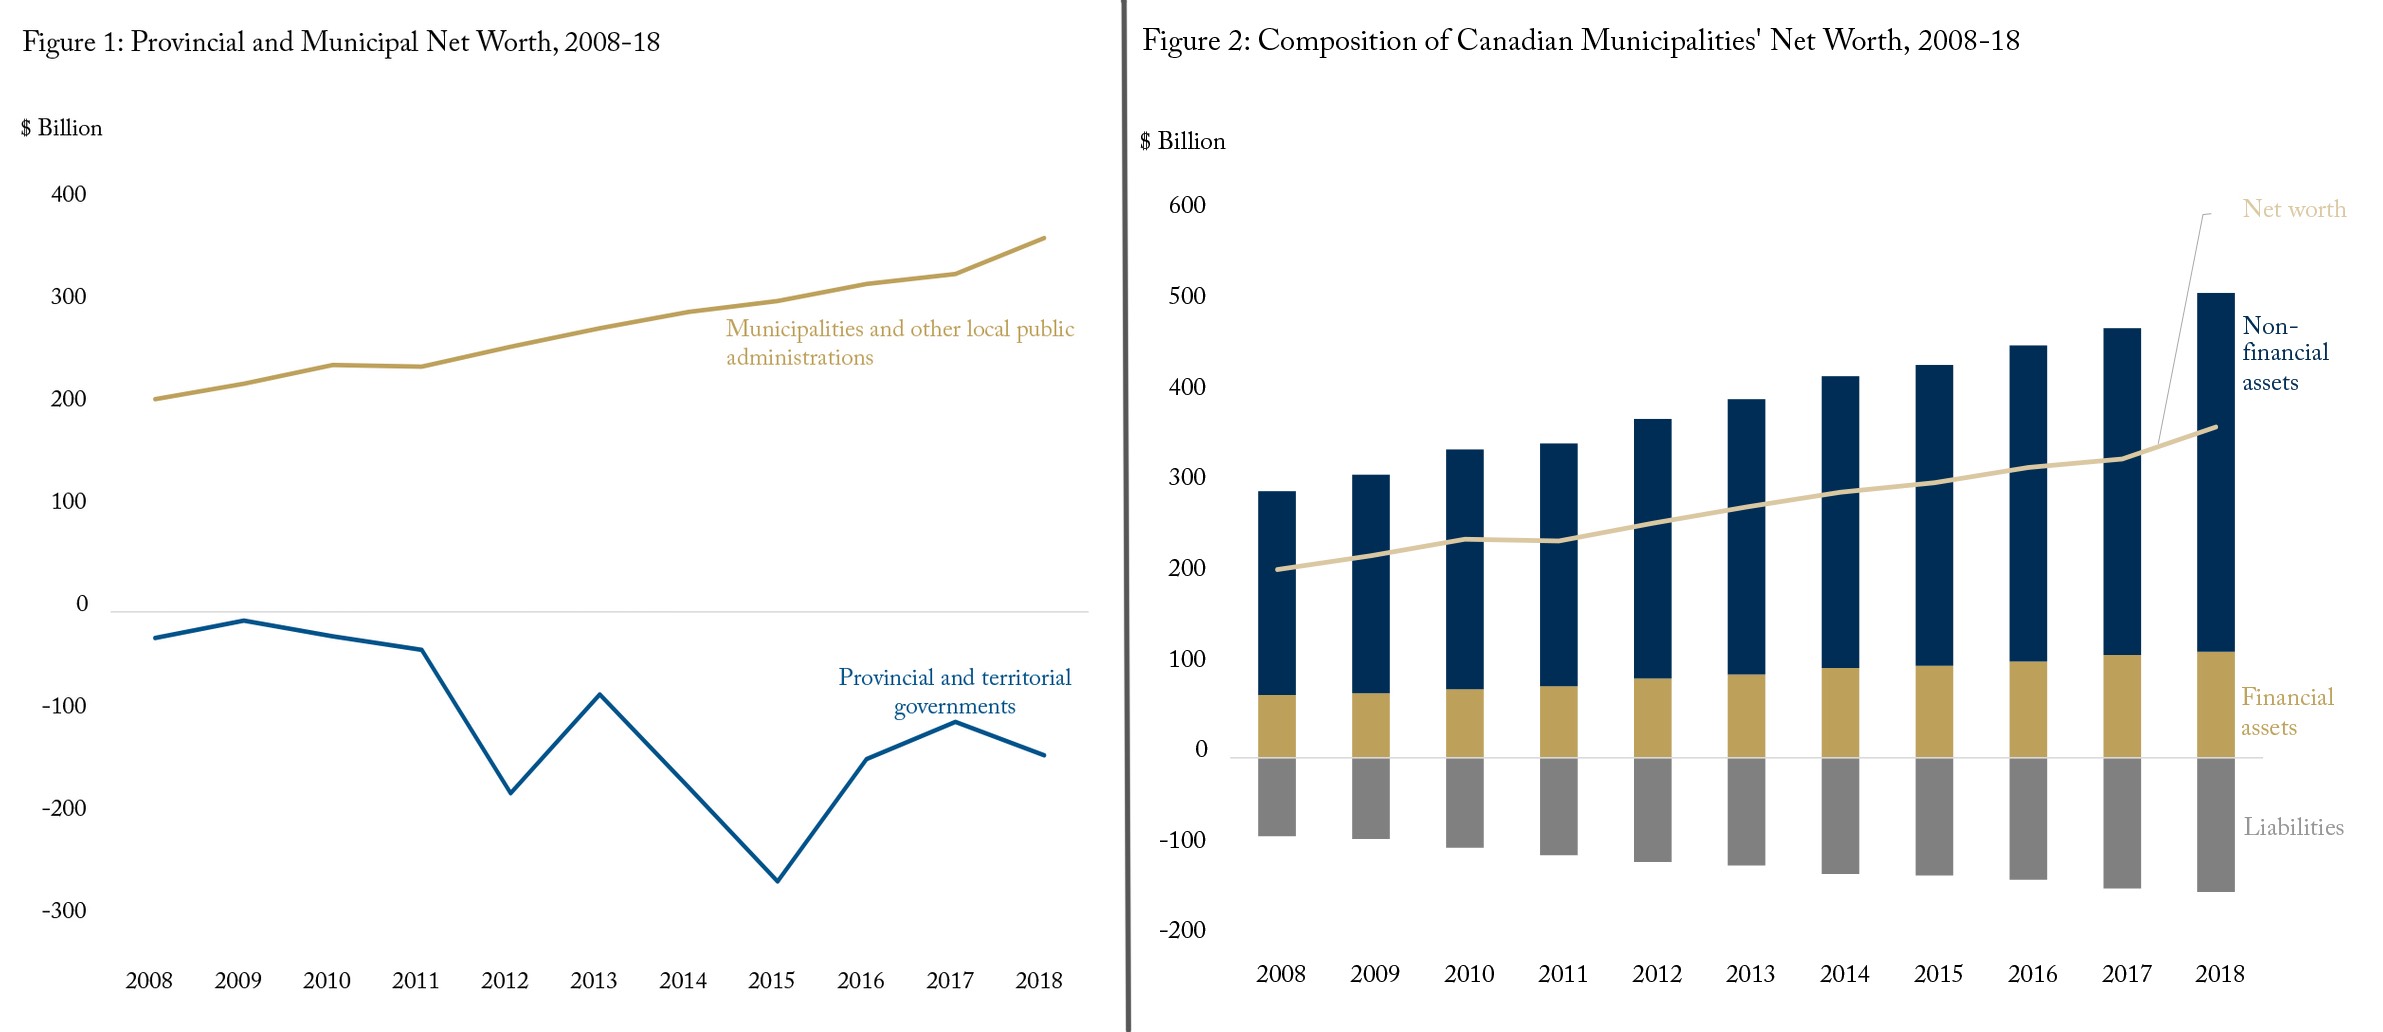
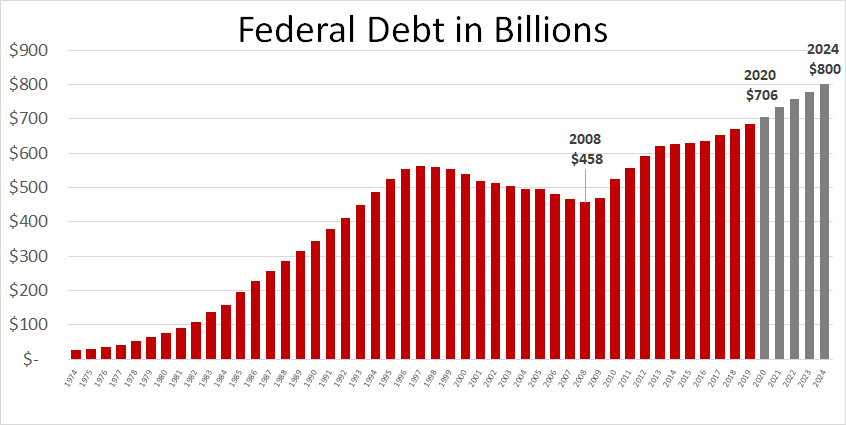
Canada’s federal government is running deficits, and its net worth is negative – its financial statements show an accumulated deficit approaching $700 billion. And as most of us know, provincial governments and territorial governments are also deficit-prone – altogether, their net worth is also negative. What about municipal governments? You might think, given their annual budget-debate angst about service cuts and hikes to property taxes and fees, that they are also running in the red. But they aren’t. Canadian cities consistently run surpluses – and in contrast to Canada’s senior governments, have assets well in excess of their liabilities.
Calgary needs a modern property tax framework
Lindsay M. Tedds, associate professor of economics and Scientific Director of Fiscal and Economic Policy, University of Calgary’s School of Public Policy, @LindsayTedds
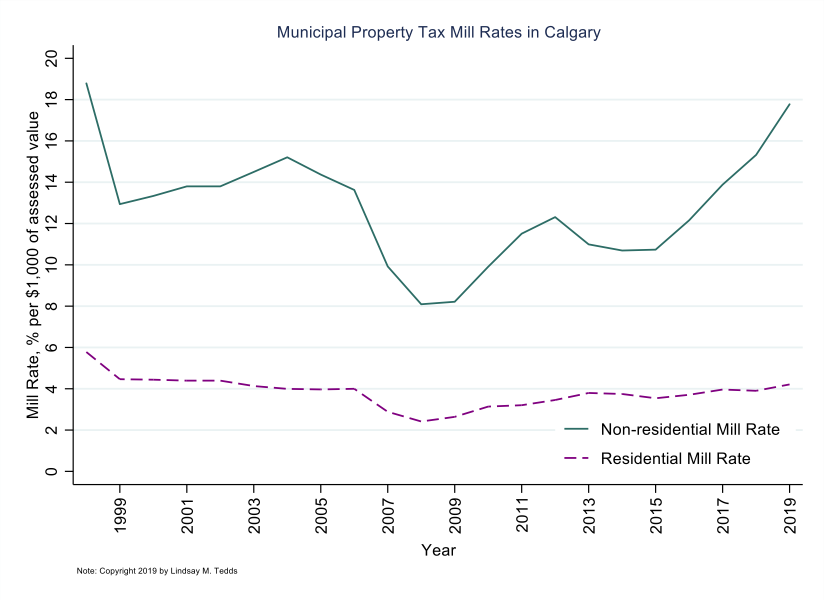
The City of Calgary is facing a reckoning with its property tax framework. The City long decided to peg the portion of property tax revenues raised from residential property and non-residential properties (i.e. commercial and industrial property, machinery and equipment, linear property, and railways). The portion raised from non-residential properties has been set to be as high as 60 per cent, with much of it coming from the shiny office towers that were home to Canada’s oil and gas head offices. However, with the oil collapse came a dramatic fall in the assessed value of these office buildings taking with it about $300 million (15 per cent) of the City’s property tax revenues. Solely because of the property tax framework, this simply caused a shift of the non-residential property tax burden from non-residential property in the downtown core to non-residential property outside of the core. Many of these businesses, not big oil and gas companies, but rather small family businesses, faced a more than $10,000 a year increase in their property tax bill despite there being no change in assessed value or, importantly, no change in their income generating potential. Following a property tax revolt, the City of Calgary began what is being called a tax shift, reducing the property tax revenue ratio to raise only 48 per cent of property tax revenues from the non-residential sector.
However, the tax shift still leaves a strange way to think about tax policy, as portion of revenues rather than tax rate. The figure here shows what the portion of revenues system has meant for the mill rate, the amount of property tax payable per $1,000 of assessed value, faced by the commercial and residential sectors in Calgary as well as neighbouring jurisdictions. It is clear that the status quo property tax system places a large burden for property taxes on the non-residential sector, with mill rates ranging from eight per cent to 19 per cent compared to between two-to-six per cent for residential properties. This high burden, which even at the new lower portion is still reaching a mill rate of 18 per cent, is not clearly tied to this sector demand for municipal goods and services, nor to their ability to pay, and will impeded business investment, something which the City desperately needs. What the City needs to strongly consider is to better set the mill rates to ensure that the non-residential sector is not shouldering an undue burden of paying for municipal services which will necessarily mean increasing the residential property tax mill rate significantly while at the same time decreasing the property tax mill rate on non-residential properties. As City councillors face an election in 2021, it will be a question of whether they can show the needed municipal leadership to develop a modern property tax framework.
A burden on future taxpayers
Aaron Wudrick, federal director, Canadian Taxpayers Federation, @awudrick
With federal deficits projected for the indefinite future, rising federal debt will mean growing interest payments, diverting money away from programs, services and tax relief. Combined with sluggish growth, an aging population and a shrinking worker-to-dependents ratio, it all adds up to a rising tax burden on future taxpayers.
While some commentators point to Canada’s relatively low federal debt-to-GDP ratio of around 31 per cent as a reason not to worry too much, this paints a misleadingly rosy picture of overall public debt, as it excludes provincial and municipal debt. Once all levels of government are accounted for, Canada’s debt-to-GDP ratio is closer to 88 per cent.
Households and demographics
Low savings rates reflect overburdened consumers
Doug Porter, chief economist, BMO Financial Group
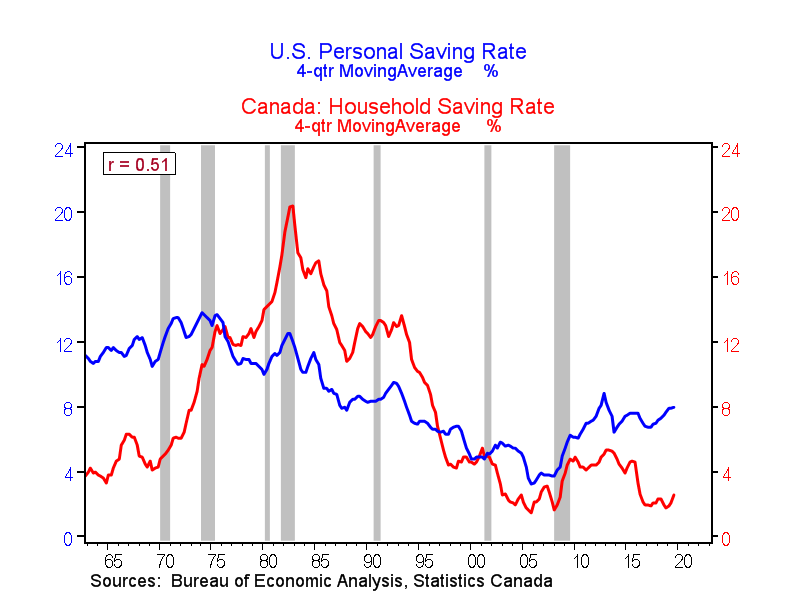
Why is Canada’s personal savings rate so low? And, is it a big concern? To briefly recap, Canada’s rate has picked up a bit recently, but from just 1.8 per cent in 2018, close to the lowest since the early 1960s. This comes at a time when, in contrast, the U.S. rate has managed to grind up to around eight per cent, or close to its long-run norm. (Notably, Canada and the U.S. have very similar long-run average savings rates of just over eight per cent.)
While many factors are at play, the three biggest weighing on Canada’s rate are demographics, sustained low real interest rates, and the housing boom (i.e., outlays on housing are crowding out savings to an extent, or even acting as a substitute).
But, another conclusion is that it’s actually the U.S. that is a bit of an outlier here—and that’s a positive story. The U.S. household sector has done an admirable job of repairing its balance sheet in the wake of the devastating ‘08 financial crisis, and is thus in good shape at this advanced stage of the cycle. Canada, not so much. Overall, we expect a relatively lean year for Canadian consumer spending in 2020, with a low savings rate cushion just part of the bigger picture of an over-burdened consumer.
Abstinence doesn’t make the economy grow stronger
Frances Woolley, professor of economics, Carleton University, @franceswoolley
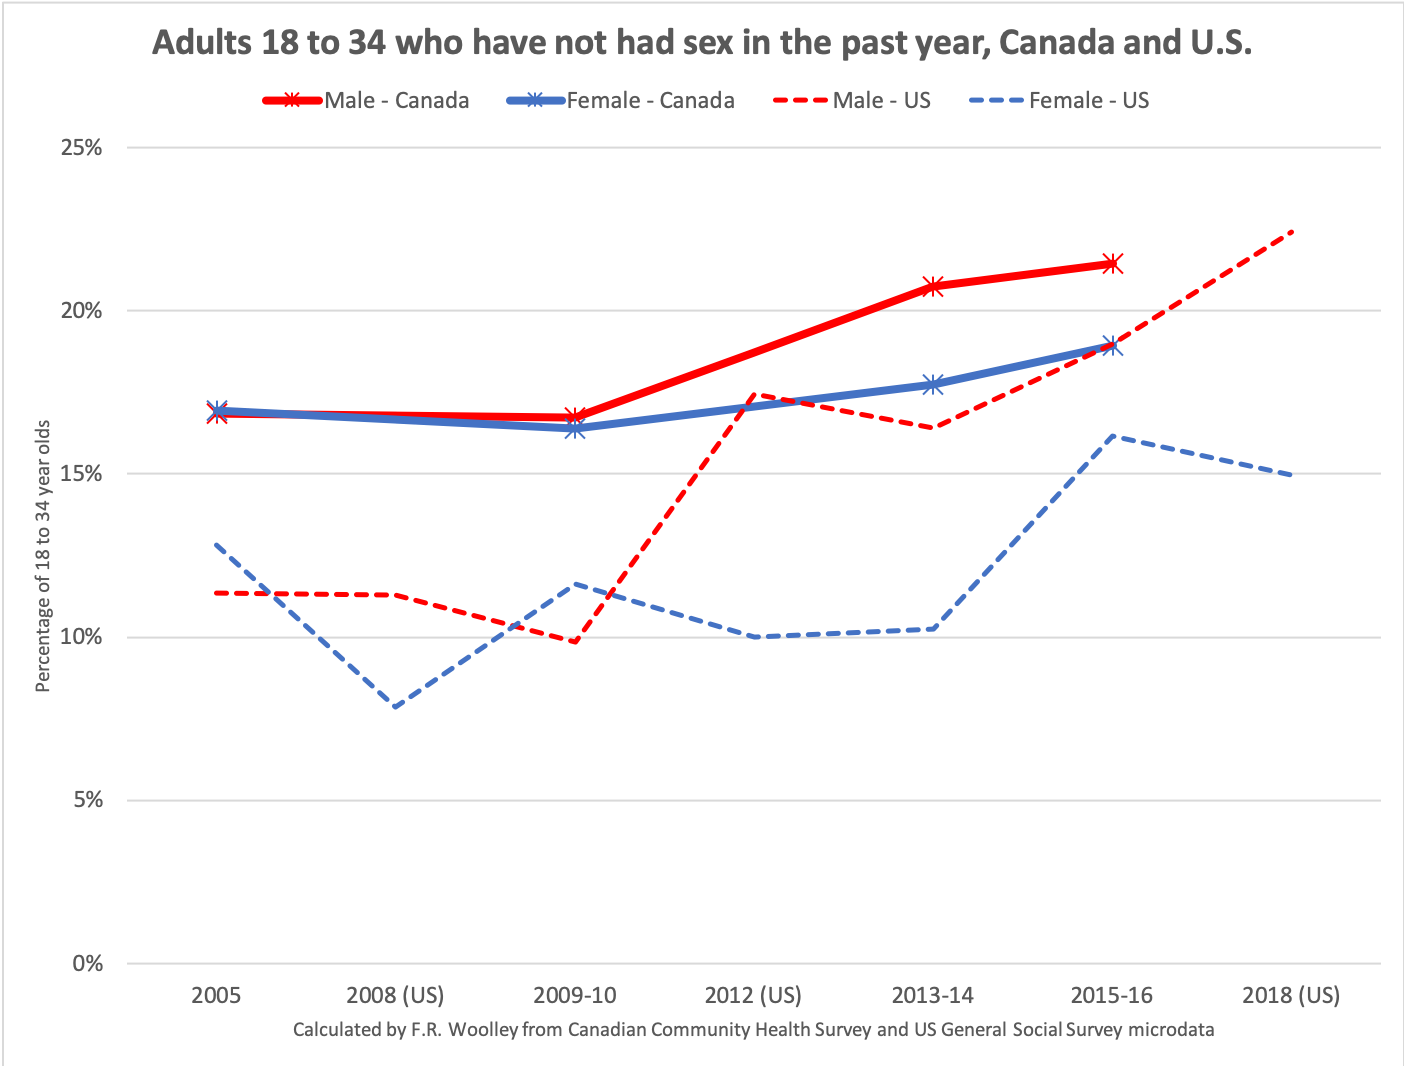
2019 saw Americans worried about a “sexual recession”. The 2018 US General Social Survey found that 22 percent of young men between the ages of 18 and 34 had not had a sexual partner in the past year – double the number of men who were sexually inactive ten years ago. These numbers are based on a survey that included just 639 young adult respondents. By way of contrast, the Canadian Community Health Survey gathers information on sexual behaviour from over 20,000 adults between the ages of 18 to 34. While it does not collect information from all provinces in all years, its sheer size means it is a good gauge of trends over time. Canadian data confirms the upwards trend in the percentage of 18 to 34 year-old men who are not sexually active. A more detailed analysis of the numbers found the drop-off was driven by reduced rates of sexual activity by men in younger age groups, particularly 20 to 24 year olds. Men in their 40s are as sexually active as ever.
In Canada, as in the U.S., women’s reported sexual activity has not decreased as much as men’s has. This may reflect increasing numbers of women dating men older than they are, leaving more young men without partners. Alternatively, women (or men) might be more (or less) willing to honestly report sexual activity now than they were in the past. One thing is clear, however: same sex relationships do not explain the divergence between men’s and women’s sexual activity rates. The activity rates reported above include both same- and opposite-sex partners. Without counting same-sex partners, the divergence between men’s and women’s levels of sexual activity would be even wider: in the 2015-16 CCHS, 2.7 percent of young adult women reported having a same-sex partner in the past year, compared to 3.0 percent of men.
We cannot say why sexual behaviour is changing, but we can say why it matters. If young adults delay or forgo having sex, they are likely to delay or forgo the things that sex leads to, such as long-term relationships, children, and buying and furnishing a home — and that could create a whole other kind of sexual recession.
What retail sales say about Canada’s economic divide
Frances Donald, chief economist and head of macro strategy, Manulife Investment Management, @francesdonald
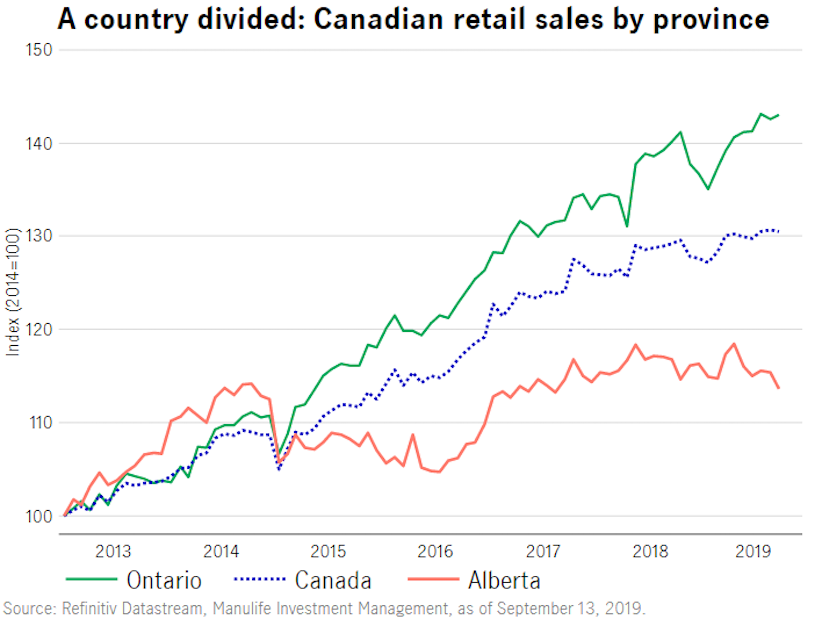
Canada remains a country divided. The aggregate, national data that most frequently gets headlines tells us a picture of a broad Canadian economy that is muddling through amidst heightened global geopolitical tensions and a world manufacturing slump. But Canada’s various provincial economies are weathering these (and other) storms entirely differently. While Ontario booms with growing reliance on housing activity and 47 per cent of the country’s total job creation since 2014, Alberta struggles against persistently weak energy prices, a substantial drop in business investment and only eight per cent of Canadian jobs creation over that same period. A provincial breakdown of retail spending since 2014 shows a strong Ontario consumer that spends above the national average, but a struggling Alberta household that cannot find momentum. That leaves the Bank of Canada – or any policy maker who can only set policy on the national level – in a particular predicament. And it suggests that we should spend 2020 considering how national data may not be telling us everyone’s more individual story.
Atlantic Canada needs more people
David Chaundy, President and CEO, Atlantic Provinces Economic Council (APEC), @david_chaundy
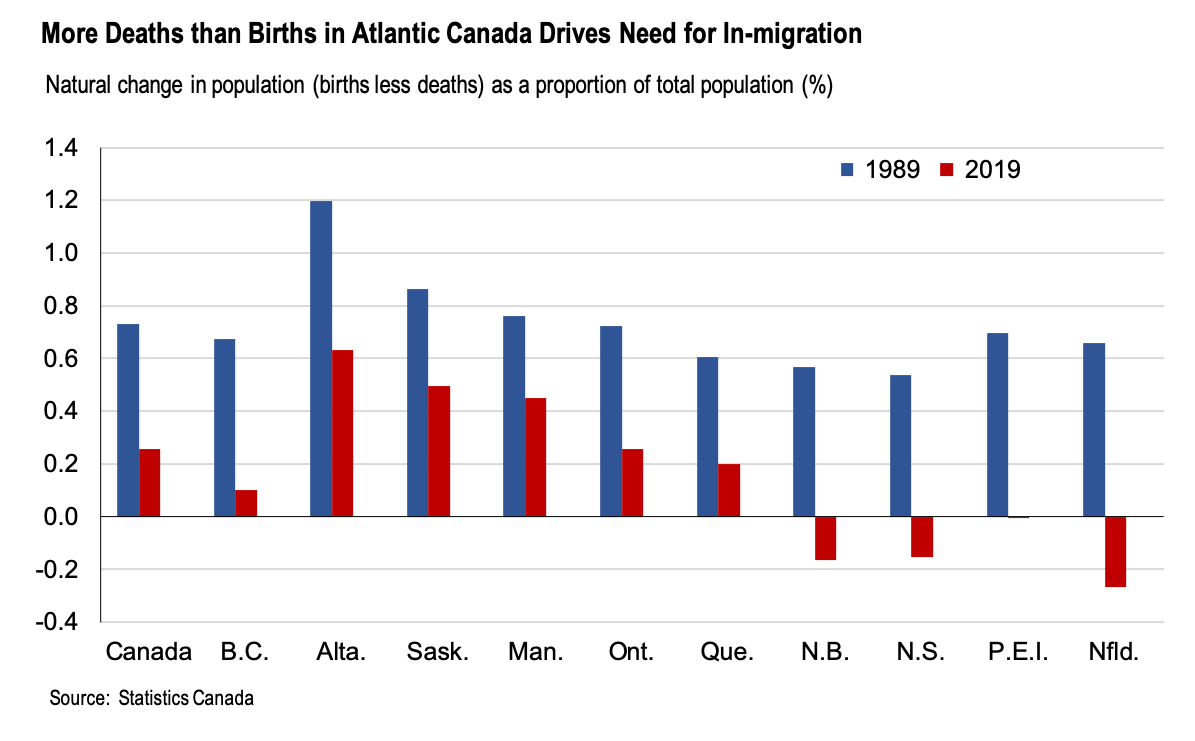
As baby-boomers age and reach the end of their lives, the natural change in population (births minus deaths) continues to decrease across Canada due to the rising number of deaths. In Atlantic Canada, three provinces are already experiencing a larger number of deaths than births, meaning their populations will decline without in-migration. This trend is apparent across Canada with the Atlantic provinces providing a glimpse into what other provinces can expect as their own populations continue to age.
These demographic trends are driving the push for immigration in Atlantic Canada to maintain population levels, with immigration an increasingly important contributor to population growth across the nation. These trends are also the prime reason behind reports of labour challenges – 50 per cent of Atlantic businesses report challenges finding or retaining labour, posing a significant constraint to their growth. These pressures will not diminish, with only 7 young workers entering the region’s labour force for every 10 older workers retiring. This is a far cry from three decades ago, when there were 20 young workers entering the labour market for every 10 retiring. Other provinces are starting to see the same dynamics and pressures. Employers across Canada will therefore need creative people strategies, including hiring international workers and those from underrepresented groups, as well as greater automation, to meet their production needs.
Dads are taking on diaper duty
Tammy Schirle, professor of economics, Wilfrid Laurier University, @tammyschirle
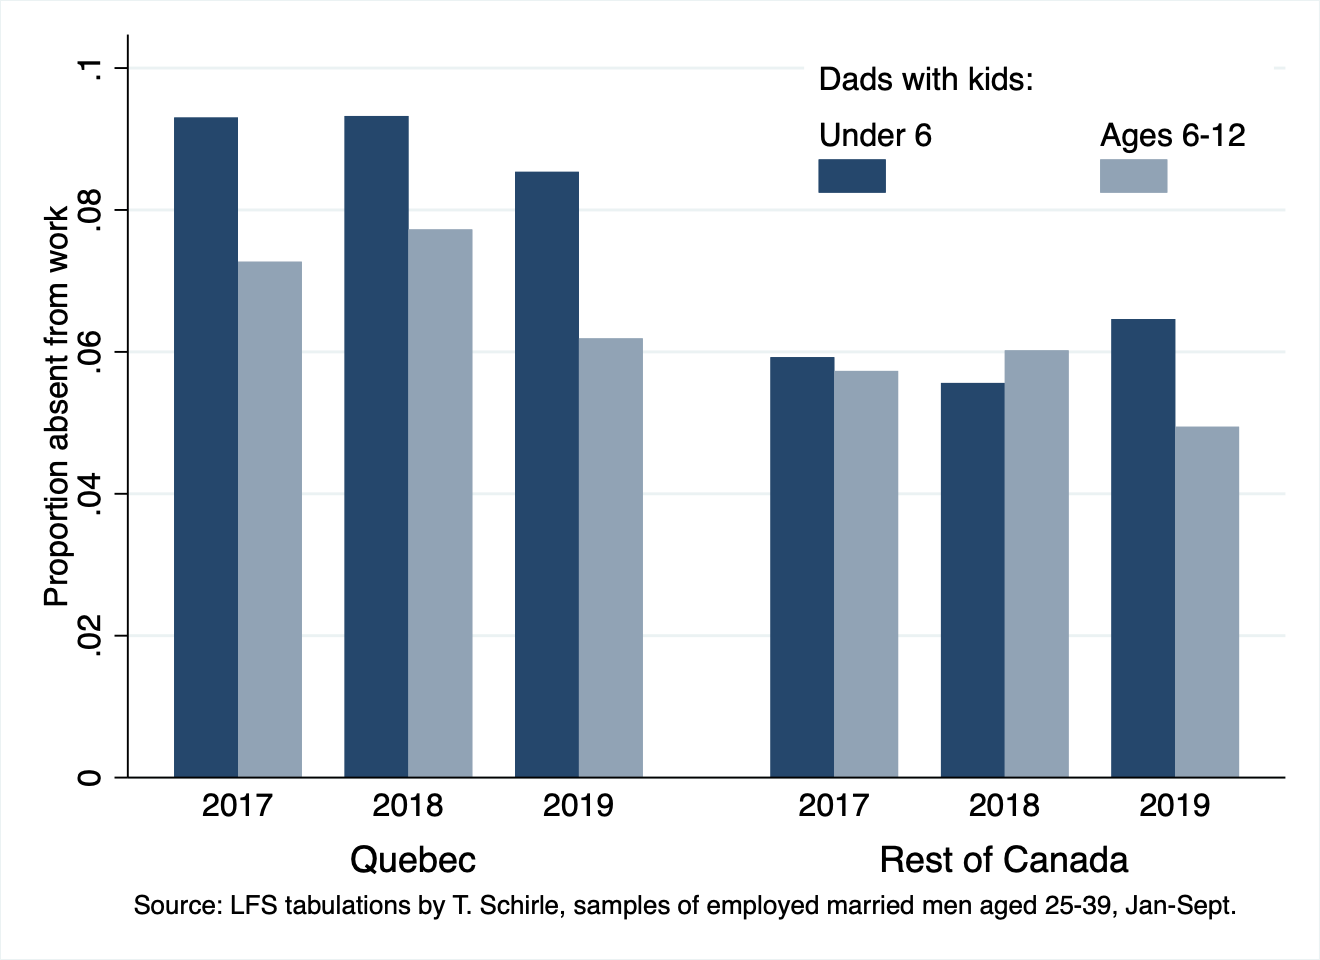
In March 2019, Canada introduced the Parental Sharing Benefit, designed to encourage a second parent to take time away from work with EI parental leave and be more engaged in the full-time caregiving of their children. Early indicators suggest dads are taking it on. In the data, this appears as an increase in the proportion of employed dads with young kids that are absent from work, relative to dads with older kids. This gap – which has been observed among Quebec dads for whom such a program has long been in place – appears to be opening for dads in the rest of Canada in 2019. If recent proposals to increase the generosity of EI parental benefits move forward, will the gap widen as more dads take on diaper duty?
Canada’s labour force depends on immigration
Pedro Antunes, chief economist, the Conference Board of Canada
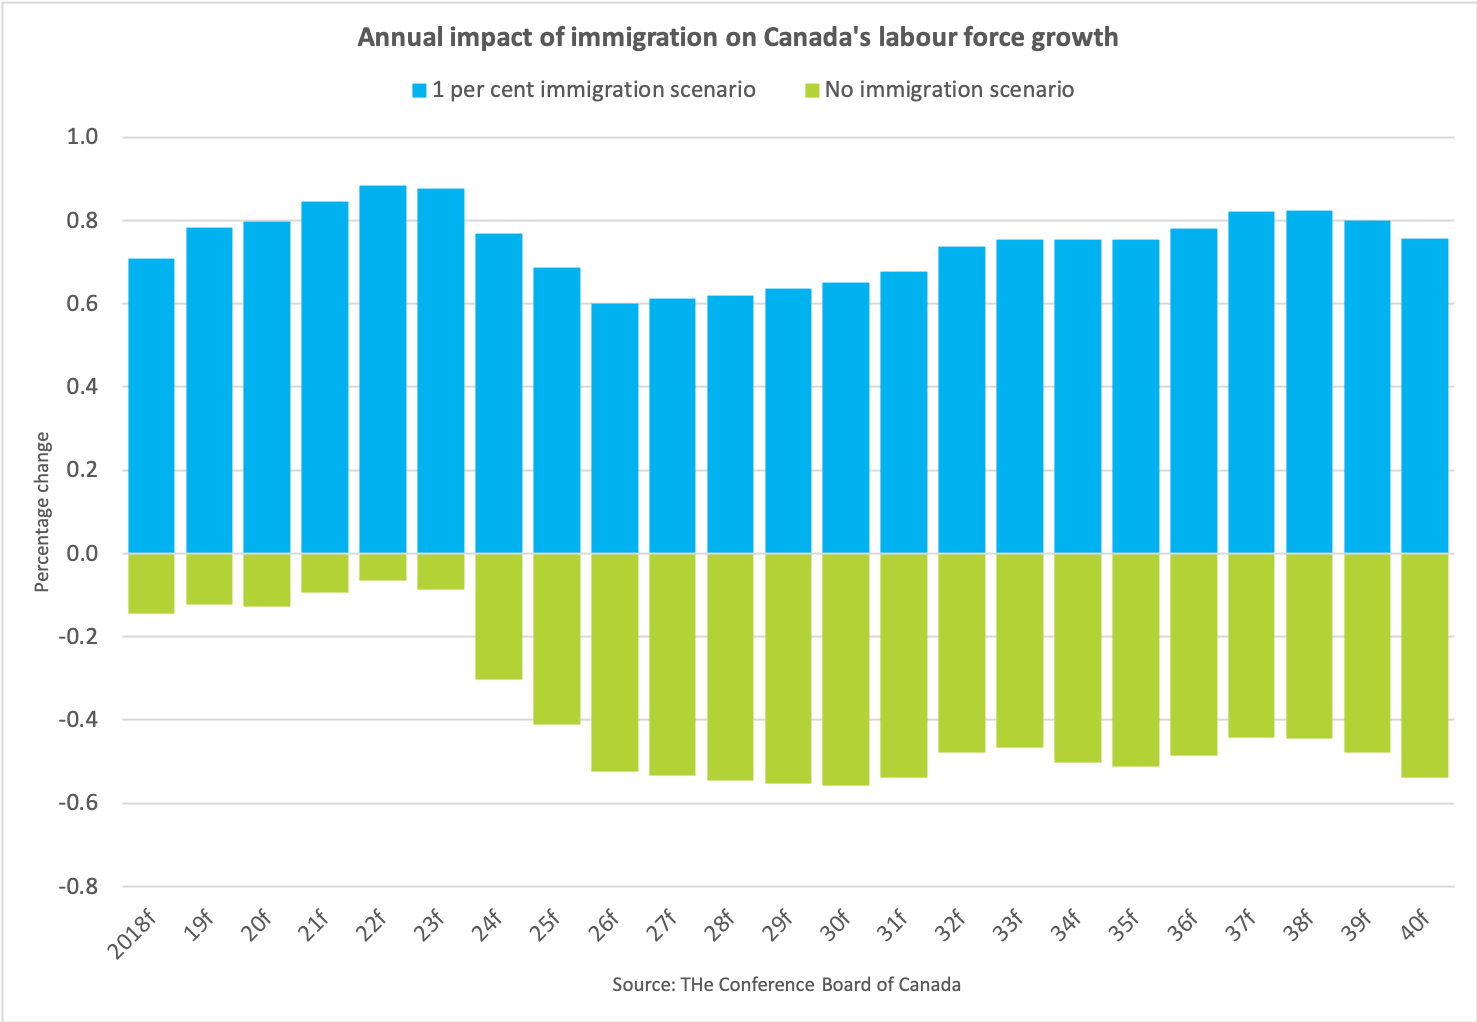
Job growth in Canada was exceptional this year—2019 will likely see the creation of roughly 400,000 jobs. While this is great news for workers, a tight labour market is a challenge for employers. And the challenge will amplify in coming years given our underlying demography. While early boomers have reached retirement, late boomers, as young as 53 and a much bigger cohort, are still in the workforce hastily building their nest eggs. Over the next decade, retiring boomers will place a heavy weight on Canada’s supply of workers.
To get a sense of the magnitude of this challenge, we forecast Canada’s supply of new workers under the assumption that Canada closes its doors to newcomers. With no immigration, the number of Canadians entering the workforce, mostly school leavers, is less than those leaving the workforce, mostly for retirement. The number of available workers would immediately start to drop—with the labour force declining by 0.1 per cent annually over the next few years, but the decline accentuating in later years. Beginning in 2026, Canada would lose an average of 100,000 workers per year. In 2040, the labour force would stand at 18 million people compared with 19.8 million in 2018.
Gradually increasing immigration levels would add 5.3 million workers to Canada’s labour force between 2018 and 2040—an average annual labour force growth rate of 0.7 per cent. In 2040, Canada’s labour force size would be nearly 23.3 million people; at that point, immigrants will account for 30 per cent of Canada’s labour force compared with 24 per cent today.
Insolvency watch in Ontario
Scott Terrio, manager of consumer insolvency at Hoyes Michalos, @ScottTerrioHMA
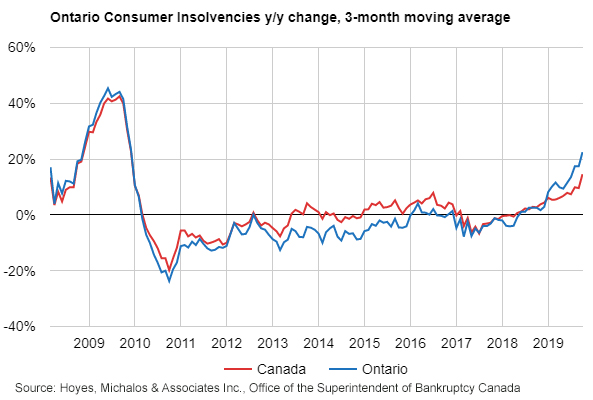
The pace of annual growth in consumer insolvencies in Ontario is rapidly accelerating, an indication that the consumer debt bubble is beginning to implode. Ontario has posted double-digit growth in seven of the last nine months and the three-month moving average has now accelerated to 22.5 per cent, while the three-month growth rate for Canadian insolvencies increased to 14.6 per cent. The majority of consumer insolvencies in Ontario continue to be filed by non-homeowners as seen by the relatively flat trend in our Homeowner’s Bankruptcy Index. Non-homeowners with high consumer debt are increasingly unable to sustain their monthly debt payments yet do not have the equity capacity of homeowners to refinance.
The future of Canadian workers
Armine Yalnizyan, economist and the Atkinson Fellow on the Future of Workers, @ArmineYalnizyan
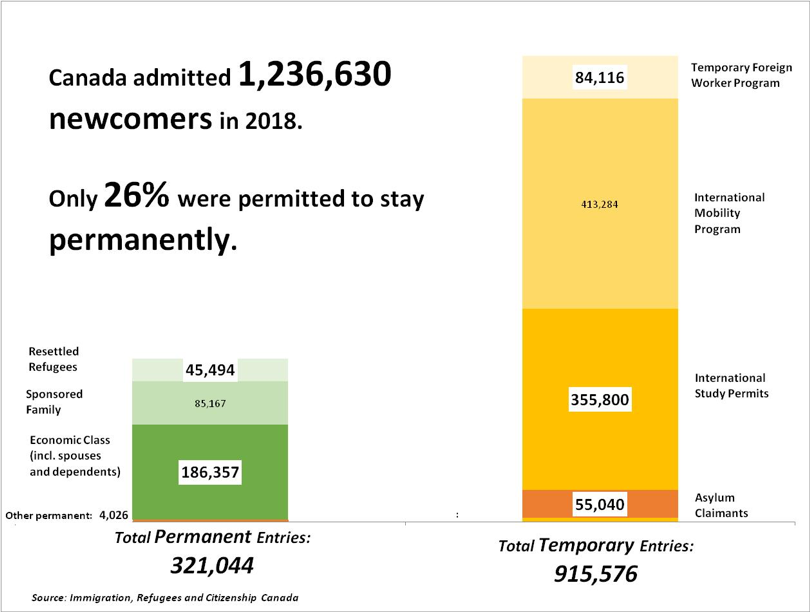
Economic growth comes from labour force growth, productivity growth, and export growth. Exports are being hammered by trade wars; productivity growth has mostly stalled in Canada since 2015; and population aging combined with falling fertility rates means newcomers will be the only source of net labour force growth as early as 2025. As newcomers become a major economic driver, both their levels and nature matter.
Newcomers enter Canada as both permanent and temporary residents. By 2018, for each new permanent resident, almost three temporary residents were admitted to work and/or study. This “nation of immigrants”, which only began use of foreign contract or seasonal labour in the late 1960s, has become increasingly reliant on temporary foreign workers. The relationship between temporary and permanent entries to Canada has reversed since the early 2000s. Few temporary residents ever make the transition to permanent status.
The balance of intake between temporary and permanent residents shapes the evolution of the labour market and society. More turnover and more temporary workers slows wage and benefit growth for all workers, not just the temporary ones.
Population aging presents a historic opportunity to improve economic outcomes for Canadians from groups who were historically disadvantaged in both learning and earning opportunities. But helping Canadians improve their skills and contributions won’t be enough to offset widespread labour shortages in both public and private sectors over the next decade. We’ll also need more workers from outside Canada. What share of our labour supply should be permanently temporary, by policy design?
Falling debt service costs mean more disposable income
James Marple, senior economist and managing director, TD Economics, @marpelino
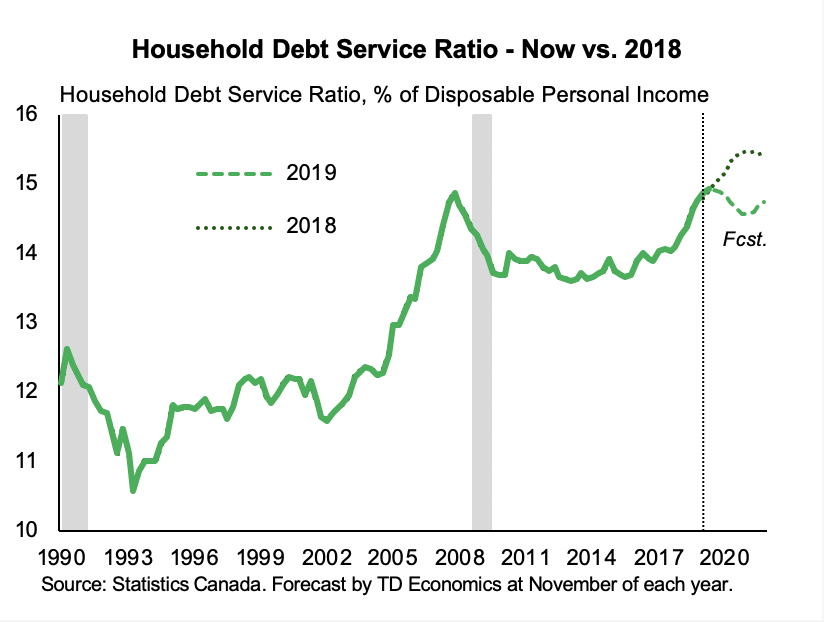
It’s a well-known fact that Canadians are bearing a lot of debt. Household debt relative to income is close to an all-time-high. Debt growth has been sustained by a falling interest rates that have, up until recently, held down the cost of servicing debt (relative to income). This started to change around 2017, as higher interest rates began to push up the cost of servicing debt. But, just as we thought debt service costs could only go higher, another twist in the story has occurred over the course of this year. Instead of moving higher, interest rates have fallen. This has changed, for the better, the outlook for household debt service costs. Based on the relationship with interest rates that we track, debt service is more likely to fall than increase over the year ahead, in contrast to our previous expectations. The difference is almost a full percentage of disposable income available to households to spend on anything else. Consumer spending has been one of the more disappointing elements of Canadian economic activity, but with a healthy labour market, rising wages, rebounding housing markets, and high, but at-least-not-increasing-further debt servicing costs, household spending may be one of the things to surprise on the upside over the next year.
Watch for deteriorating household finances
Brendan LaCerda, economist, Moody’s Analytics Canada
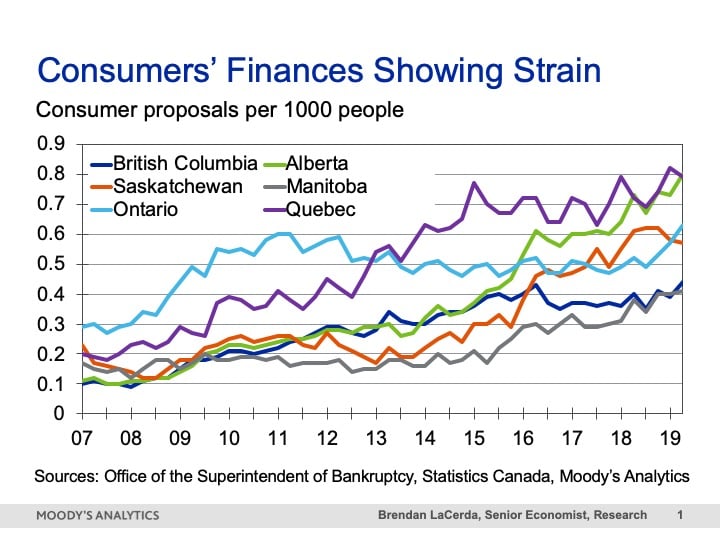
Canadians’ high household debt has attracted much concern, but, except for the Prairies, mortgage delinquencies, credit-card loss rates and personal bankruptcies remain remarkably low. What’s the problem? The trouble is that the number of consumers negotiating modifications to the terms and balances of their debts, i.e. proposals, is rising even as income growth is accelerating. Consumer appear keen on avoiding the pain associated with a full-fledged bankruptcy, but if the labor market starts to weaken there might not be an alternative. We will be monitoring consumer proposals in 2020 for any indication that loan performance might deteriorate more significantly.
Growing population and falling investment: A recipe for declining living standards
Livio Di Matteo, Lakehead University
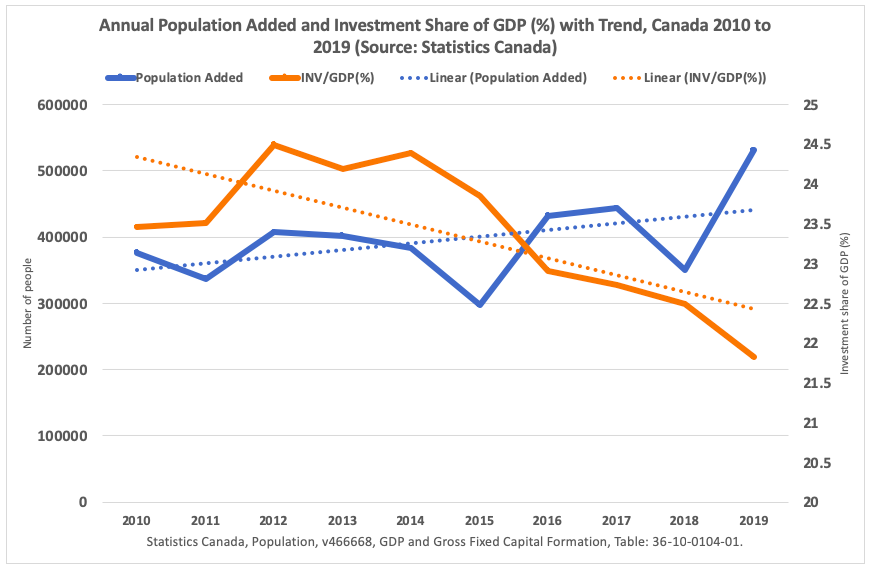
The last decade has seen a boom in Canadian population growth fuelled by immigration and natural increase. In 2019, Canada will see 531,407 people added to its population – a banner year – bringing it to 37.6 million. This is the second largest annual population increase ever – 1949 saw the largest at 624,000 and 1957 the third largest at 527,000. A growing population is great for expanding domestic markets as well as providing for economies of scale when it comes to production and service provision. As Prime Minister Mackenzie King once famously remarked, “Canada has too much geography” making for low population density outside of a few regional clusters.
However, growing populations need private investment in productive capacity and new technology as well as more public infrastructure such as roads, sewers and transit. And of course, more people need more places to live – more housing. Yet, total gross fixed capital formation in Canada as a share of its GDP has been falling over the last decade. While one might argue that the investment to GDP ratio since 2010 may be within historic ranges, other periods of rapidly rising population were marked by growing investment-output ratios. The 1950s saw a peak at 26 percent while the wheat boom era saw a peak in 1912 at over 30 percent. It remains that having capital stock and infrastructure spending as a share of output decline while ever larger amounts of people are being added to the economy does not bode well for future economic productivity and the resulting standard of living.
Back to the top
Housing market
Home is where the economy is
George Pearkes, macro strategist, Bespoke Investment Group, @pearkes
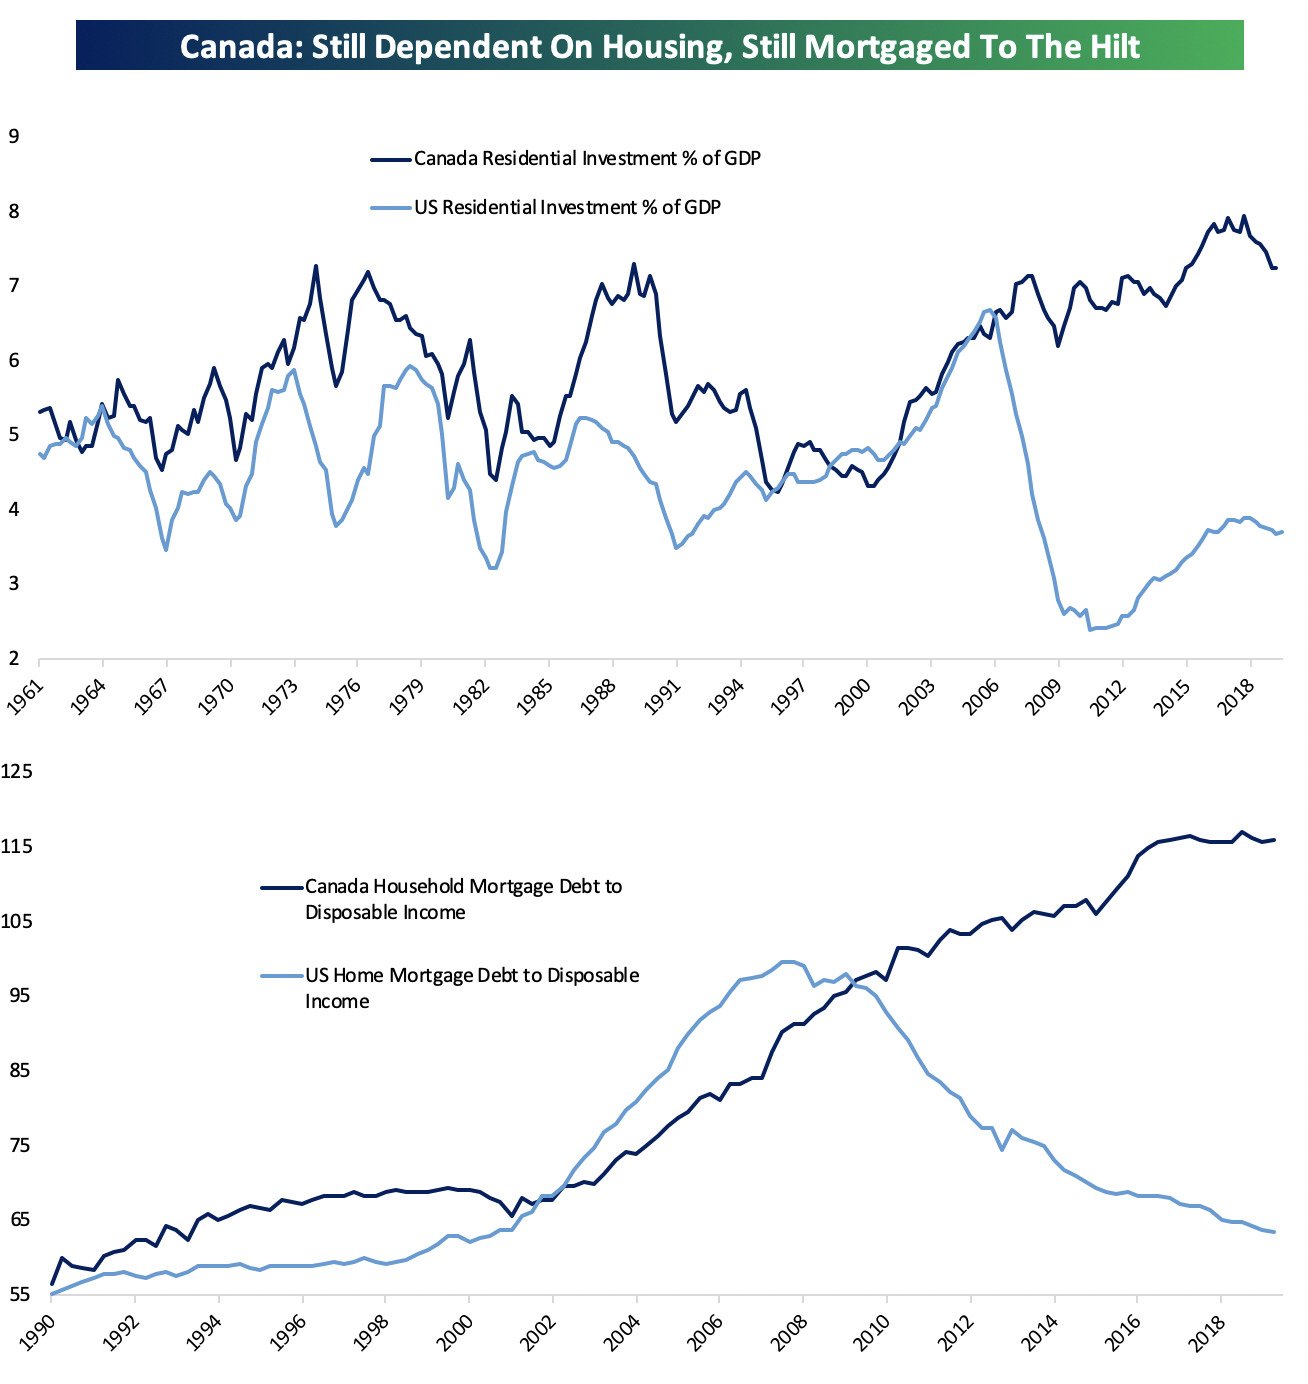
It’s no secret that Canada’s economy remains dependent on housing. While policy changes in Ontario and B.C. have helped to slow home price growth in recent years, investment in residential fixed assets has continued apace. While the U.S. economy has only spent about 3.8 per cent of GDP per quarter on gross private residential investment, Canada is spending roughly twice that … even after large declines since the peak at the end of 2017. While U.S. households have deleveraged their mortgage obligations from almost 100 per cent of disposable income on the eve of the global financial crisis to a 19 year low of 63.5 per cent today, Canadian households did the opposite, and recent slowing of residential investment activity has merely stabilized the rate at about 116 per cent of disposable income rather than new highs. In both examples, Canada’s economy and sectoral balance sheets remain drastically more oriented towards the housing market than the U.S.
Record high debt levels and heading higher
Helmut Pastrick, chief economist, Central 1
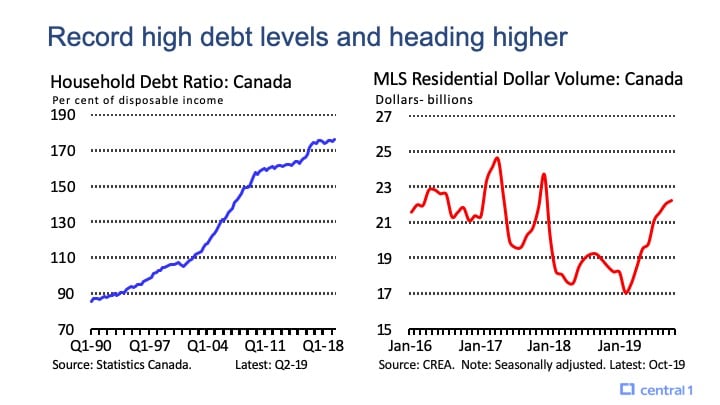
Record high household debt in Canada is a heightened concern to financial regulators, housing policymakers, economic commentators and forecasters, among others. For example, the Bank of Canada has cited this as one of the top risks and vulnerabilities to the financial system, and hence, the economy for several years. Regulators instituted tighter mortgage lending criteria led by the mortgage rate stress test for borrowers. The recent slowing in household debt has alleviated this concern, but not entirely, because debt remains at record levels.
Slowing in the household debt ratio is mainly attributed to the decline in housing sales and prices that played out in 2016 to 2018. Fewer mortgages were initiated as a result of weaker housing market activity and the debt ratio leveled out into 2019. This is about to change.
An upturn in housing market activity began in early 2019 in response to lower mortgage rates and the recent home price decline. Unit housing sales are up considerably from their low and home prices are rising once again. This combination is pushing up the dollar volume of home sales and associated mortgages. The dollar volume of MLS residential sales during 2019 will be seven per cent, or more, higher than last year.
More is coming in 2020. Housing sales and prices will rise from still low, and possibly lower, mortgage rates, job and income growth, pent-up demand, and supply constraints in some markets. The existing First Time Home Buyer plan and the enhanced version promised during the federal election will contribute to gains in sales and prices.
Under these conditions, the household debt ratio will re-accelerate and set new highs in 2020. How will policymakers and financial regulators react? Are they satisfied that the financial system can safely manage more debt, or will they implement tighter lending and institutional regulations? At a minimum, they will become more uncomfortable and concerned about rising household debt.
Too few rentals for a booming population
Barry Schwartz, chief investment officer, Baskin Wealth Management, @BarrySchwartzBW
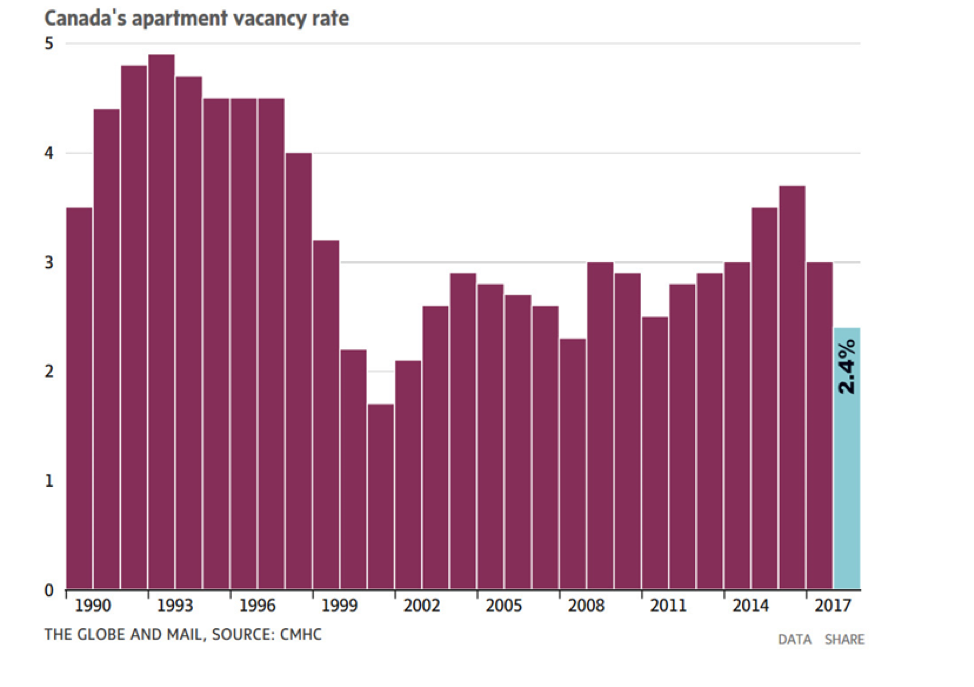
Over the 12-month period ending August 31, 2019, Canada’s population increased by over 531,000, the largest increase in our history. And with Canada’s liberal immigration policy, we expect more population records to be set going forward. Couple the population growth with housing affordability and changing demographics and you get a perfect storm in the rental market. Canada’s apartment vacancy plummeted to 2.4 per cent in 2018. In Toronto and Vancouver, apartment vacancy rates are at shockingly low levels, just one per cent. Don’t expect this to change any time soon. New apartment builds are in short supply and as a result, rental rates are rising fast. New projects and innovative solutions are needed immediately.
Putting Canada’s empty homes in context
Jens von Bergmann, founder of Mountain Math Software and CensusMapper, @vb_jens
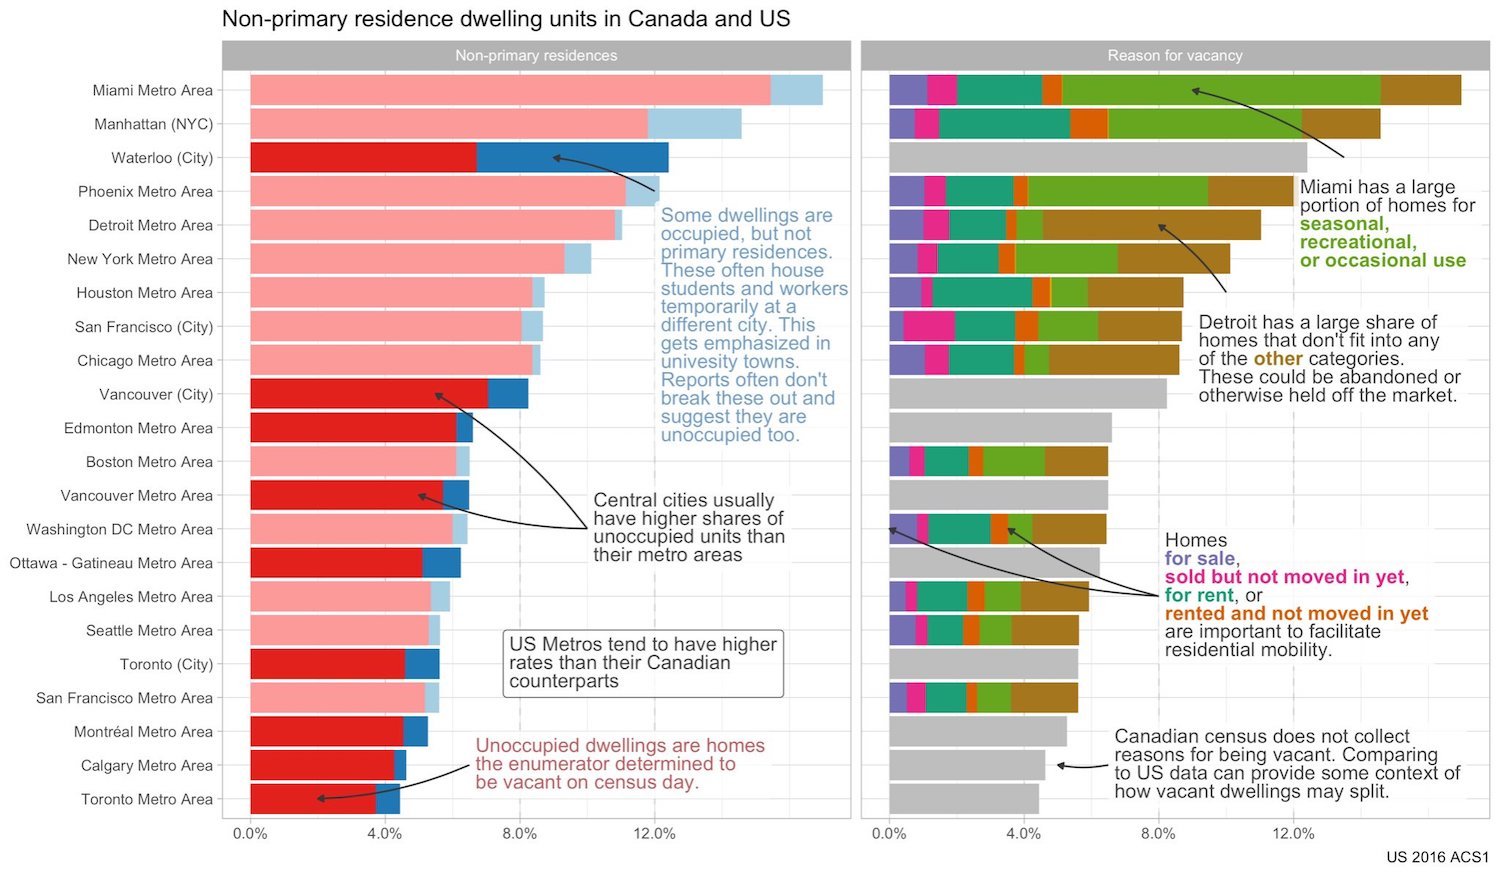
Empty homes are a hot topic as several key regions in Canada and the U.S. are facing persistently low rental vacancy rates and soaring rents (as highlighted in my submission to Charts to Watch from last year). Canadian data on empty homes is hard to interpret, empty homes often get lumped together with homes occupied temporarily by people that have their primary residence elsewhere like students or people moving for short-term jobs.
More importantly, Canadian unoccupied statistics don’t distinguish “good vacancies”, i.e. mobility-enabling vacancies when homes are for rent, for sale or otherwise between moves, from “overhoused vacancies”, i.e. homes used occasionally or recreationally, and from “bad vacancies”, i.e. homes permanently held off the market for speculative reasons. Empty homes taxes, like the one in use in Vancouver, typically target the latter two. A comparison with U.S. data can help gauge normal ranges for “good vacancies”.
Reversal of a long-term shift into home ownership
Will Dunning, housing market consultant, @LooseCannonEcon
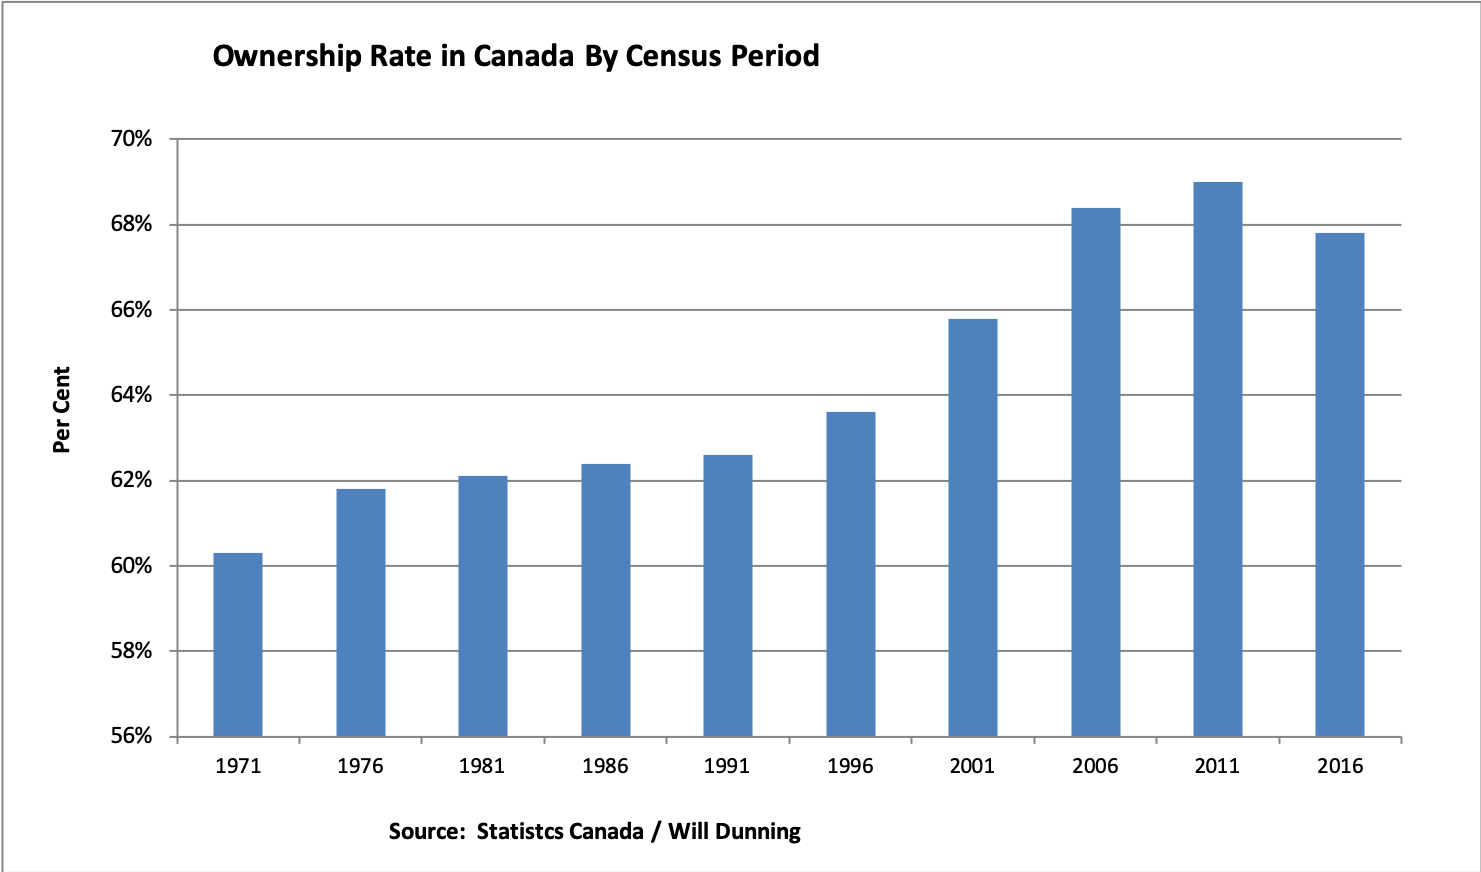
In calling this a chart-to-watch, I’m being a bit facetious: we only get the data via the Census, and the next data point (from the 2021 Census) won’t be available until sometime in 2022. While we can’t update this chart every month, it is still worth thinking (and indeed arguing) about. A decades-long shift into home ownership (from 60 per cent in 1971 to 69 per cent in 2011) resulted from rising middle-class prosperity, falling interest rates, reduced down payment requirements, and from an expansion of lower-cost options (including condominium apartments, as well as the creation of basement suites within homes, which help owners meet their financial obligations).
The reversal after 2011 was, I would argue, largely due to the elimination of 30-year amortization periods for insured mortgages (in July 2012) which made it more difficult for potential home buyers to obtain financing. Mortgage rules have been further tightened (via the mortgage stress tests) with the consequence that the home ownership rate will fall again in 2021. That’s unfortunate, because owning remains a better financial decision than renting for people who might buy now, both through the wealth creation of rising home values but also lower monthly costs. I’ve heard people say that Canadians have an unhealthy obsession with home ownership. Now, I don’t know if we are “obsessed”, but I do know that if home ownership makes us better off, wanting it is not “unhealthy”.
A overheated housing market hits renters
Stephanie Hughes, finance writer, @StephHughes95
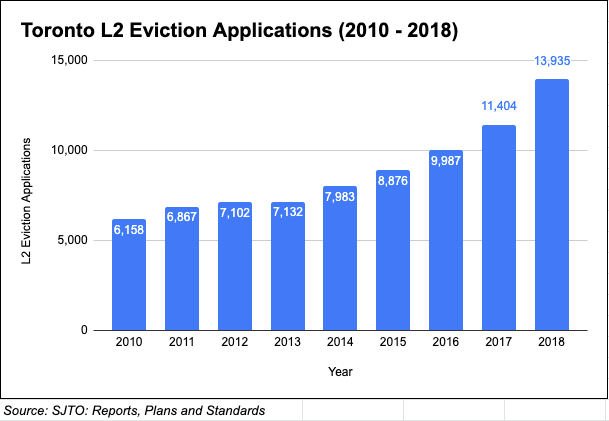
Toronto’s surge in house prices and rent rates have tangible impacts on the city’s residents. L2 evictions have been on the rise (evictions caused by reasons other than non-payment of rent) as Toronto’s landlords evict tenants, often to place the unit back on the market for a higher price. As condo prices and maintenance fees soar, this trend of seeking out higher-paying tenants to maintain a profit has more than doubled since 2010 and continues to escalate. Many of these evictions do not require reporting to the Landlord and Tenant Board, meaning that the number of L2 evictions are likely much higher. This presents a significant financial burden to renting Canadians who require first and last month’s rent for a new apartment in the Greater Toronto Area.
Investors hold swing supply in the housing market
Anthony Scilipoti, CEO, Veritas Investment Research
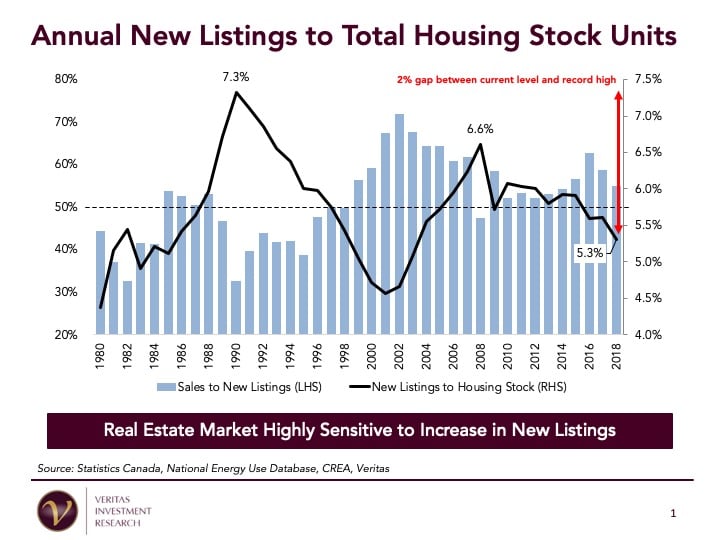
Supply and demand is a key component of any market – the housing market is no exception. Based on our historical research, we have identified a notable inverse relationship between the change in New Listings to Housing Stock (NL/HS) ratio and housing prices. As shown in the chart, when the ratio of new listings to hosing stock rises – that is, the number of houses available for sale as a percentage of the total rises – prices decline. The relationship held true in the last two downturns – 1990 and 2008. The historical average NL/HS ratio has been approximately 5.8 per cent and currently sits at 5.3 per cent, which marks a 15-year low.
In our view, the current ratio is not likely to be driven higher by new construction; instead, new listing supply is most likely to be generated by real estate investors and speculators who are incurring negative cash flows (i.e. rental income net of mortgage cost and other direct property expenses). A CMHC study in 2014 based on tax filing data, estimates rental investment property stock of five per cent nationally and a Stats Can study estimates foreign ownership of real estate at roughly eight per cent of housing stock. Based on the historical metrics, a two per cent increase in new listings over a 12 month period would drive the NL/HS ratio from a 15-year low to a record high. Local real estate markets with a higher proportion of real estate investors and speculators (i.e. GTA and GVA) are more vulnerable to a potential supply shock. We encourage Canadians to monitor the number of for-sale postings as a key metric to gauge where real estate prices are going.
Watch the housing market’s sales-to-new listing ratio
Stephen Brown, senior Canada economist, Capital Economics
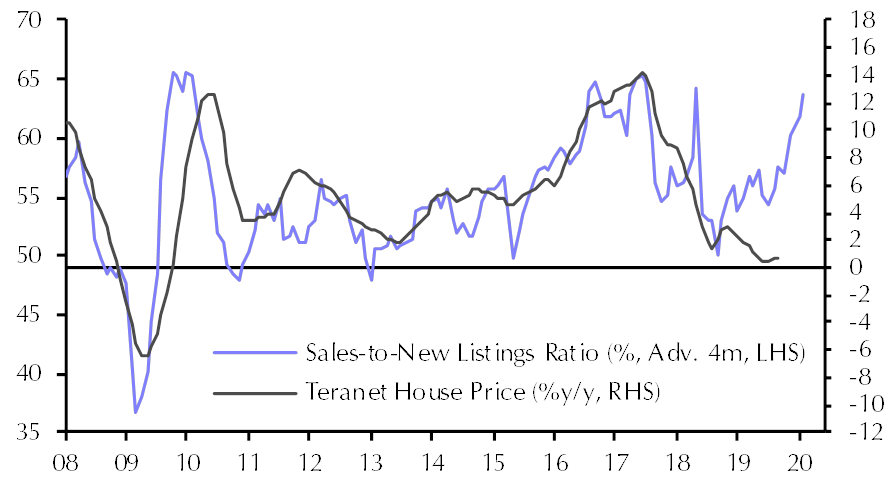
Central banks around the world cut interest rates in 2019, but the Bank of Canada sat on the side-lines. This chart shows why. Thanks in part to the sharp drop in Canadian mortgage rates that followed global policy loosening, the Canadian housing market is on a tear again. While sales are back at their long-run averages, new listings have remained muted. This could be because homeowners in cities where prices have fallen are waiting for them to recover again before selling. The divergence has pushed the sales-to-new listing ratio up sharply and it is now pointing to annual house price inflation of over 10 per cent again, up from just one per cent in October. As the sales-to-new listing ratio has overstated house price inflation for the past year or so, we’re doubtful that it will accelerate by that much. But if did, the discussion might just as quickly turn to the potential for interest rate hikes from the Bank of Canada, rather than cuts.
Toronto and Vancouver home prices have started to rebound
Gregory Klump, chief economist, Canadian Real Estate Association
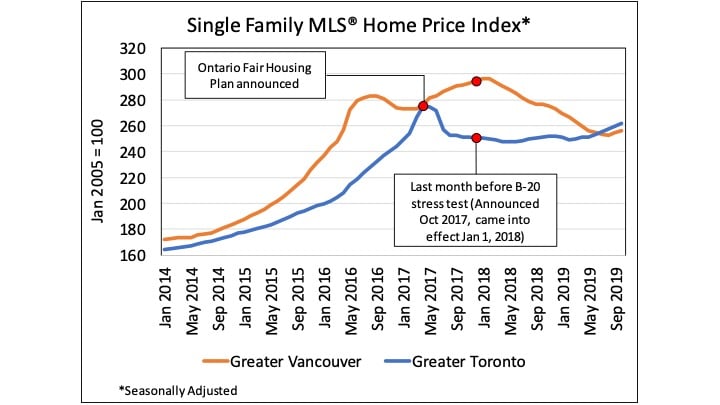
Toronto home prices dropped sharply in the wake of the Ontario Fair Housing Plan and were held down until mortgage rates started to drop earlier this year. Lower mortgage rates eventually led to a 15 basis point (fifteen-hundredths of a percent) drop in the Bank of Canada’s benchmark 5-year mortgage interest rate used to qualify mortgages under the B-20 mortgage stress test. Vancouver home prices suffered most under B-20, with the price for typical single-family home sales down close to a quarter million dollars between January 2018 and August of this year.
At the current pace of price growth, single family home prices in Vancouver won’t recover those losses until mid-2021. By contrast, Toronto single family home prices fell by less, have already recovered by more, and are on track to surpass their April 2017 peak by May 2020. Prices may surpass their previous peaks sooner because the balance between supply and demand in both of these housing markets has tightened considerably over the course of 2019.
If recent policy measures suggest past as prelude, further policy measures to sideline demand would further divert housing demand into the rental market. in the absence of additional supply, that would risk putting further upward pressure on rents. All levels of government need to figure out how to work together to start getting more supply built. Otherwise, prices for existing ground-related properties may continue to become even more expensive than they already are.
Back to the top
Inequality
Failure to close the gap between Indigenous and non-Indigenous graduation rates
Kelly Foley, associate professor of economics, University of Saskatchewan, @foley_kelly
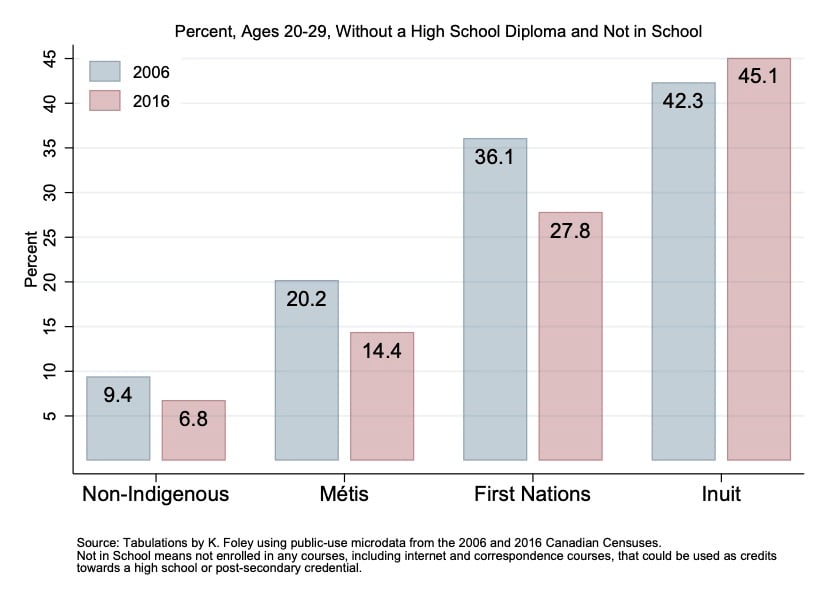
When looking for “what to watch,” it is tempting to concentrate on the rapidly changing variables. Instead, I want to draw attention to a trend that is not moving nearly fast enough.
In the 2016 Census, almost 28 percent of young people, ages 20-29, who identified as First Nations, had not completed high school and were not enrolled in any schooling. In comparison, Non-Indigenous young people were 21 percentage points, or four times, more likely to have completed high school. Relative to Non-Indigenous people, the gap in non-completion rates is widest for the Inuit, a difference of more than 38 percentage points.
Although non-completion rates have fallen among First Nations and Métis young people over the decade since the 2006 Census, there has been very little progress in closing the gaps with Non-Indigenous people. For the Inuit, there has been no progress in completion rates, meaning the gap has widened.
This matters not just because individuals without a high school diploma, or any other credential, are the most likely to experience poverty and high unemployment. These gaps are also a trend to watch because there is good evidence that historic, recent, and current policy and practice is not working for, but against, improving outcomes among Indigenous people. As just one example, in 2018, the Auditor General released a report concluding that Indigenous Services Canada failed in its responsibility to not only close education gaps for First Nations people living on reserves, but they also failed to even measure those gaps correctly.
Will the poverty rate keep falling?
Miles Corak, professor, Stone Center on Socio-Economic Inequality at The Graduate Center, City University of New York, @MilesCorak
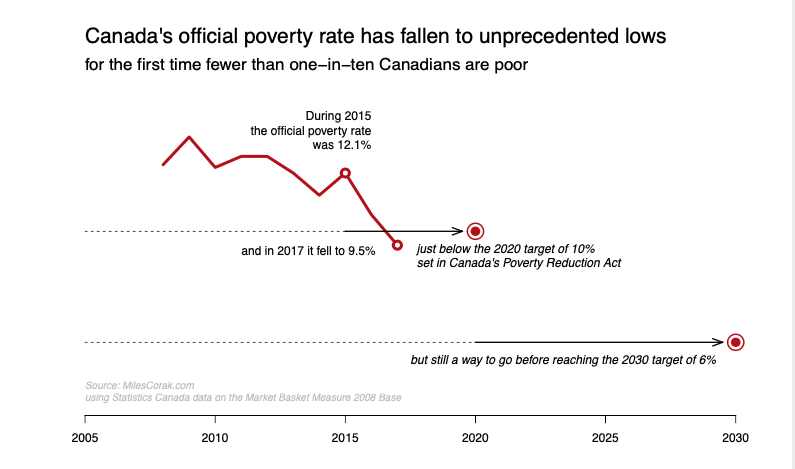
In June of 2019 the federal government passed the Poverty Reduction Act into law in order “to support continuous efforts in, and continuous monitoring of, poverty reduction in Canada.” It is now the law that Canada has an official poverty line, but it is also the law that the government will cut the poverty rate in half by 2030.
This makes the Official Poverty Rate a statistic to watch in 2020, and in the coming years. This is particularly so since the Poverty Reduction Act also set an interim target of lowering the poverty rate by 20 per cent by 2020, a goal that was ironically met before the Act even came into effect.
So will the federal government take its feet off the pedal in the meantime? Will it set another intermediate target of lowering poverty by 20 per cent from its 2018 level to guide progress to the 2030 target? Will knowing that the federal government is committed to these targets lead the provinces to slack off and let Ottawa do the heavy lifting, making the targets all the more difficult to reach?
In the coming weeks Statistics Canada will release information on the poverty rate for 2018, and Canadians will in the least begin the process of continuously monitoring progress and holding their governments to account.
Hidden inequalities
Jennifer Robson, associate professor of political management and Saul Schwartz, professor of public policy, Carleton University, @JenniferRobson8 and @saulschwartz
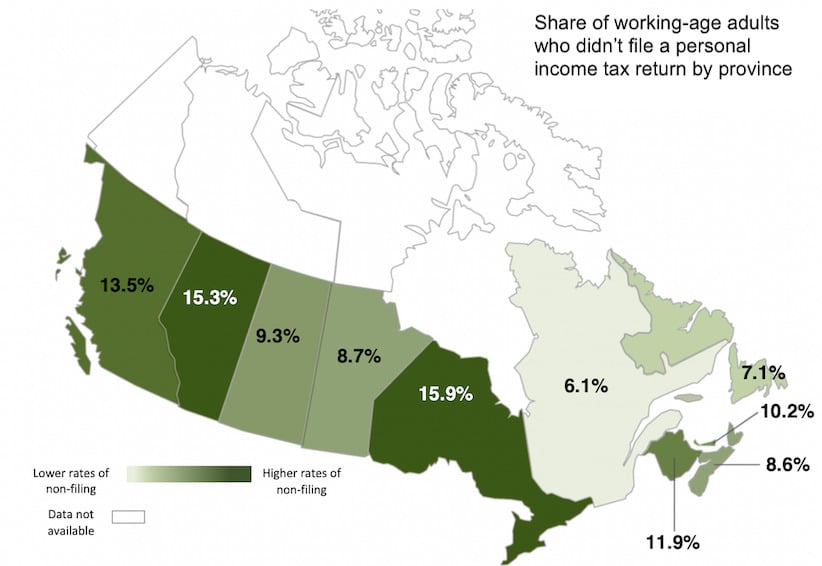
Ontario has the largest, and Quebec by far the lowest proportion of working-age adults (25-64 years old) who didn’t file a tax return in 2015, according to the most recent Survey of Financial Security. This matters for at least two reasons. If Canadians don’t file a tax return, they can’t collect several benefits meant to help people in need even if they meet the eligibility rules. If you can’t prove your income through a tax return, you can’t get child benefits, wage top-ups, and housing subsidies too. We estimate that a non-filer in 2015 missed out on an average of about $1,500 in benefits. Our estimate is roughly the same as the average tax refund claimed by low-income filers who filed a return with help from E4C, a non-profit community organization in Edmonton, that, like dozens of similar NGOs, is trying to make the household budgets of low-income Canadians a little easier to manage. Second, this matters for the data that governments use to make policy decisions, which increasingly comes from administrative records like tax returns. In cases where policymakers only look at data for tax-filers, they leave out income information about one in ten working-age Canadians, including one in six Ontarians and Albertans.
Jobs and incomes
The unsustainable reality beyond strong jobs numbers
David Doyle, head of North America strategy and economics research, Macquarie Group
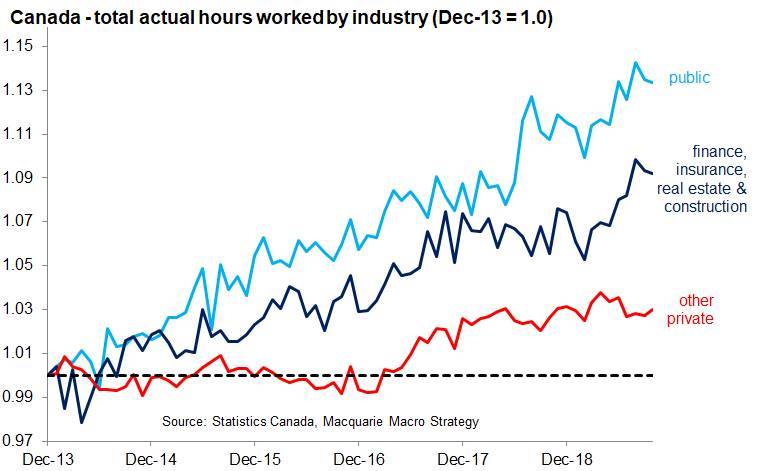
Several commentators have emphasized the strong headline national employment statistics in Canada in 2019, which have risen 1.9 per cent year-to-date through October. A broader measure of labour demand, however, tells a far different story. Total actual hours worked has grown at less than a third of this pace (0.6 per cent) year-to-date. More concerning than this subdued pace is the industry breakdown. Strength has come from unsustainable sources — both public sector industries and sectors related to real estate. In contrast, the private sector excluding real estate has experienced a decline in total hours worked year-to-date in 2019, continuing a struggle that has been in place for the past six years. In 2020, how these dynamics unfold will provide important information on how the output gap is evolving and whether Canada’s economy is moving further down an unsustainable path.
Boomers OK to keep working
Kevin Milligan, associate professor of economics, Vancouver School of Economics at the University of British Columbia, @kevinmilligan
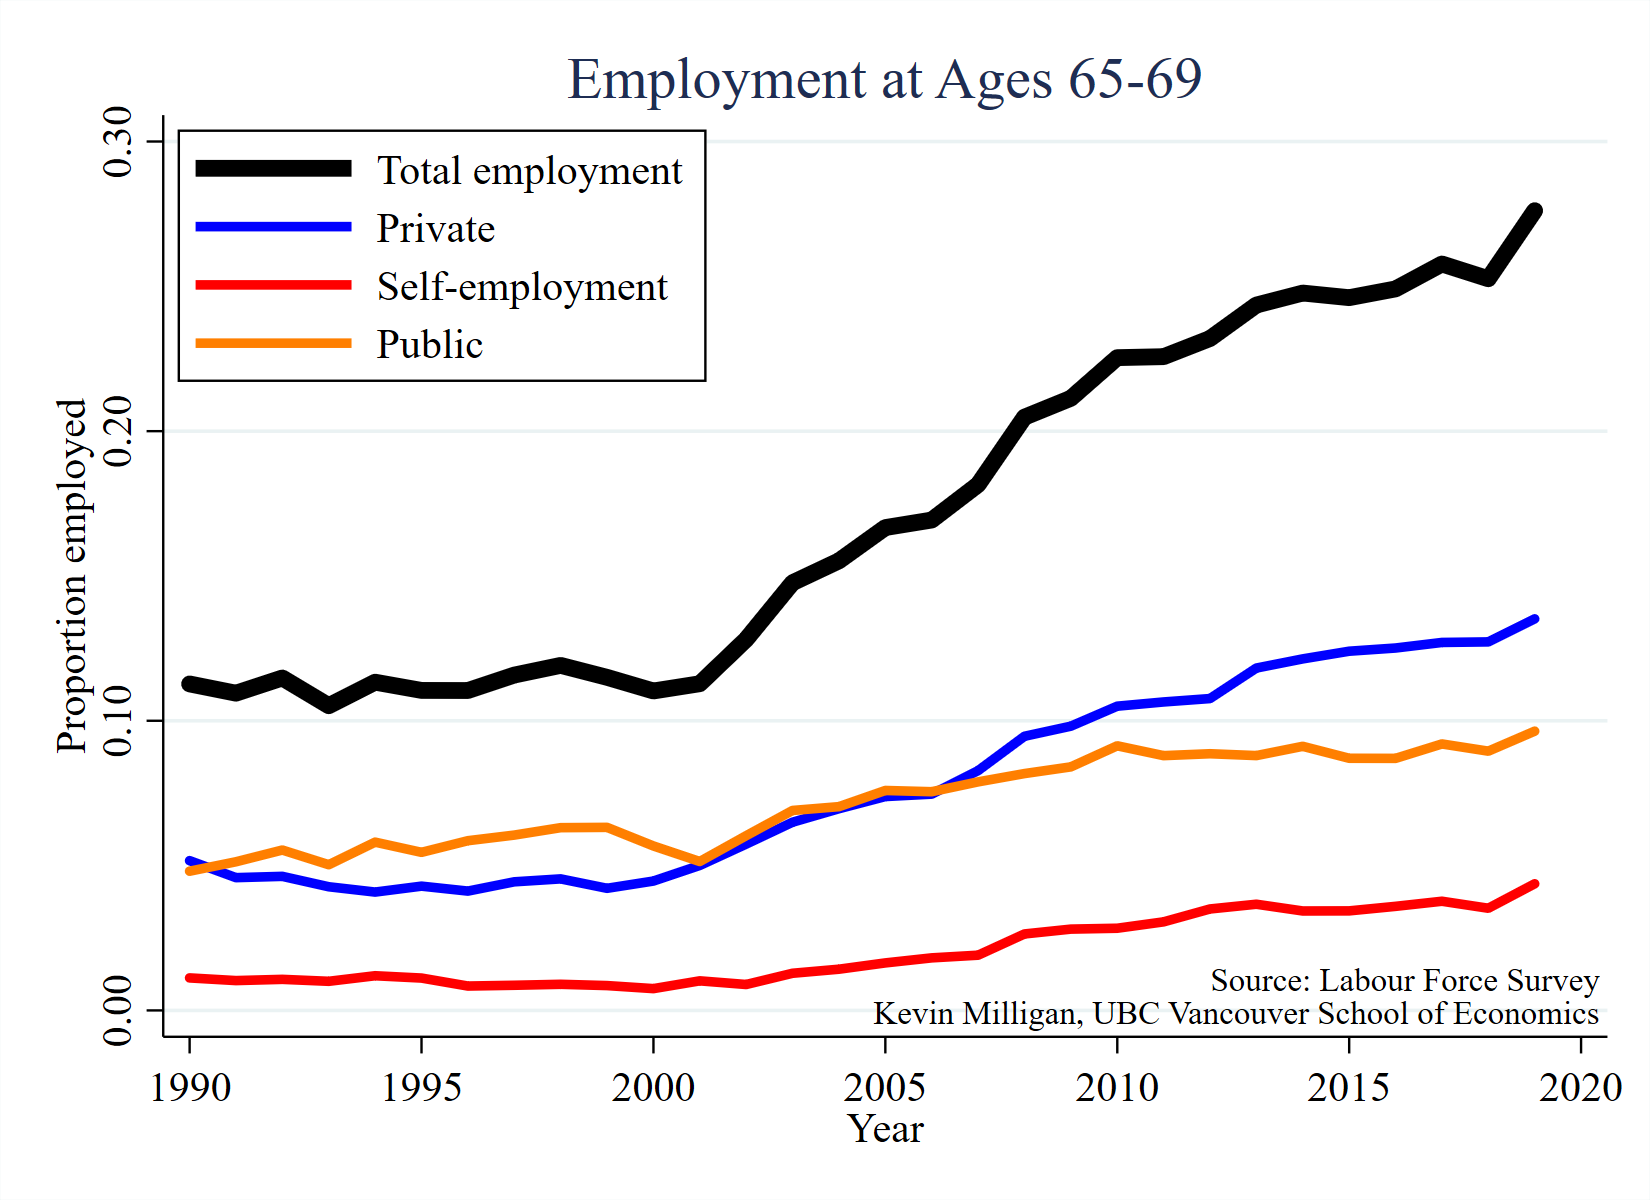
Employment at older ages in Canada is surging. The graph shows the proportion employed at ages 65-69 between 2000 and 2019. One quarter of Canadians now work at ages 65-69. This may reflect increasing longevity, lower returns on savings, or less physically-demanding employment.The trends are similar for males and females and hold across education groups. The main driver is employment in the private sector. Workplaces in all sectors need to adjust for longer working lives.
Higher wages needed to afford rising rents
David Macdonald, senior economist, Canadian Centre for Policy Alternatives, @DavidMacCdn
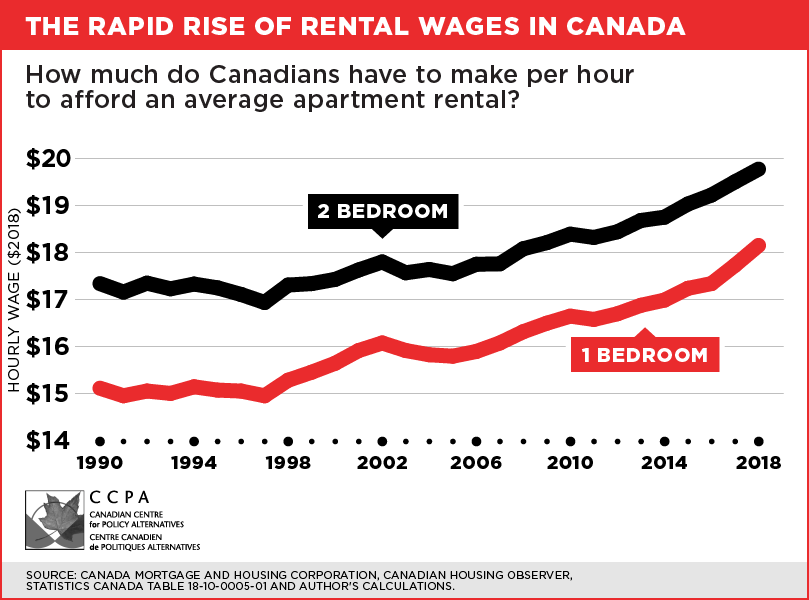
‘Housing affordability’ is often only understood as making it cheaper to buy houses, however a third of all families rent. High real estate prices are increasingly pricing families out of owning and pushing them to stay in rentals, which is leading to record low vacancy rates across the country. The hourly wage needed to rent the average two bedroom has been rising rapidly since 2000. It already exceeds any provincial minimum wage. Cities like Toronto or Vancouver blow the average out of the water, where you’d have to make $35/hour to afford an average two bedroom.
Where to for labours share of income?
Brendon Bernard, economist, Indeed Canada, @BrendonBernard_
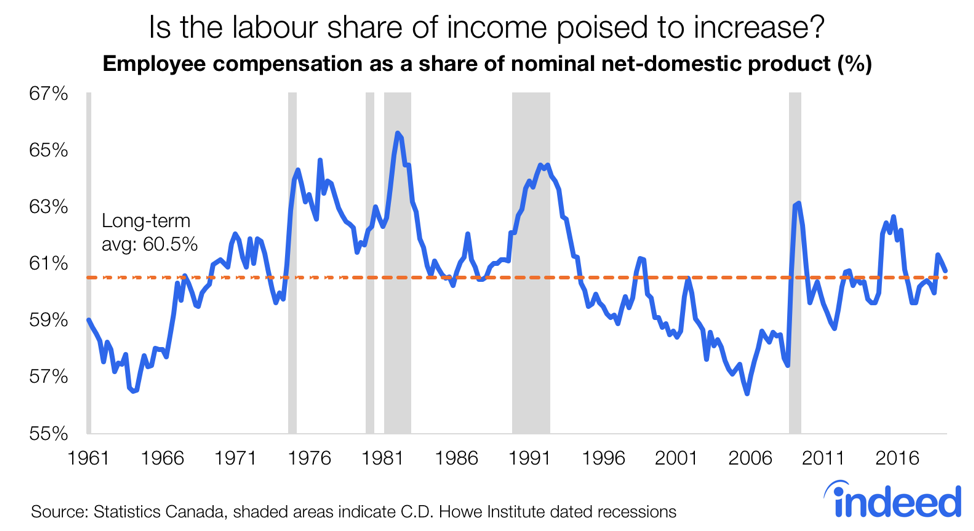
Canadian productivity growth has been weak, inflation has hovered around two per cent, and hourly wages have recently shown signs of life. Capturing the interplay between these moving parts is the labour share of national income, shown above as employee compensation as a share of net -domestic product (nominal GDP, less depreciation). As of this writing, the share stood at 60.8 per cent in the second quarter of 2019, slightly above its long-term average, and up half a percentage point over the past year.
Should recent trends continue, the labour share will drift further upward, likely at the expense of business profits. With productivity growth stuck in neutral, achieving meaningful real wage growth for Canadian workers depends on it. If this is the case, the next question is how long before employers start adjusting, and what kinds of ways will they go about doing so?
Swings in labour market dynamics
Ted Mallett, chief economist, Canadian Federation of Independent Business, @CFIBeconomics
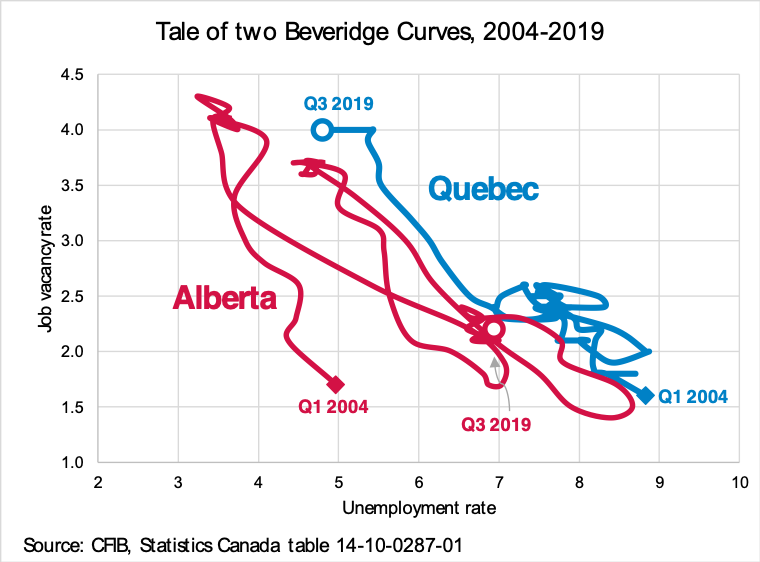
Canada’s job market dynamics have shifted dramatically in recent years. Since 2004, Alberta and Quebec have swapped places as cool and warm labour markets. The Beveridge curve for each province shows the inverse relationship between unemployment rates and the rates of job vacancies. In both provinces (but at different times) it appears that job vacancy rates peak at near the four per cent mark when labour markets tighten. Quebec’s curve looks like a structural shift in worker and job availability in a growing and diversified economy. Wide swings in Alberta’s curve over the years have been much more cyclical—as a result of the volatile resource sector. It remains to be seen in 2020 the manner to which job markets can recover there—either in a return to traditional resource jobs or in a retooling of economic drivers.
Work overload
Sal Guatieri, senior economist, BMO Capital Markets
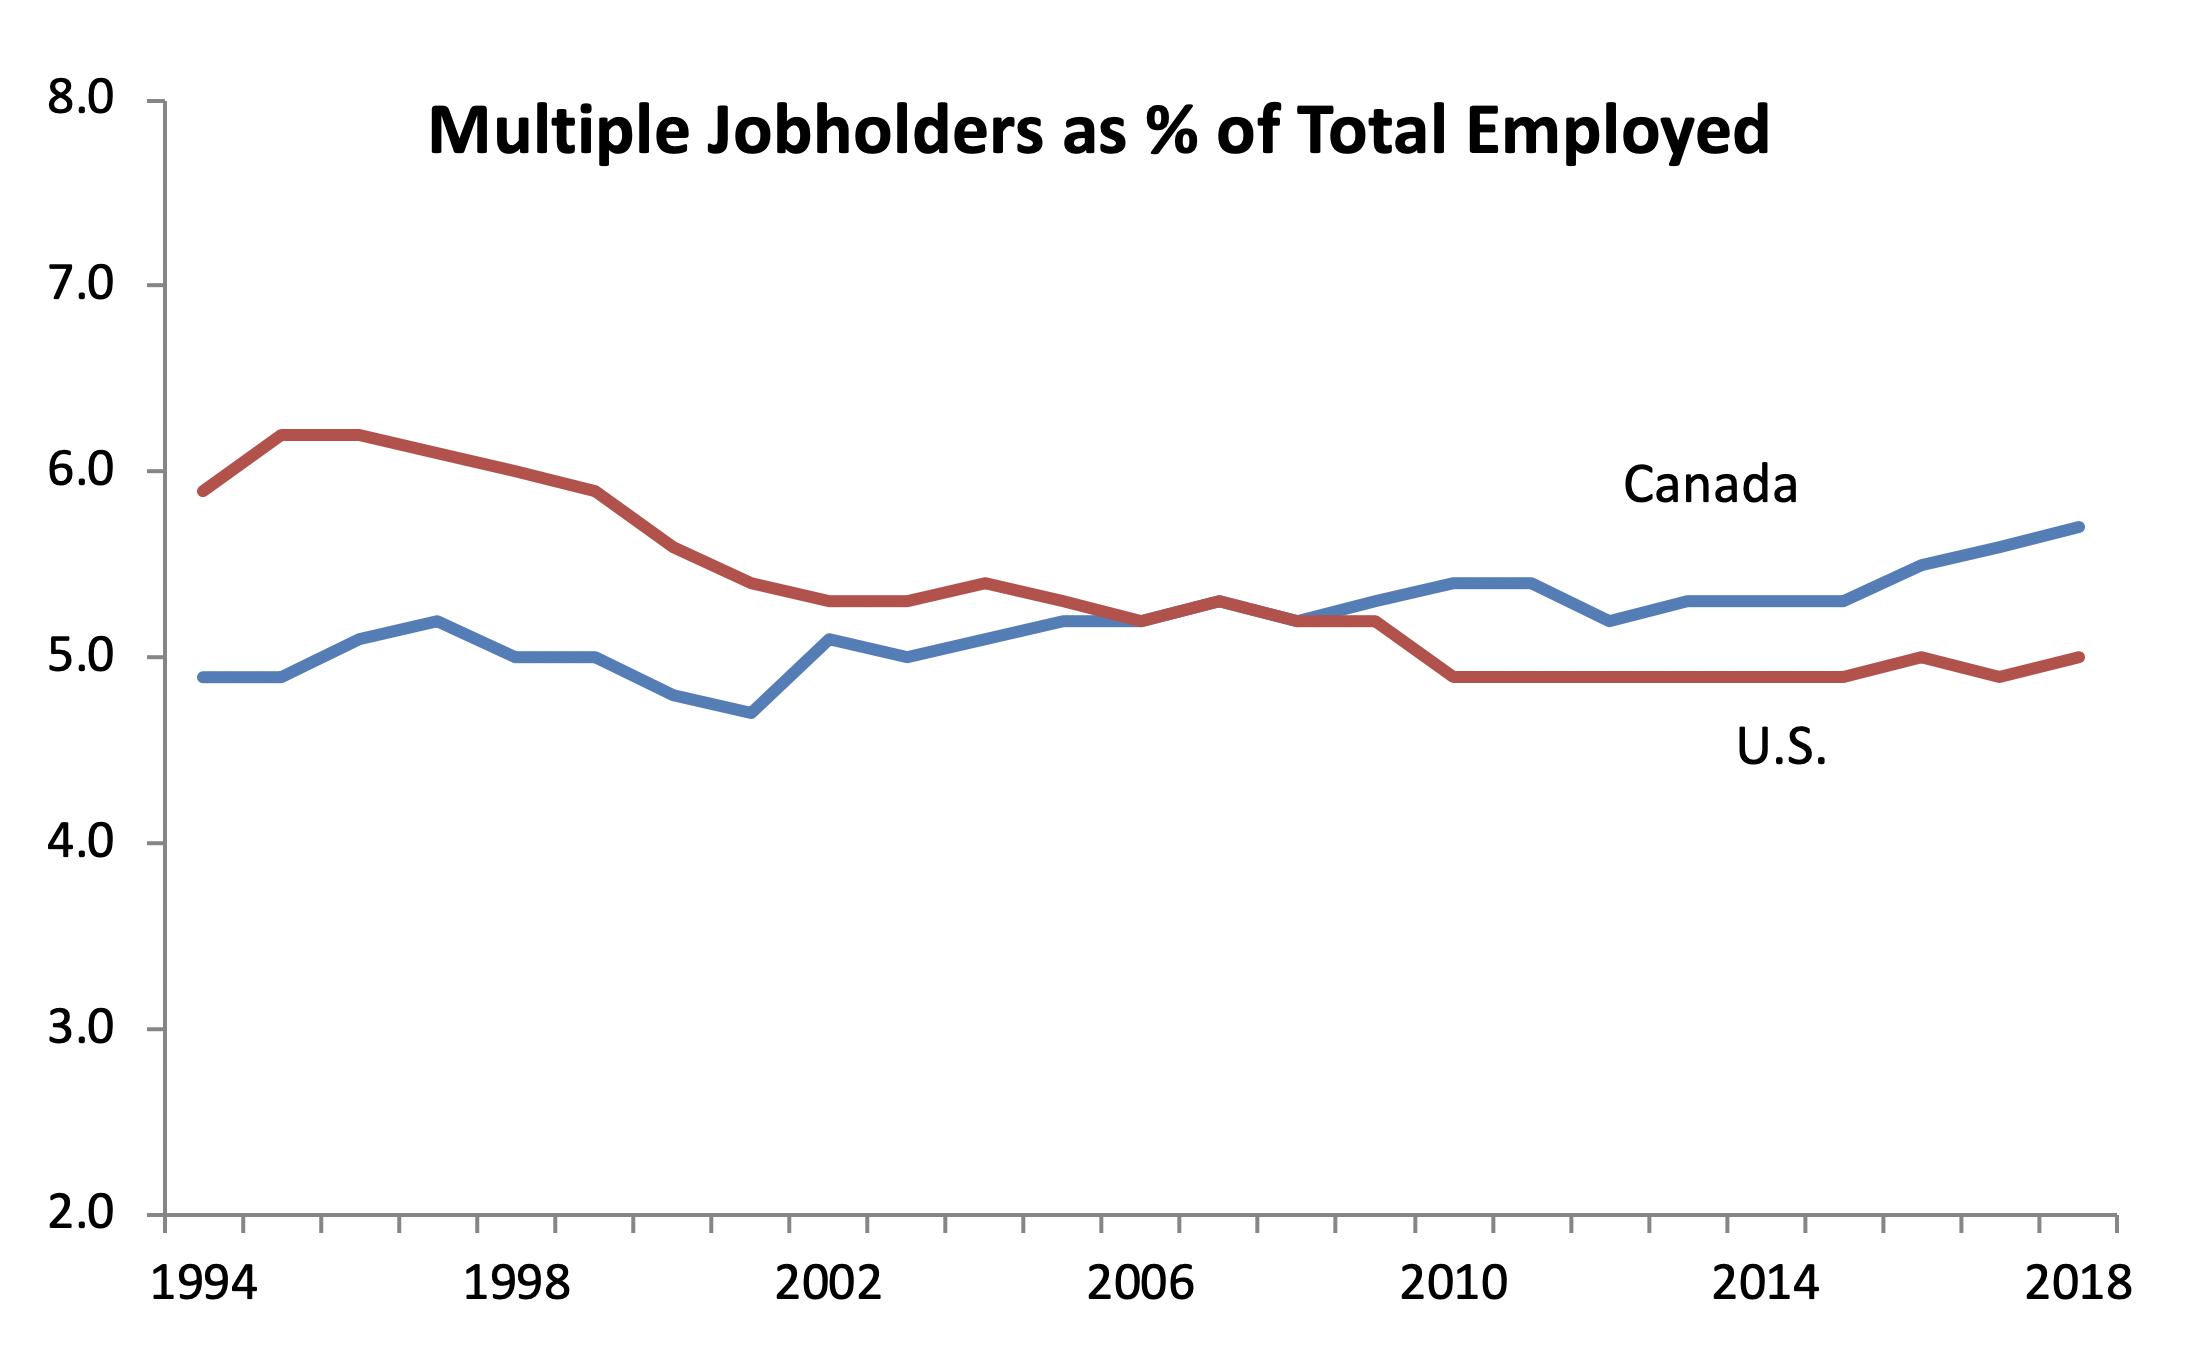
Over one million Canadians held down more than one job in 2018. The 5.7 per cent rate for all workers was the highest on record dating back to 1978 and has more than doubled since then. The rate for women (6.8 per cent) is well above that for men (4.7 per cent), partly because of their greater representation in two industries with the highest rates of multiple jobholding: healthcare/social assistance and education services. The rate of multiple jobholding is also higher in Canada than in the U.S. (5.0 per cent), reflecting a generally higher rate of employment and part-time work in Canada, and perhaps more affordable daycare options.
The ‘have nots’ are gaining
Mike Veall, professor of economics, McMaster University
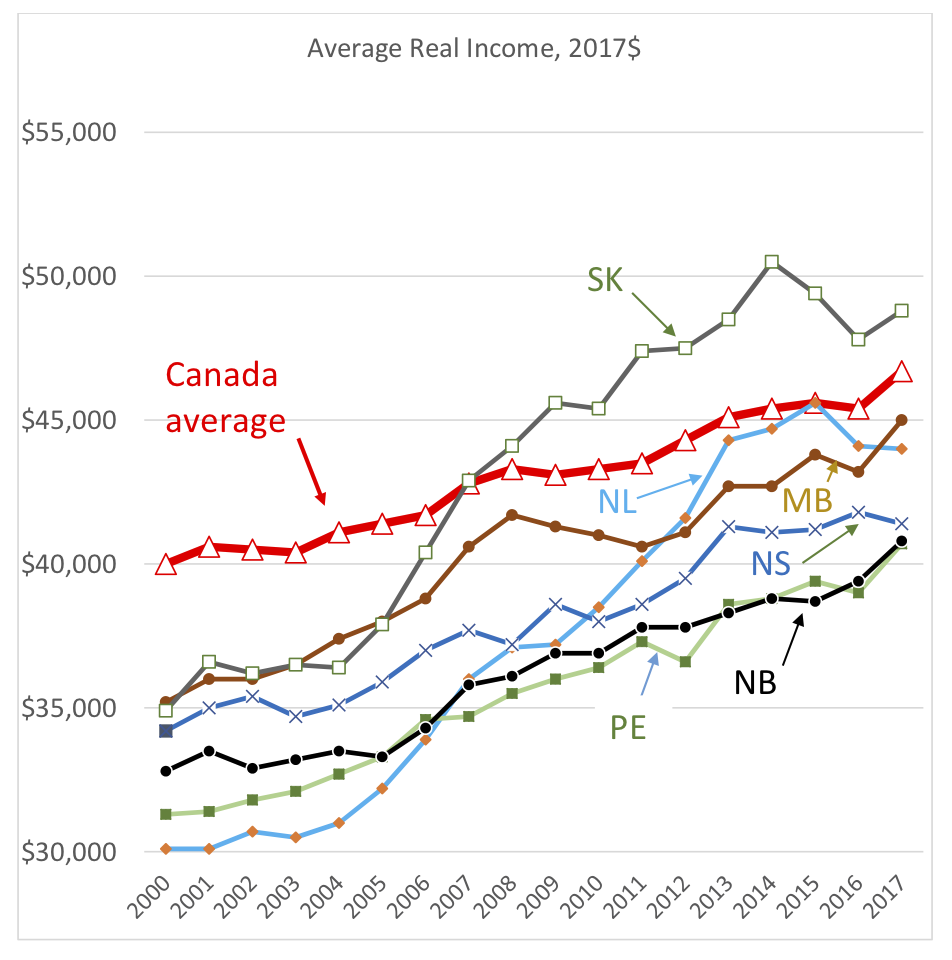
Each of the six provinces with the lowest average incomes in the year 2000 is now closer to the Canadian average, with Saskatchewan now above it.
How Canada’s job creation bonanza can continue in 2020
Sébastien Lavoie, chief economist, Laurentian Bank Securities

It is as good as it gets for job creation in Canada. More than 400,000 jobs were added from a year ago, led by services-oriented industries. Part of Canada’s success story relates to improving labour market integration. The nationwide employment rate is at its highest level (62 per cent) in this decade-long business cycle. Notably, a record-high share of the 25-54 years old cohort is working in Quebec and B.C. With limited space to hire more workers in these two provinces, can Alberta and Ontario take the lead? In Ontario, the employment rate should exceed pre-2009 recession levels during 2020. In Alberta, the employment ratio improved from the 2016 lows but remains shy of the days when crude oil prices were closer to US$100. The employment rate in the country for Canadians aged 55-plus is also expected to increase further, an encouraging sign that experienced workers are more active and passing on their knowledge and corporate memory to younger colleagues.
The upside and downside of labour’s rising share of GDP
Jimmy Jean, macro strategist, Desjardins
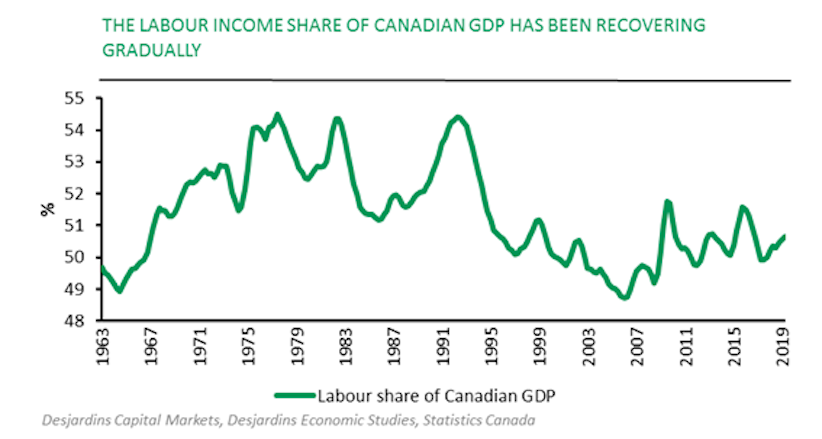
Canada’s strong job market during 2019 has been at odds with GDP growth. As of August, employment growth was running at 2.5 per cent, almost double the pace of real GDP (1.3 per cent). The upshot is dismal productivity growth. As of the second quarter of 2019, the latest data point available, labour productivity was running at a paltry 0.3 per cent year-over-year. While productivity growth in the U.S. remains a far cry from the late-90s tech boom levels, it was still growing at 1.8 per cent year-over-year as of the second quarter of 2019. All else equal, labour income running faster than productivity implies a reallocation of aggregate income towards workers and away from businesses. This dynamic has been witnessed in Canada, with the labour share of aggregate income gradually climbing since the last recession.
This is both good and bad news. An increase in the labour share of income is consistent with strengthening wage growth and in turn consumer spending and the real estate market. It also supports fiscal revenues and tends to work against income inequality. But it also implies an erosion in business profit margins, given that productivity growth is insufficient to match wage increases at present, which is driving unit labour costs higher. This model of growth is inherently unsustainable, and either firms will reallocate their inputs towards capital as it gets increasingly cheap relative to labour (thereby boosting productivity), or they will cut their payrolls to preserve their margins. The first scenario would be the most desirable one, as it would grow the economic pie and create an environment of stronger growth without overheating. The second scenario would be more of a zero-sum game that would end up crippling household spending and residential investment (i.e. 64 per cent of the Canadian economy).
Just a temporary slowdown or something more?
Jason Kirby, business journalist, @jason_kirby
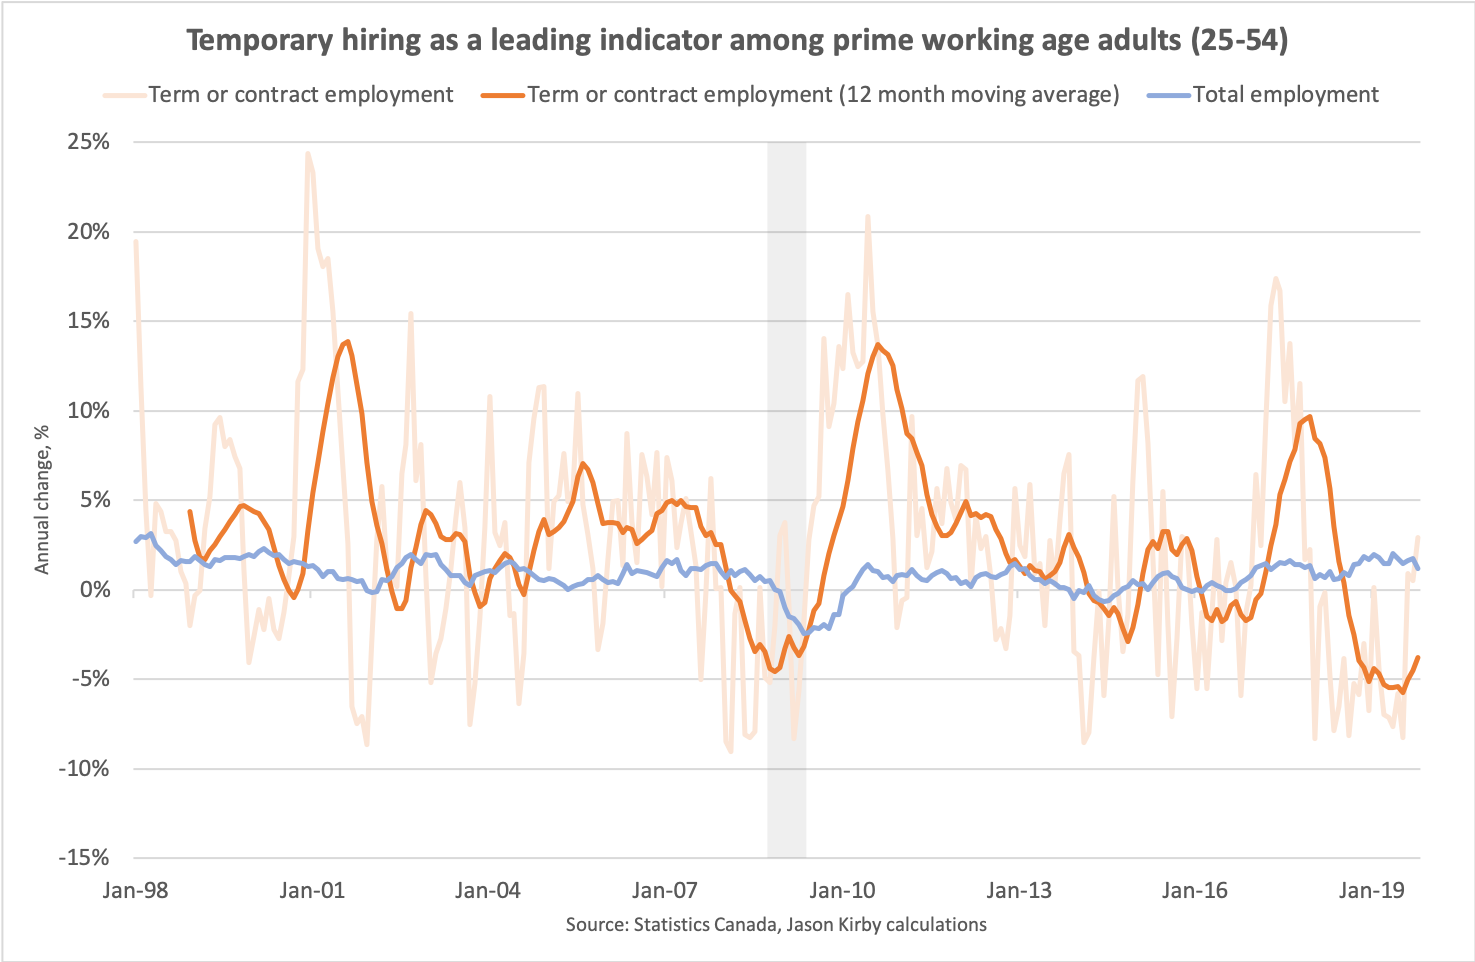
Each month when Statistics Canada releases its job numbers two numbers get all the attention as gauges of the health of the economy — the number of new jobs created or lost, and the unemployment rate. But both of those measures are considered lagging indicators, meaning that changes occur well after a recession or recovery may have begun. For instance, in the case of a downturn, layoffs typically don’t happen until after a recession is already underway. However other jobs measures are more useful as leading indicators of where the economy may be headed. One is temporary employment, or more specifically employment through temp agencies. Temporary hiring can offer a clue to permanent hiring trends — companies unsure of the future often turn to temp agencies for staff before making them permanent. As such changes in temp agency hiring can signal future shifts in the overall job market well ahead of time. You can best see this leading indicator in action in the U.S. where the Bureau of Labor Statistics tracks hiring by temporary help services.
For this chart I cobbled together a made-in-Canada version using the “term or contract employment” sub-category under StatCan’s monthly release of temporary employment, and focussed on prime working-age adults between 25 and 54. It’s a very messy data series with wild month-to-month swings (shown in light orange). The dark orange line offers a smoother trend line using a moving 12-month average, while the blue line shows the overall change in employment for that age category. (The grey bar marks the 2008/09 recession.) By this averaged gauge the rate of change in temp hiring is near its all time low for as long as StatCan has tracked the data. I’ll be watching to see if the improvement in temporary employment reported in September and October holds, or whether a slowdown in temp hiring points to broader trouble for the job market.
Markets, monetary policy and currency
Don’t underestimate high-flying Canadian tech stocks
Nick Waddell, founding editor, Cantech Letter, @CantechLetter
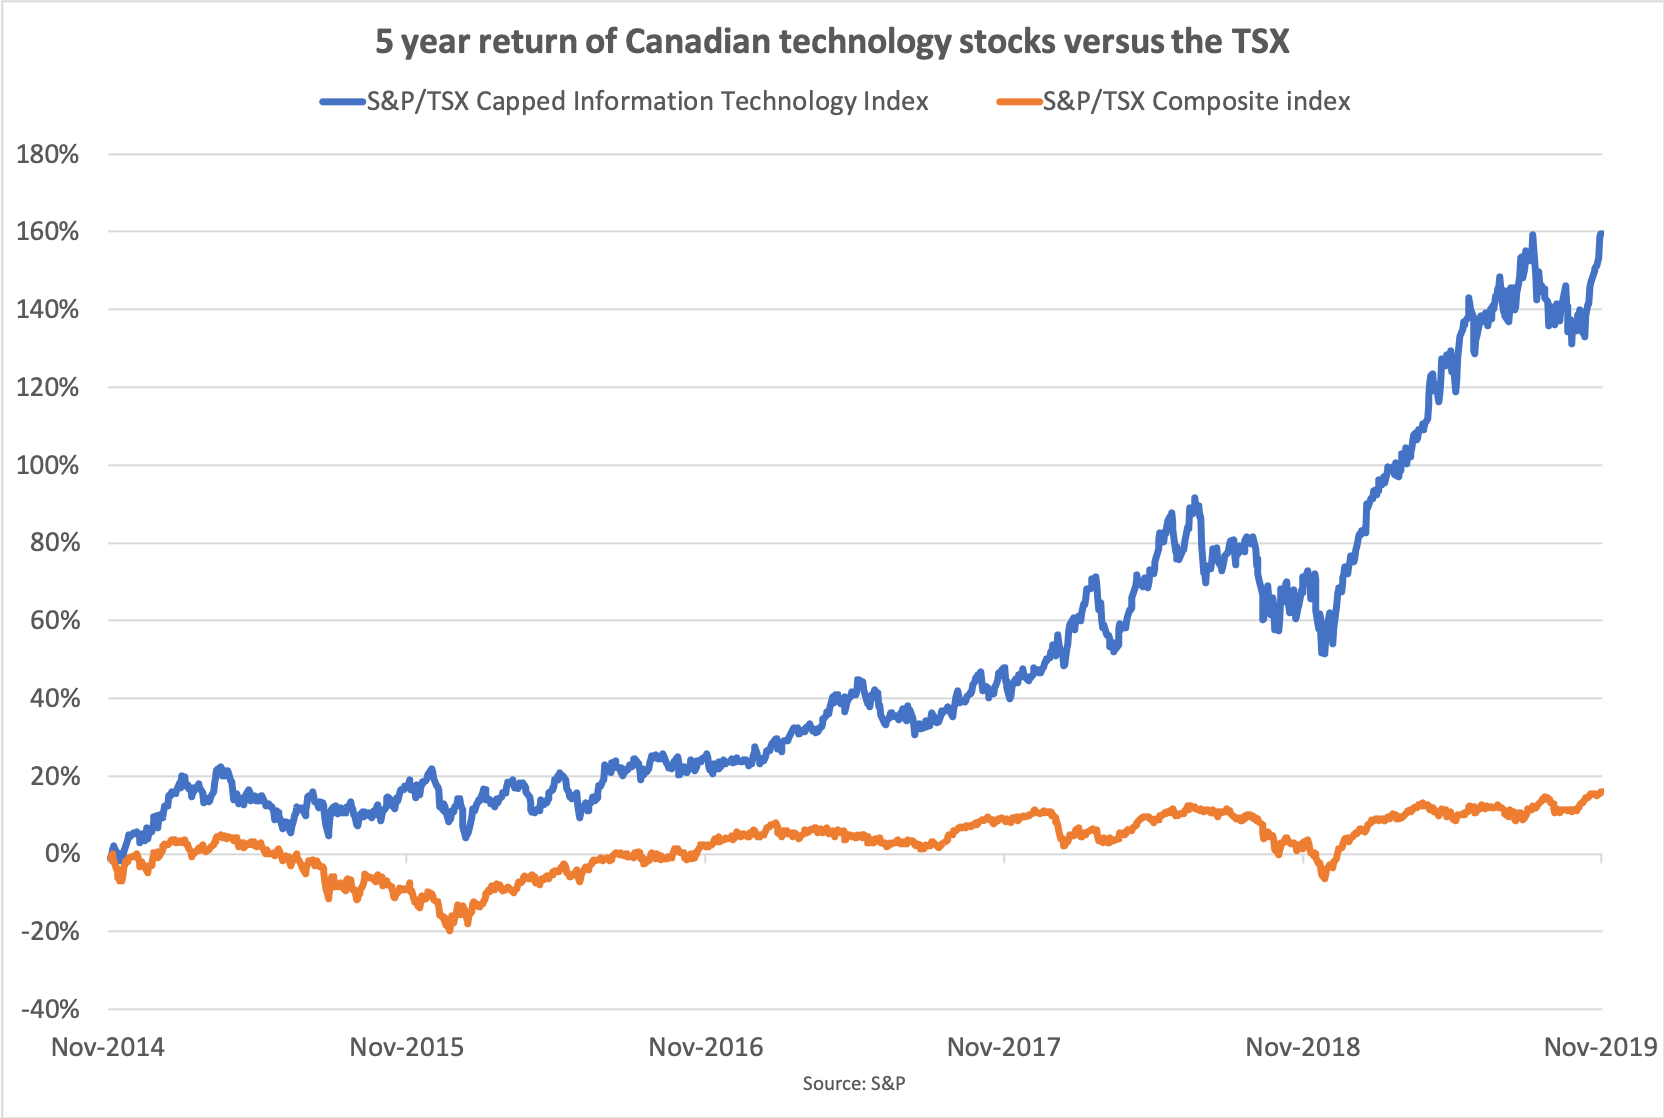
A chart I will be watching closely in 2020 is the S&P/TSX Capped Information Technology Index. The index is up 160 per cent over the past five years, reflecting a larger shift in the Canadian markets towards the innovation sectors. The constituents of this particular index are some of the highest-flying names in the Canadian technology sector, including stocks such as Shopify, Constellation Software and Descartes Systems Group, as well as smaller players such as Photon Control and Absolute Software.
It’s been a great run for many of these companies, which have grown organically and through M&A. It will be interesting for those in the latter camp, namely Constellation, Enghouse Systems and Descartes, to see if they can continue to find accretive acquisition targets that will keep their growth going. Constellation, for one, recently announced it would lower its “hurdle rate” — the minimum rate of return it expects on acquisitions — for larger pickups. Some say this may be a sign that the low-hanging fruit has been picked, but I would be wary of underestimating the Marc Leonard, Stephen Sadler or Ed Ryan, leaders who all seem to know how to turn a dime into a dollar with precision and dispatch.
The connection between equities and the Fed
Scott Barlow, market strategist, Globe and Mail, @SBarlow_ROB
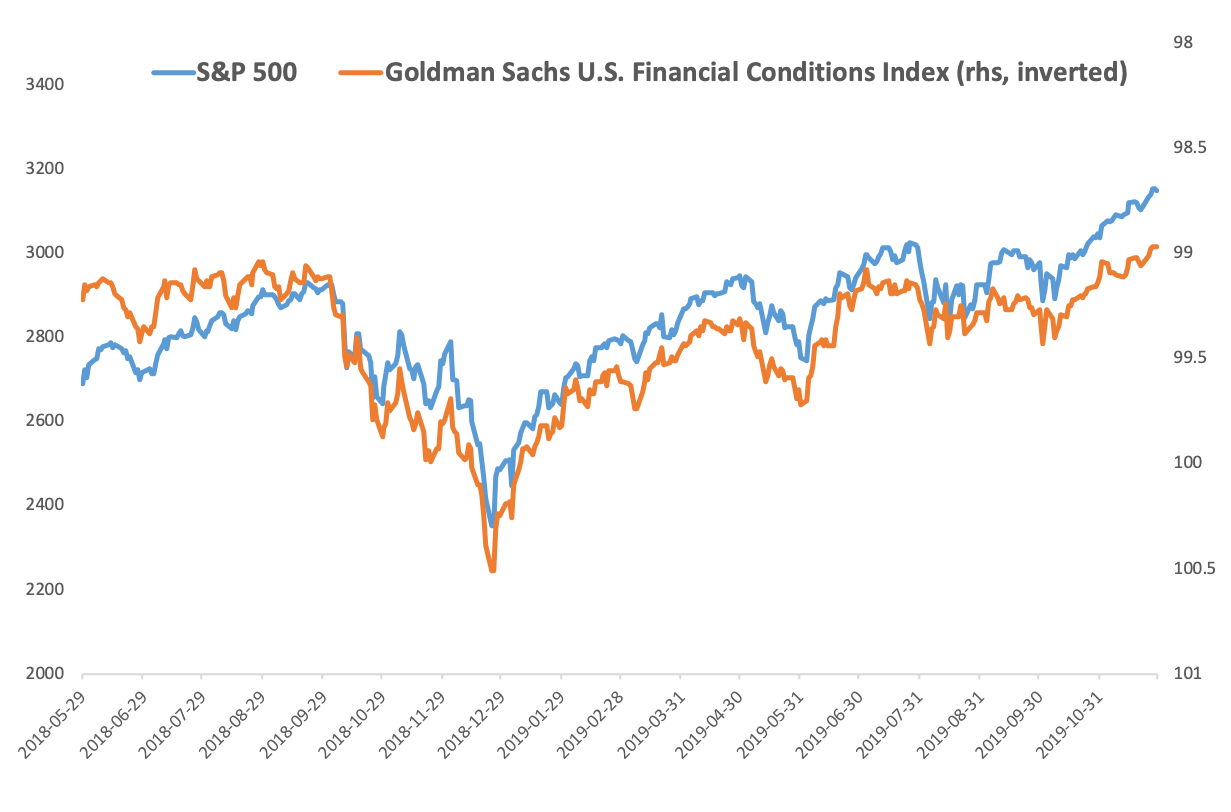
The extraordinarily high degree of correlation between the S&P 500 and the Goldman Sachs U.S. Financial Conditions Index has underscored the importance of central bank policy to asset markets returns on both sides of the border in the past 18 months. The Federal Reserve’s ill-fated attempts at tightening monetary policy during the second half of 2018 is shown by falling orange line on the accompanying chart. The S&P 500 reacted badly, falling 19 per cent in accordance to tightening conditions between September 29, 2018 and Christmas Eve when the Fed chairman Powell signaled that the monetary spigots were about to re-open. Financial conditions have steadily loosened through 2019 and U.S. equities have followed suit – ignoring mediocre (at best) profit growth in the second and third quarters and climbing more than 36 per cent as of the end of November. In part, the correlation on the chart is cheating – the S&P 500 is a component of the financial conditions index and there’s a degree of comparing the benchmark to itself. It only makes up five per cent of the financial conditions index, however – the ten-year Treasury yield and corporate bond spreads play a much bigger role, making up 45 and 40 per cent respectively.
U.S. monetary policy affects Canadian investors in ways both direct and indirect reasons. Fed policy drives bond yields and Canadian bond yields have historically followed their U.S. counterparts whether it’s justified by the domestic economy or not. Relative bond yields – Canadian minus U.S. – have also been a primary influence on the value of the loonie. Where the S&P/TSX Composite index is concerned, investor sentiment and risk tolerance is often imported from south of the border. If U.S. equity market become volatile in the absence of monetary stimulus, higher risk domestic equity sectors like resources are also likely to suffer.
The Fed has determined that monetary conditions are appropriate so investors can expect them to be less active in 2020. It will be interesting to see how equities react without the training wheels of central bank assistance. I don’t expect the chart’s correlation to remain this high, and it’s an open question what will replace credit conditions as the main driver of U.S. equity prices.
The oligopoly boom
Mike Newton, portfolio manager and director of wealth management, Scotia McLeod (@NewtonGroupSM)
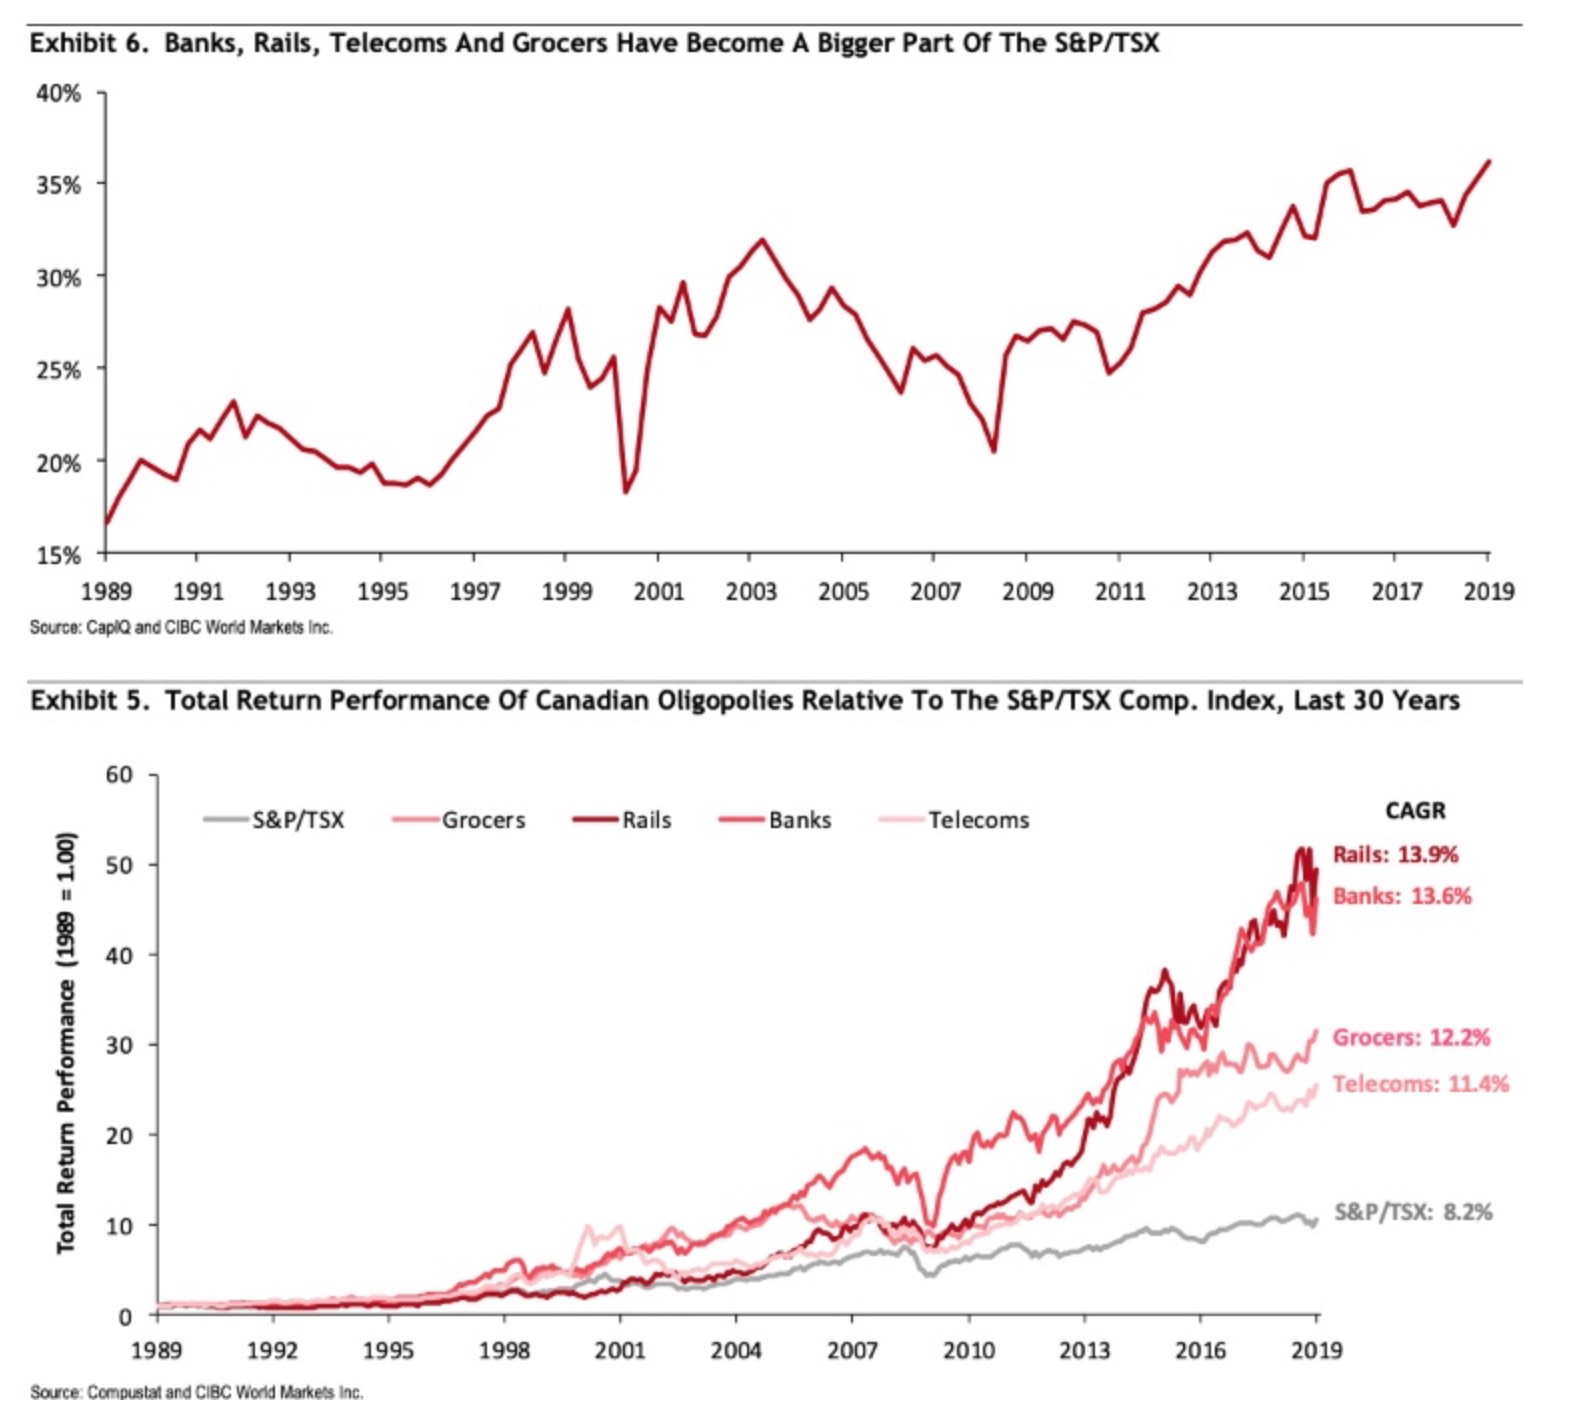
The Canadian equity market, like the Canadian economy, will always be known for its large exposure to globally competitive resource companies. However, four domestic sectors with oligopolistic market structures — banks, Rails, Telecoms and Grocers — have moved from 18 per cent of the S&P/TSX market capitalization three decades ago to about 34 per cent today. The good news is that these businesses have traditionally exhibited high profitability and investment returns, with limited volatility, while these oligopolies also generating better long-term ROE performance while also producing lower share price volatility.
Canadian investors need to get over their home bias
Alexander MacDonald, investment analyst, Cowan Asset Management, @alex_macdonald
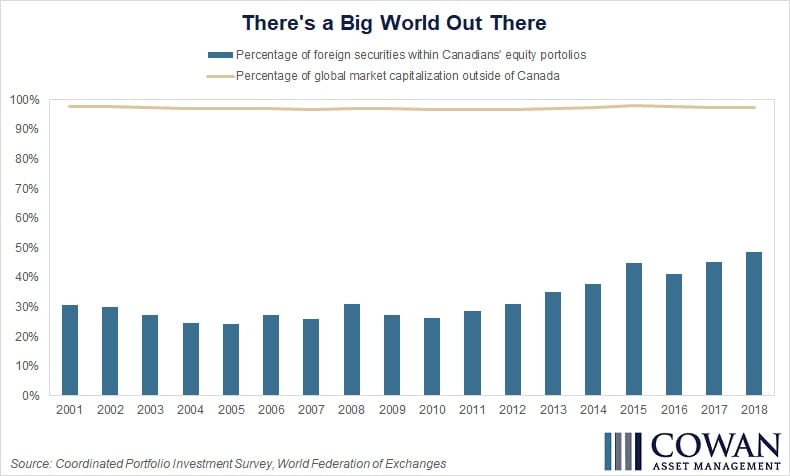
Investors everywhere in the world show a preference to invest in domestic versus foreign equities, but Canadians take it to an extreme. Despite representing just three per cent of global market capitalization, domestic stocks account for over half of Canadians’ equity portfolios. And considering that domestic equities are dominated by the Financials, Energy, and Materials sectors, Canadian portfolios have meagre diversification. The impact of this has been felt by many Canadian investors in the wake of the oil price collapse: since the start of 2015 the S&P 500 Index is up 50 per cent while the S&P/TSX Composite Index is up just 15 per cent.
The Canadian dollar needs lower global uncertainty
Mathieu Savary, managing editor, BCA Research, @SavaryMathieu
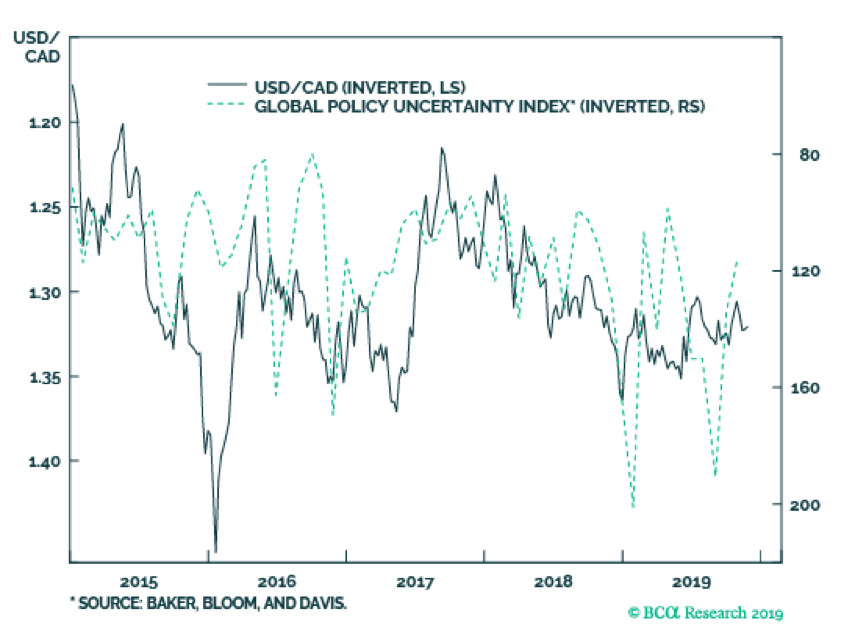
In October, Governor Poloz highlighted that the underpinnings supporting the Canadian consumer remain firm. The main factor behind the BoC’s discussion of an “insurance cut” is the weakness in capital spending. This is not a uniquely Canadian phenomenon; globally, capex has suffered in response to interrelated ills: the global manufacturing slowdown and the rise in policy uncertainty linked to the Sino-U.S. trade war.
At first, the manufacturing weakness was a consequence of the efforts by Beijing to slow credit growth. This weakness was later amplified by the trade war. Chinese policymakers are already working to put a floor under domestic growth. However, they are unwilling to hose the system with debt as they did in 2009, 2012 or 2016. China’s reflation alone points to a tepid global growth rebound. As a result, for global economic activity to gather any significant momentum, the threat of tariffs must be removed and businesses must be allowed to plan unimpeded for their capital budgeting exercises.
The good is news is that a trade détente is in the offing. Both President Trump and President Xi are pressured domestically to arrive to an agreement. As a result, global growth will rebound and so will Canadian capex. This will put a bid under the Loonie, which is trading at a significant 10 per cent discount to its long-term equilibrium. Moreover, a recovering global manufacturing sector will weigh on the trade-weight U.S. dollar and boost commodity prices, including crude oil. This will create another powerful support behind the Canadian dollar.
A currency mismatch that could provide a recession buffer
Allan W. Gregory and Gregor Smith, Queen’s University, @awg_allan
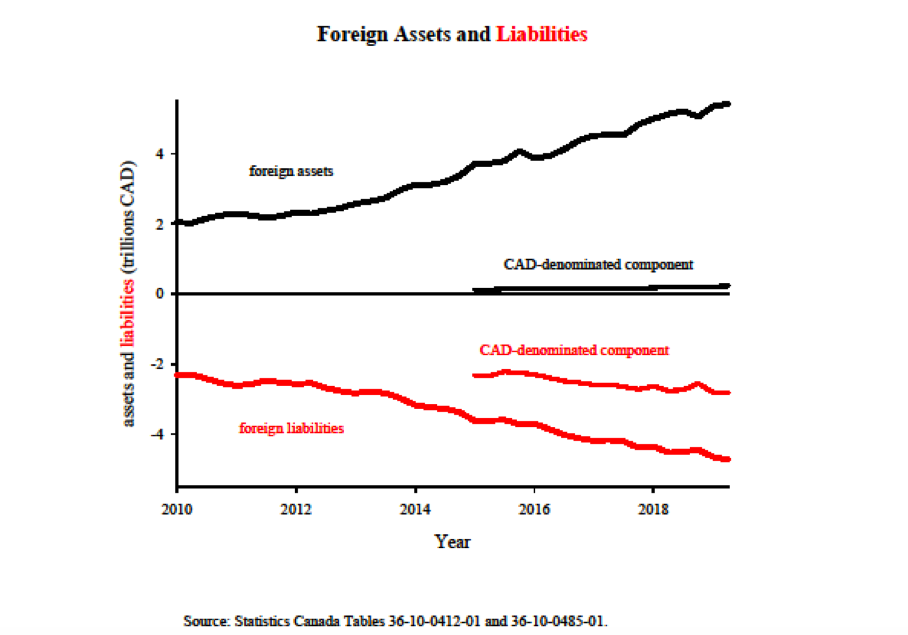
The figure shows Canada’s gross foreign assets (in black) and gross foreign liabilities (in red) quarterly since 2010, converted to trillions of Canadian dollars. It also shows the shares of assets and liabilities that are denominated in Canadian dollars, which Statistics Canada has reported since 2015.
Fact 1: These gross positions have grown enormously (more than doubling) over the past decade.
Fact 2: Our collective national hedge fund operates with a currency mismatch. Currently four per cent of foreign assets are denominated in Canadian dollars while 60 per cent of foreign liabilities are in Canadian-dollar denominated.
Upshot: Imagine a recession and suppose that it features a large depreciation of the Canadian dollar, just like in 2008–2009. This scenario would feature a valuation effect on an unprecedented scale, raising the external wealth of the nation and (one hopes) acting as a stabilizer.
Trade and competitiveness
Growth will lift if trade uncertainty abates
Brett House, René Lalonde and Nikita Perevalov, Scotiabank Economics
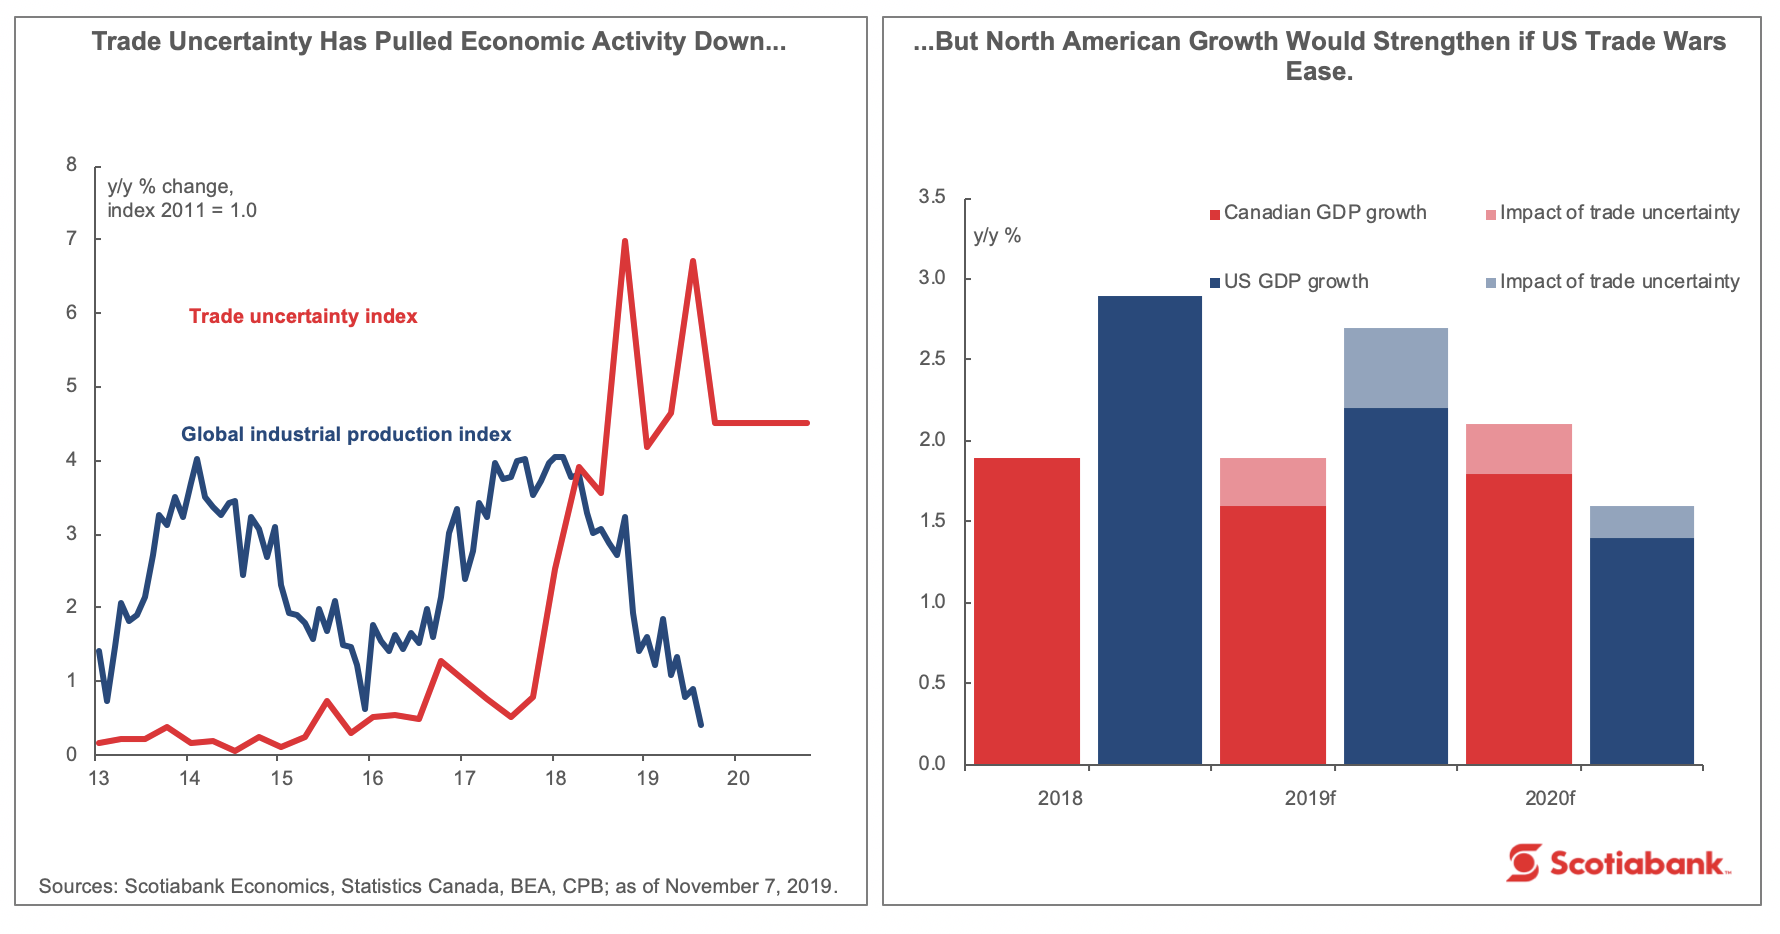
The White House’s trade wars have heightened uncertainty to unprecedented levels and deepened fears of recessions as global industrial activity and trade have been driven down into a ‘Trump slump’. Since the first salvo in the U.S.-China spat at the beginning of 2018, the costs for the global economy have been sizeable. Scotiabank Economics has quantified the potential costs of the White House’s erratic trade policies for the U.S. and Canada if Pres. Trump sustains current levels of uncertainty through end-2020. On average, annual real GDP growth over 2019–20 is set to be cut by about 0.4 percentage points in the U.S. and about 0.3 percentage points in Canada. In 2020, the U.S. economy would be about 0.7 per cent smaller (and 0.6 per cent smaller for Canada) and the U.S. stock market worth about five per cent less than they would be if the Trump trade wars were stopped. The good news is that this existing and prospective damage could be undone quickly and recessions definitively avoided with even a basic U.S.-China trade deal, the ratification of the revised NAFTA deal, and a pause on new U.S. trade skirmishes with Europe. Recent record highs in equity markets imply investors are already betting on this outcome.
On corporate income tax rates Canada loses its competitiveness
Jack Mintz and Philip Bazel, School of Public Policy, University of Calgary, @jackmintz
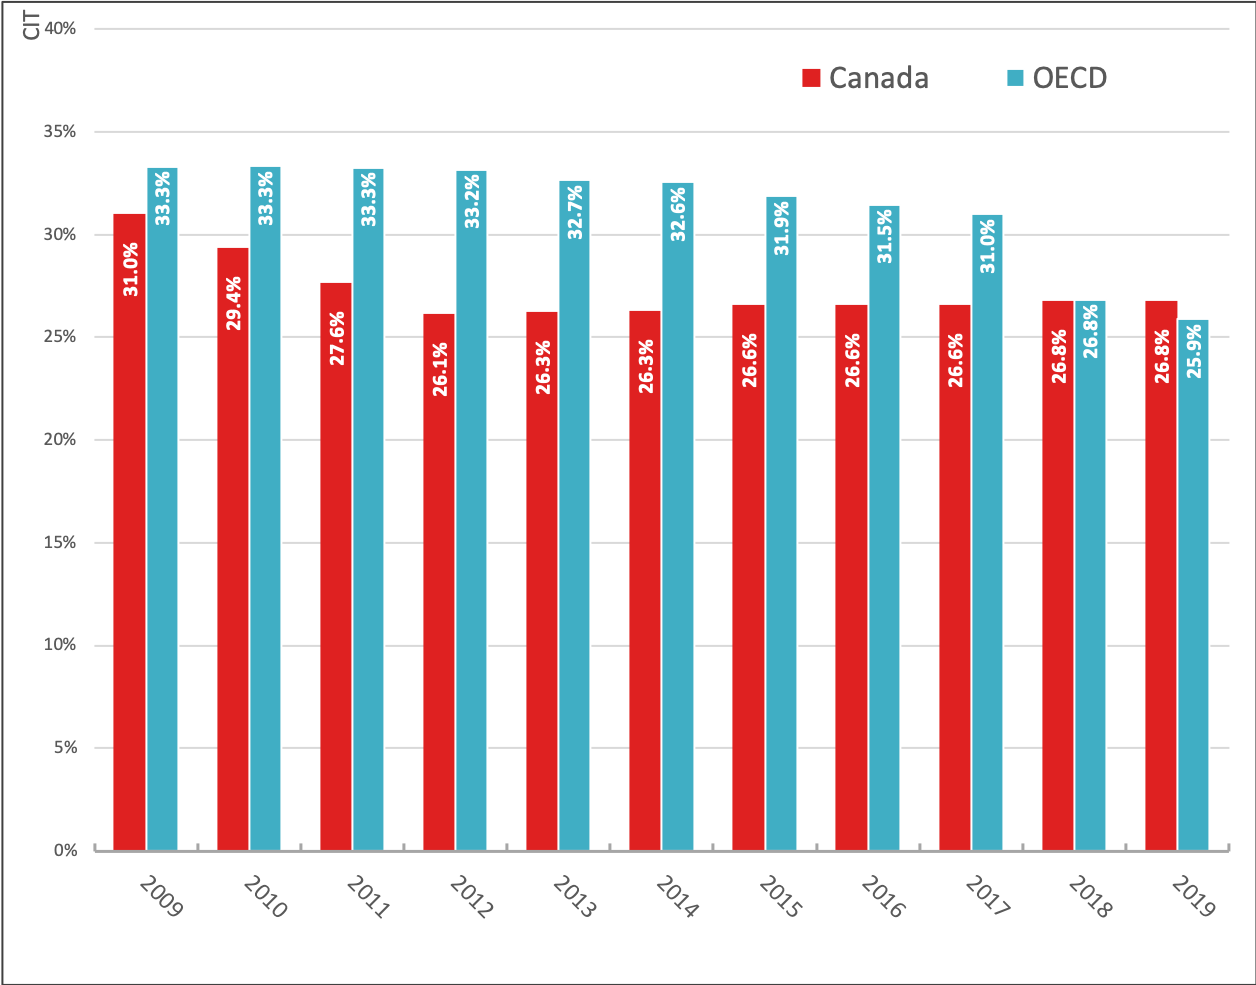
A decade ago, Canada had a lower federal-provincial corporate income tax (CIT) rate than the GDP-weighted average of OECD CIT rates. In 2012, Canada’s advantage was 7.1 percentage points. In 2019, not only has Canada lost entirely its advantage but its corporate rate is now higher than OECD countries by 0.9 percentage points (the steep drop in the OECD rate reflects the drop in the U.S. corporate rate from 39.1 per cent to 25.7 per cent). The highest 2019 OECD corporate income tax rate is Portugal’s at 31.5 per cent so Canada is not far from the top of the ladder these days.
Why does this matter? Investment decisions don’t just depend on the corporate income tax rate but also other features of corporate tax systems such as cost deductions, financial transaction taxes and taxes on capital purchases. Canada is below the OECD average in that respect.
However, other business decisions are affected by headline corporate income tax rates: where to put marketing activities, patent income and debt finance, for example. Since Canada now has a high corporate income tax rate, it is losing several business functions to other countries, especially the United States, as well as attracting costs eroding its corporate tax base. Not only does Canada bleed jobs to other countries but it loses corporate revenues as businesses shift profits out of Canada.
Canada is the world’s export laggard
Karl Schamotta, chief market strategist, Cambridge Global Payments, @vsualst
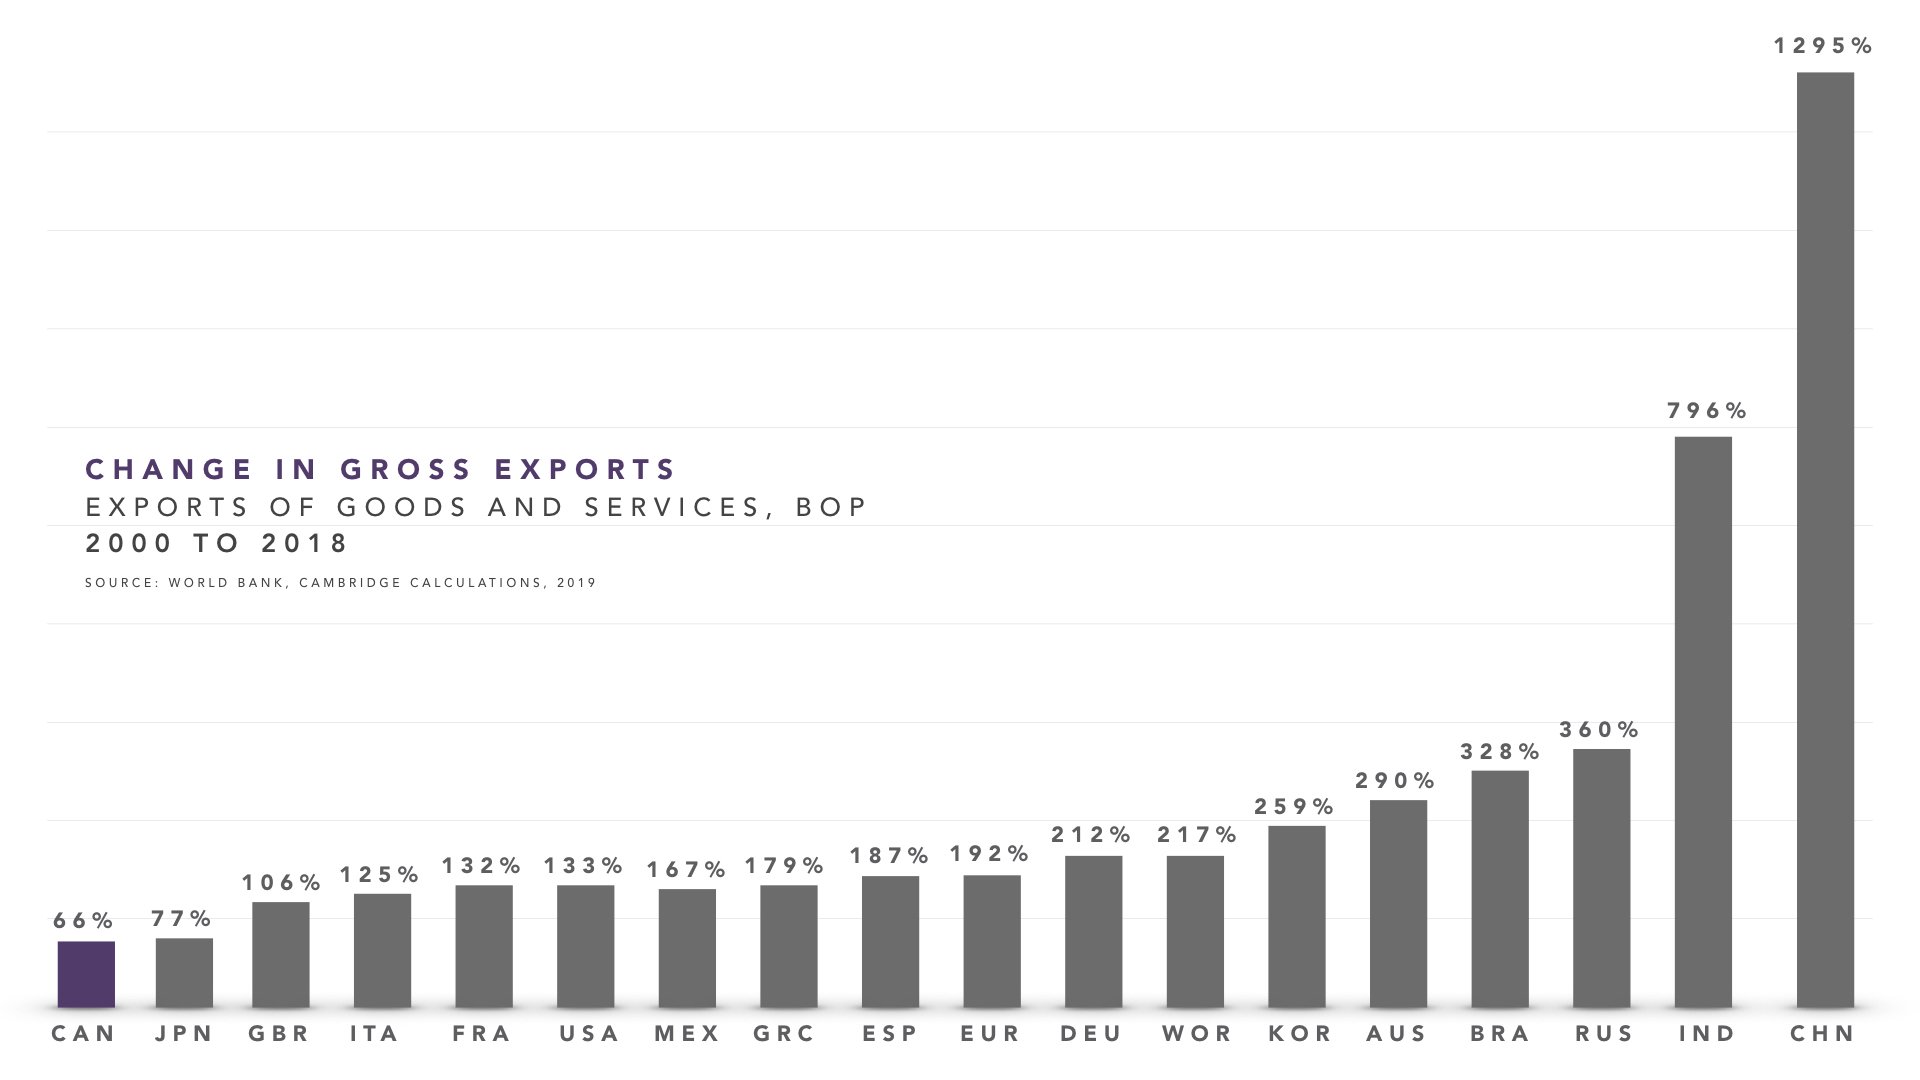
In global markets, Canada is widely seen as an internationally competitive, energy rich, export-led economy. But that story is long out of date. Two decades of weak productivity, poor investment, exchange rate overvaluation, and strong global competition have taken a devastating toll. In gross terms, Canada has grown exports by less than any other G7 country, and by far less than the global average. Instead, consumers are powering growth. Time for the narrative to change?
Global trade pressures weigh on Canada
Dawn Desjardins, deputy chief economist, RBC Royal Bank
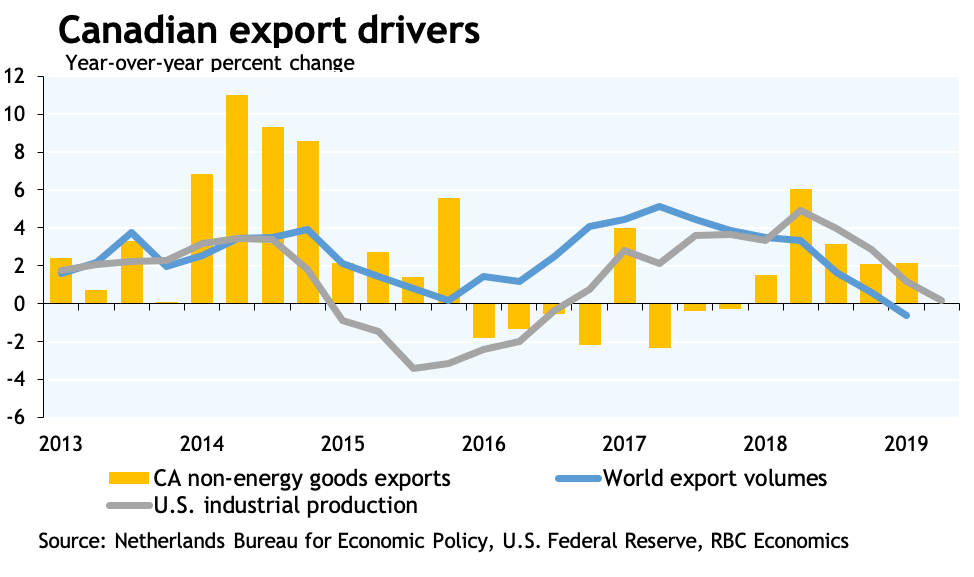
Canada’s exporters are facing headwinds. Not only is the energy sector under pressure from transportation bottlenecks but non-energy goods exports are seeing weakening demand. Tariffs and rising policy uncertainty have taken a toll on world export volumes and have hit the U.S. industrial sector particularly hard. As this chart shows, this is weighing on demand for Canadian goods. Services exports conversely are growing more rapidly and make up an increasing share of total Canadian sales abroad. Wading through the headlines provides no clarity about the likelihood of a truce between the U.S. and China suggesting that the pressures on global trade flows will remain in place in early 2020.
Canada’s has an export problem
Avery Shenfeld, chief economist, CIBC Capital markets
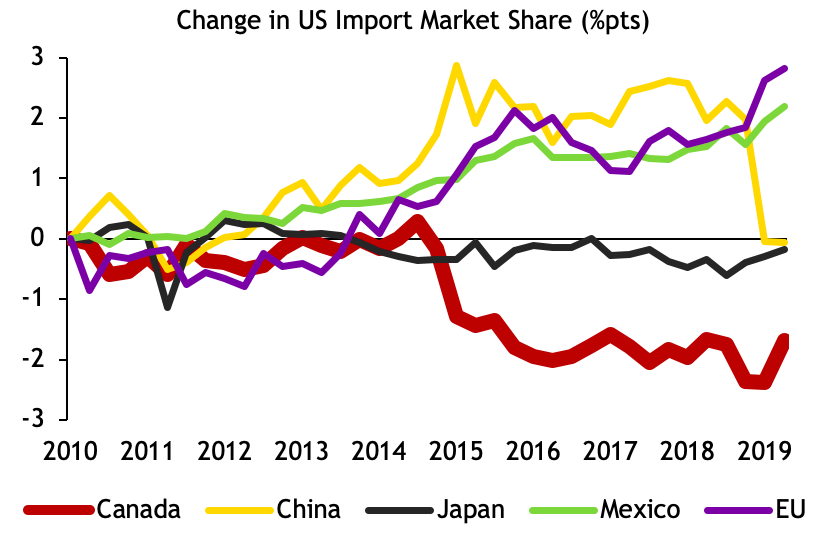
If Canada is going to be less reliant on debt financed consumption or housing, we’re going to need to reverse the erosion we’ve been seeing in our export competitiveness. Our share of total U.S. imports fell sharply in the last decade, and not just because we’re selling our oil at lower prices per barrel. Instead, since 2010, Canada has lost share in all five major categories of U.S. non-energy imports, with Mexico gaining in food and autos, Europe picking up share in other consumer goods, and China the big winner in industrial goods. The Canadian dollar might be cheap compared to where it stood when oil fetched $100 per barrel, but is not yet cheap enough to allow other exports and related capital spending to thrive.
Weak non-energy exports explained
Krishen Rangasamy, senior economist, National Bank of Canada
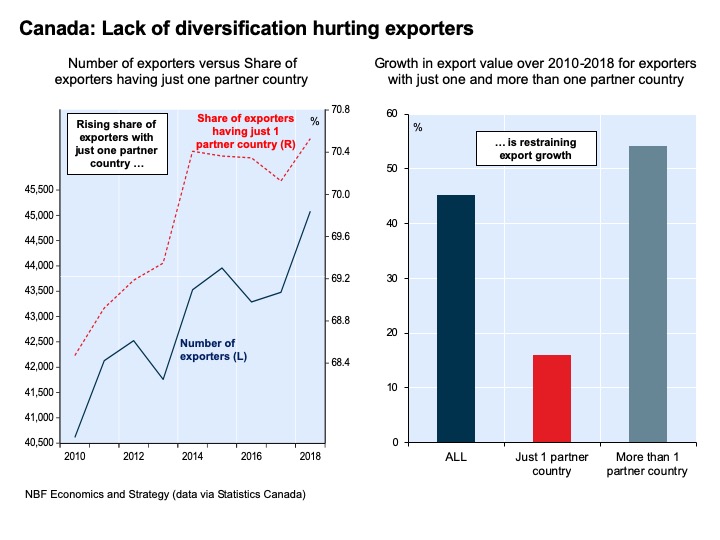
One of my favourite charts explains why non-energy exports have been stagnant in the last 12 years. Last year the number of Canadian firms engaged in exports jumped past 45,000. However, the number of firms exporting to just one partner country continues to rise faster than the number of firms that have more diversified markets. So much so, that a record 70.5 per cent of Canadian exporters now have just one partner country. Why is this a problem? For one, such a large exposure to one trade partner (i.e. the U.S.) makes Canadian exporters more vulnerable to U.S. economic cycles. More importantly, as we’ve seen with USMCA, the lack of diversification reduces leverage for Canadian trade negotiators as they attempt to assuage an increasingly belligerent trade partner. Lack of diversification is also restraining export growth for Canadian companies. As the chart shows, over the last eight years export growth for firms having more than one partner country was three times as large as that of firms trading with just the U.S. In other words, diversification of trade is crucial if Canada wants to see stronger export growth.
Recovering from Donald Trump’s steel and aluminum tariffs
Stephen Tapp and Mohammed Rajpar, Export Development Canada, @stephen_tapp
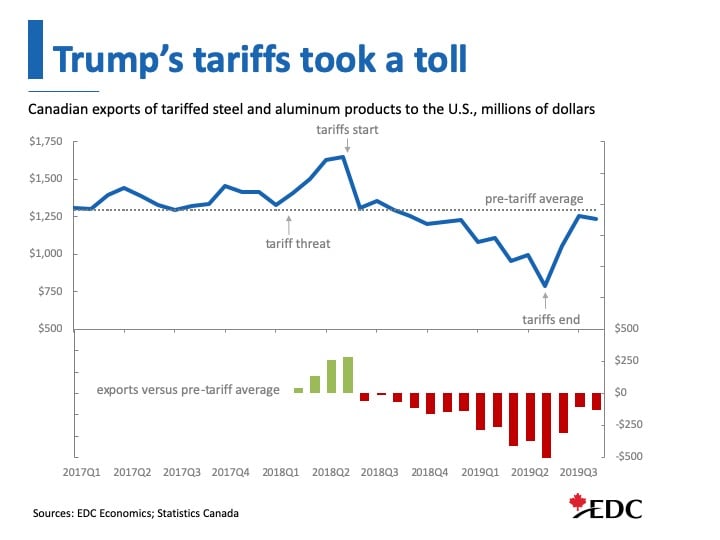
2019 was a tariffying year for global trade. U.S. President Trump’s trade war has had negative and wide-ranging impacts: increasing uncertainty, sapping business confidence, sidelining investment, restraining bilateral trade, and leading some multinationals to shift their operations across countries to avoid tariffs.
Although China is Trump’s main target, Canada also suffered steel and aluminum tariffs in the first half of 2019, which started back in 2018 during NAFTA renegotiations. This chart illustrates the impacts. After initial tariff threats, stockpiling occurred as companies expedited cross-border trade before tariffs took effect. Once tariffs came on, bilateral trade slowed noticeably imposing permanent losses. Canada’s exports to the U.S. were 16 per cent lower for these products during the tariffs, and trade has only recently approached pre-tariff levels.
What will 2020 bring? Further escalation in the U.S.-led trade war, or perhaps a long-awaited resolution as the costs of these actions become better understood by the voting public?
Canada’s vehicle trade deficit
Brendan Sweeney, managing director, Trillium Network for Advanced Manufacturing, @B_A_Sweeney
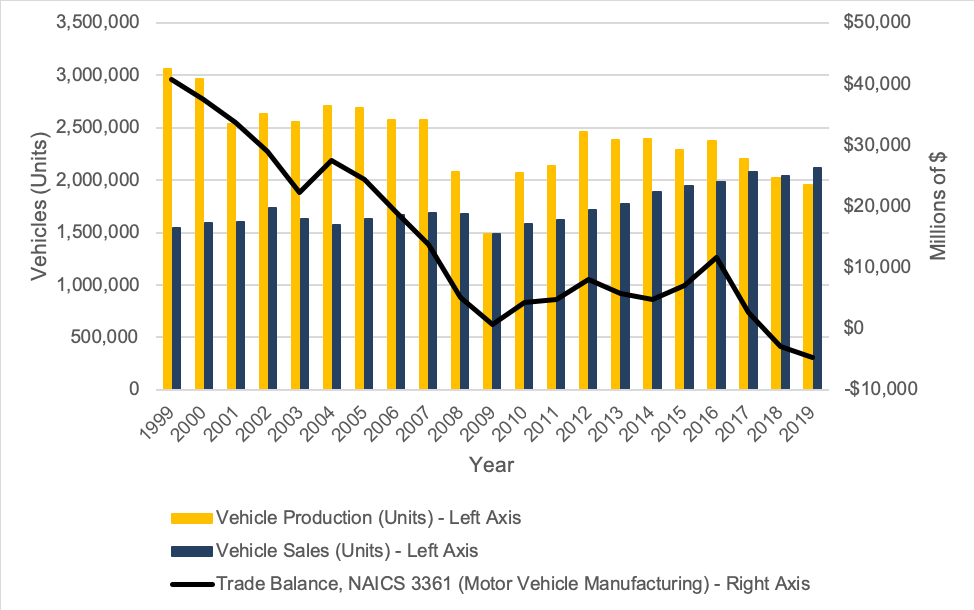
In 2018, automakers sold 2.03 million vehicles in Canada, while five of them (FCA, Ford, GM, Honda, and Toyota) built 2.02 million vehicles. In the same year, Canada’s deficit in vehicle trade was nearly $3 billion. This marked the first time in decades that Canadians bought more vehicles than they built, and that Canada had a deficit in vehicle trade. Moreover, the year 2018 stands in contrast to 1999, when automakers built over 3 million vehicles in Canada (nearly twice as many as they sold) and Canada had a surplus in vehicle trade of over $40 billion.
Canada’s vehicle production-to-sales ratio is expected to fall again in 2019, while its deficit in vehicle trade will exceed $4 billion. These trends occurred amid several years of strong vehicle sales, increased vehicle imports from Mexico, the EU, and Asia, and production curtailments and plant closures by (some) automakers in Canada. The automotive manufacturing industry — including bus and truck manufacturing — is economically important to Canada, and especially to communities in Ontario, Québec, and Manitoba. Vehicle assembly jobs pay well (35 per cent more than the Canadian average), the economic multiplier benefits are significant (every job in a vehicle assembly facility creates at least six others in upstream and downstream activities), and the industry represents an important source of innovation.
Recent efforts to support the industry have been met with limited success. Considering all of this, will stakeholders develop new approaches – especially those that help manufacturers modernize production facilities and improve productivity – in order to secure future investment in one of Canada’s most important industries?
Canadian is losing ground to the U.S. on competitiveness
Eric Lascelles, chief economist, RBC Global Asset Management, @RBCGAMChiefEcon
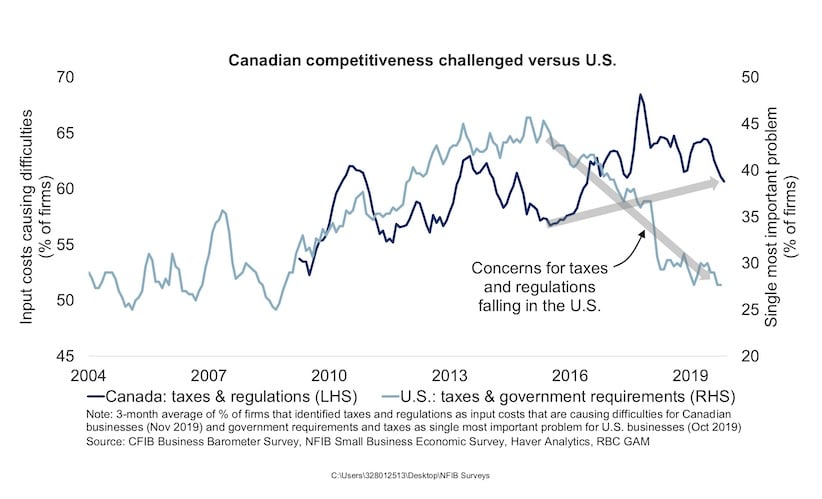
One of Canada’s biggest economic challenges is the country’s deteriorating competitiveness relative to the United States. Canadian small businesses have become incrementally more pessimistic about the tax and regulatory environment over the past several years. At the same time, U.S. small businesses have become more optimistic in response to American policies that have reduced their taxes and regulatory burden. While this chart argues that the bulk of the divergence has occurred over the past few years, other metrics of international competitiveness find that Canada has been slipping down the international rankings for at least a decade. The country’s anemic productivity growth provides confirmation that this erosion is indeed damaging aggregate economic growth and therefore the financial prosperity of Canadians.
Watching the U.S. election
Danielle Goldfarb, head of global research, RIWI Corp., @DIGoldfarb
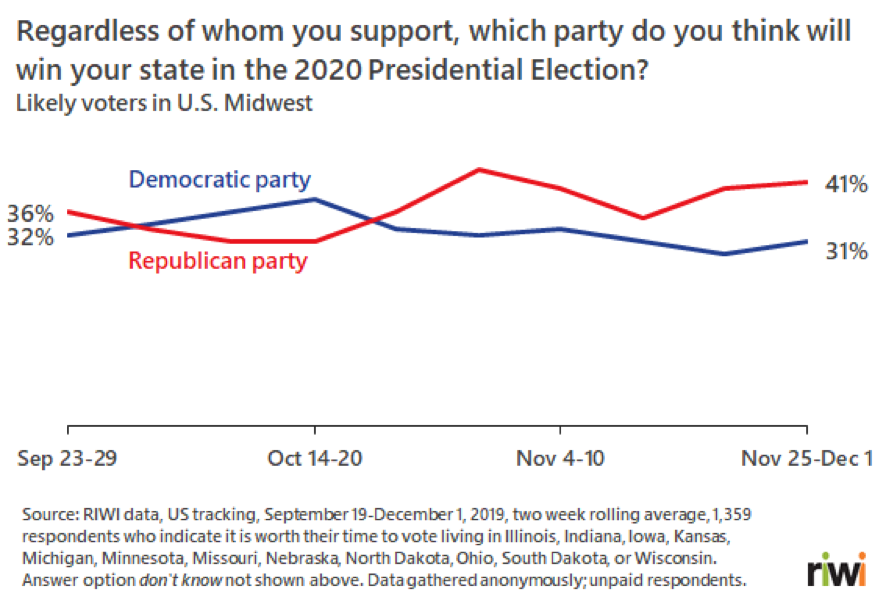
The most important event for the Canadian economy will be the 2020 U.S. election. The result will determine the shape of the global economic and trade order for decades to come. Canadians have a particularly important stake in the outcome as the U.S.’ next-door neighbour and also since we are highly dependent on global trade to maintain our living standards.
To best anticipate and prepare for the outcome, Canadians should largely ignore the national poll data that dominates the news. Instead, we should watch the evolution of charts such as this one at the regional level. In 2016, polls predicted that Hillary Clinton would be President because, among other reasons, pollsters did not speak to enough Trump voters (who were previously non-voters) in key regions like the U.S. Midwest. In the 2020 election, the Midwest and other swing regions could determine the outcome, as could those who were historically politically disengaged and not typically polled. To address this, the data in this chart reflect answers from a far broader range of respondents than traditional polls, including the typically disengaged. And to reduce the “shy Trump voter” effect that could be a factor in 2020 as it was in 2016, the data in this chart are gathered anonymously, and rather than asking which candidate respondents prefer, we ask the more predictive question of which party will win in the respondent’s state.