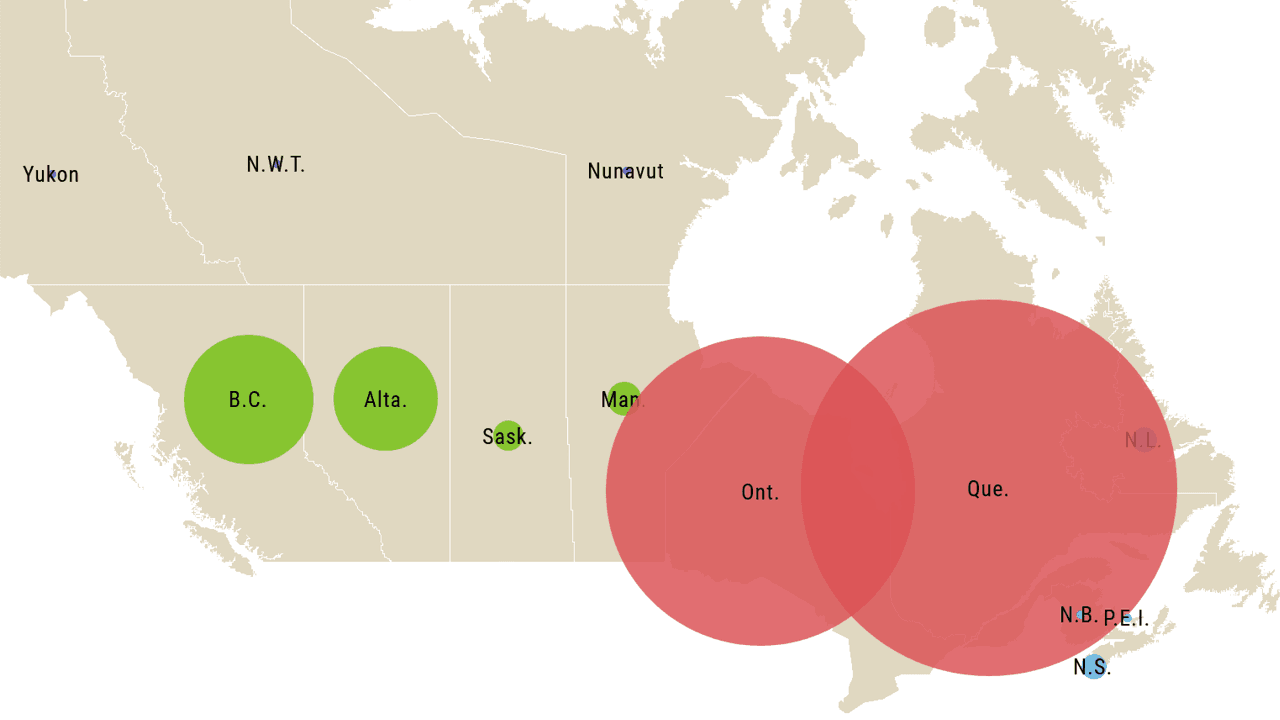
A heat map of coronavirus cases in Canada
As the COVID-19 pandemic sweeps across Canada and the world, the numbers are changing quickly. Maclean’s has created this heat map to present all the crucial information on one page. Numbers were last updated as of June 25 at 9 a.m. EDT, and include the latest data from the federal, provincial and territorial governments. (Maclean’s is also keeping track of Canada’s progress in “flattening the curve”—see that here.)
Here are the national statistics for Canada:
- No. of cases: 103,957
- No. of cases per 100,000 population: 274
- No. of deaths: 8,530
- No. of daily tests: 38,152
- No. of daily tests per 100,000 population: 101
The chart below and the heat map (top) include data calculated on a “per 100,000 population” basis rather than raw numbers in order to allow readers to more easily compare the situation across Canada. Provinces with a large population will usually have higher raw numbers. For instance, figures on March 23 put Ontario at 425 cases and Yukon at just two. Yet, by calculating their cases per 100,000 population, Yukon has 4.9 cases per 100,000 population while Ontario has 2.9.
Differences in how the pandemic has affected the regions of the country also impact the percentage of cases that are currently active, as well as the percentage of those who have recovered from the infections or have died.
MORE ABOUT CORONAVIRUS:
Related Posts

“Sixty-three per cent of N.W.T’s population have been evacuated”

Why sanctions over the Ukraine invasion won’t stop Putin

‘Anybody want to drive this ambulance to Ukraine?’

Why Hamilton is now permitting homeless encampments and tiny homes in parks
Get the Best of Maclean’s straight to your inbox.
Sign up for news, commentary and analysis. Join 60,000+ Canadian readers.