Did you vote? A yes or no question with surprising results
A chunk of Canadians play a game of ‘Let’s Not and Say We Did’
Share
[widgets_on_pages id=”Election”]
Every day, Maclean’s Show and Tell infographic series will highlight interesting data in a visually appealing way, bringing clarity and context to some aspect of the campaign—whether it’s one of the election’s major issues, or a less-discussed concern. Read this daily chart series in our special daily “Bulldog” edition.
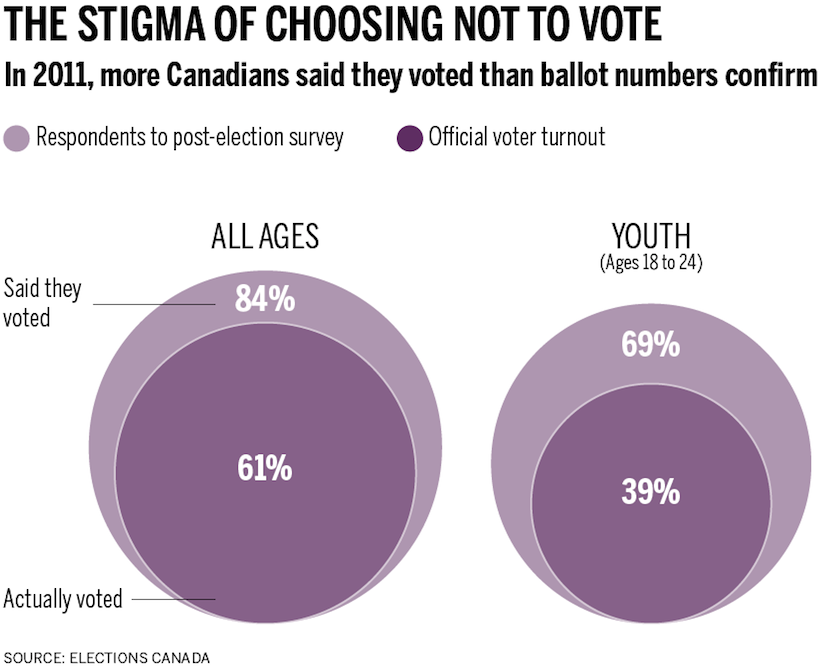
Data don’t need to be complicated to be compelling. Here’s a case in point. Following each election, Elections Canada commissions a survey of electors. They phone up thousands of citizens across the country and ask questions about their voting experience. They also pose a simple query: Did you vote? And surprisingly (or perhaps not), year after year, those numbers come out significantly inflated compared to the official voter turnout. For example, 84 per cent of those surveyed following the last election said they had voted, yet counted ballots tell the truth: Only 61 per cent of Canadians turned up at the polls. And that gap becomes a chasm when it comes to those aged 18 to 24: There is a 30 percentage-point difference between the official and survey numbers. There are two factors that may explain this: Those who vote are more likely to agree to a post-election survey, and, of course, the social stigma associated with not voting encourages over-reporting.