Chart of the day: Toronto is anyone’s city now
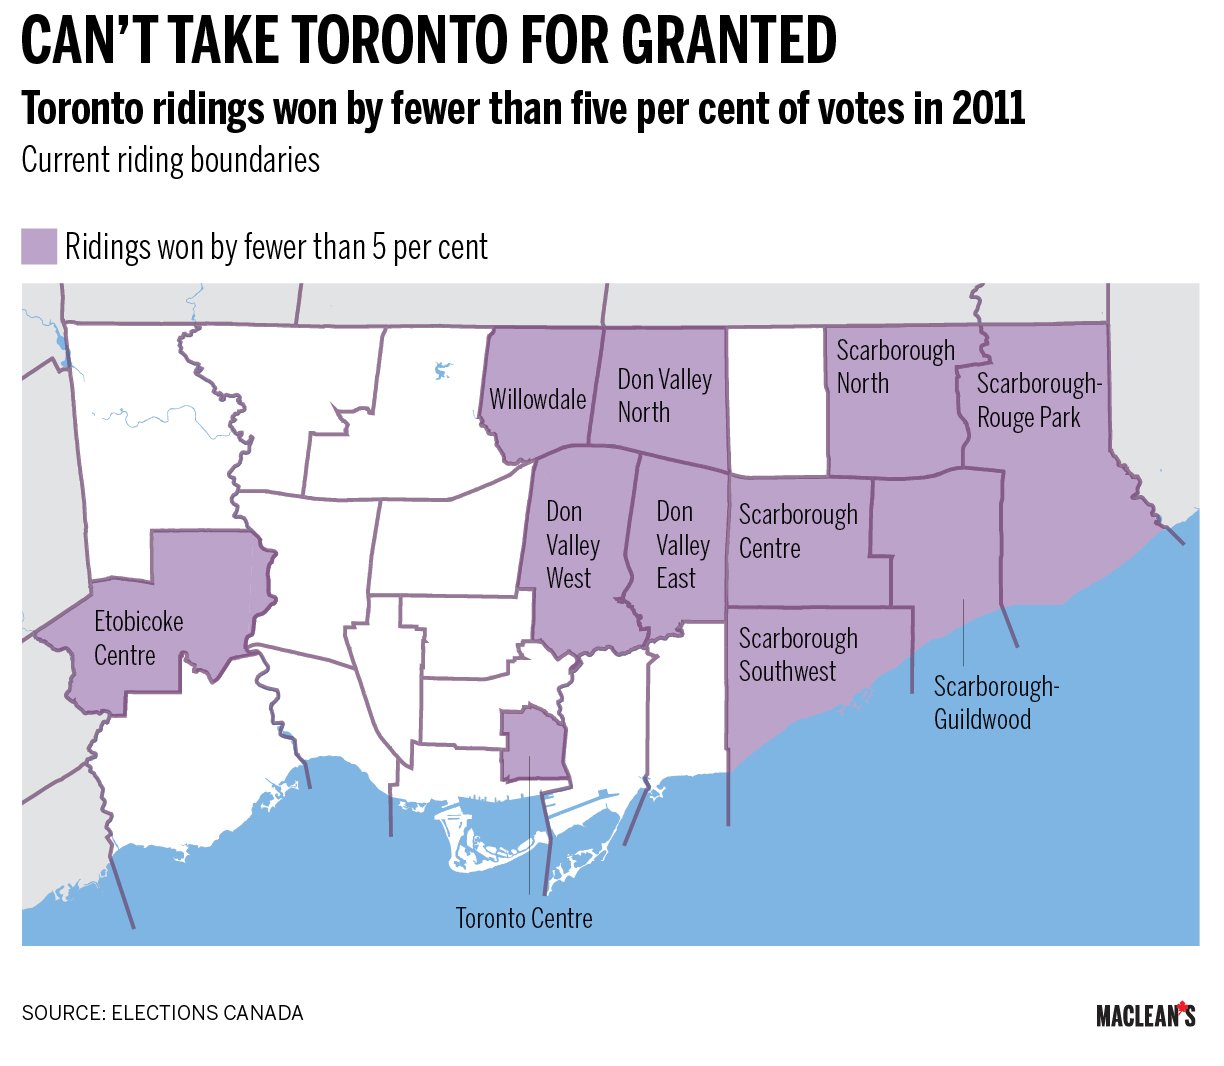
Canada’s biggest metropolis saw a cluster of close races in 2011
Share
[widgets_on_pages id=”Election”]
Every day, Maclean’s Show and Tell infographic series will highlight interesting data in a visually appealing way, bringing clarity and context to some aspect of the campaign—whether it’s one of the election’s major issues, or a less-discussed concern. Read this daily chart series in our special daily “Bulldog” edition.
When the ballots were counted in 2011, 41 federal ridings were decided by fewer than five per cent of votes. That means 17 per cent of seats were swayed by that razor-thin margin, and nobody saw as many tight races as Torontonians. A riding analysis that redistributes the 2011 results into new riding boundaries reveals a cluster of hard-fought battles in the eastern half of Toronto. As such, every party senses opportunity in Canada’s biggest city.