
Below the national numbers, big Liberal advantage
A new large-sample public-opinion survey that permits detailed examination of close races suggests the federal Liberals are well-positioned to make seat gains, as Justin Trudeau decides whether to call an election campaign that could begin as early as this summer.
“The message from this survey for the Liberals is ‘Run, don’t walk, to the writ,’” pollster Greg Lyle of Innovative Research Group said, using Ottawa jargon for an election call. “The table is set for Liberal gains in most competitive seats outside Quebec and they would be crazy to wait a day longer than necessary.”
To produce this analysis for Maclean’s, Lyle combined the samples from monthly national surveys in April, May and June to produce a total sample of 6,360 voters. The result isn’t a snapshot of national voter sentiment at a precise moment in time. But a sample this big allows much greater precision in identifying trends at a smaller geographic and demographic scale. Using this technique near the end of the 2015 campaign, Innovative Research was able to spot a stronger Liberal performance than had been predicted in most seat projections up to that point.
Lyle divided his large national sample into 12 clusters of seats with comparable voter dynamics, based on which parties have been most competitive in those clusters across the last three federal elections, and also incorporating regional dynamics in some cases.
In some of those seat clusters, so far there’s no surprise. In the 38 ridings across the country where the Liberal vote has been strongest since 2011—a cluster Lyle designates as “Liberal Strong,” with places like Charlottetown, Mount Royal and Toronto Centre—the Liberals still hold a clear lead.
Related Posts
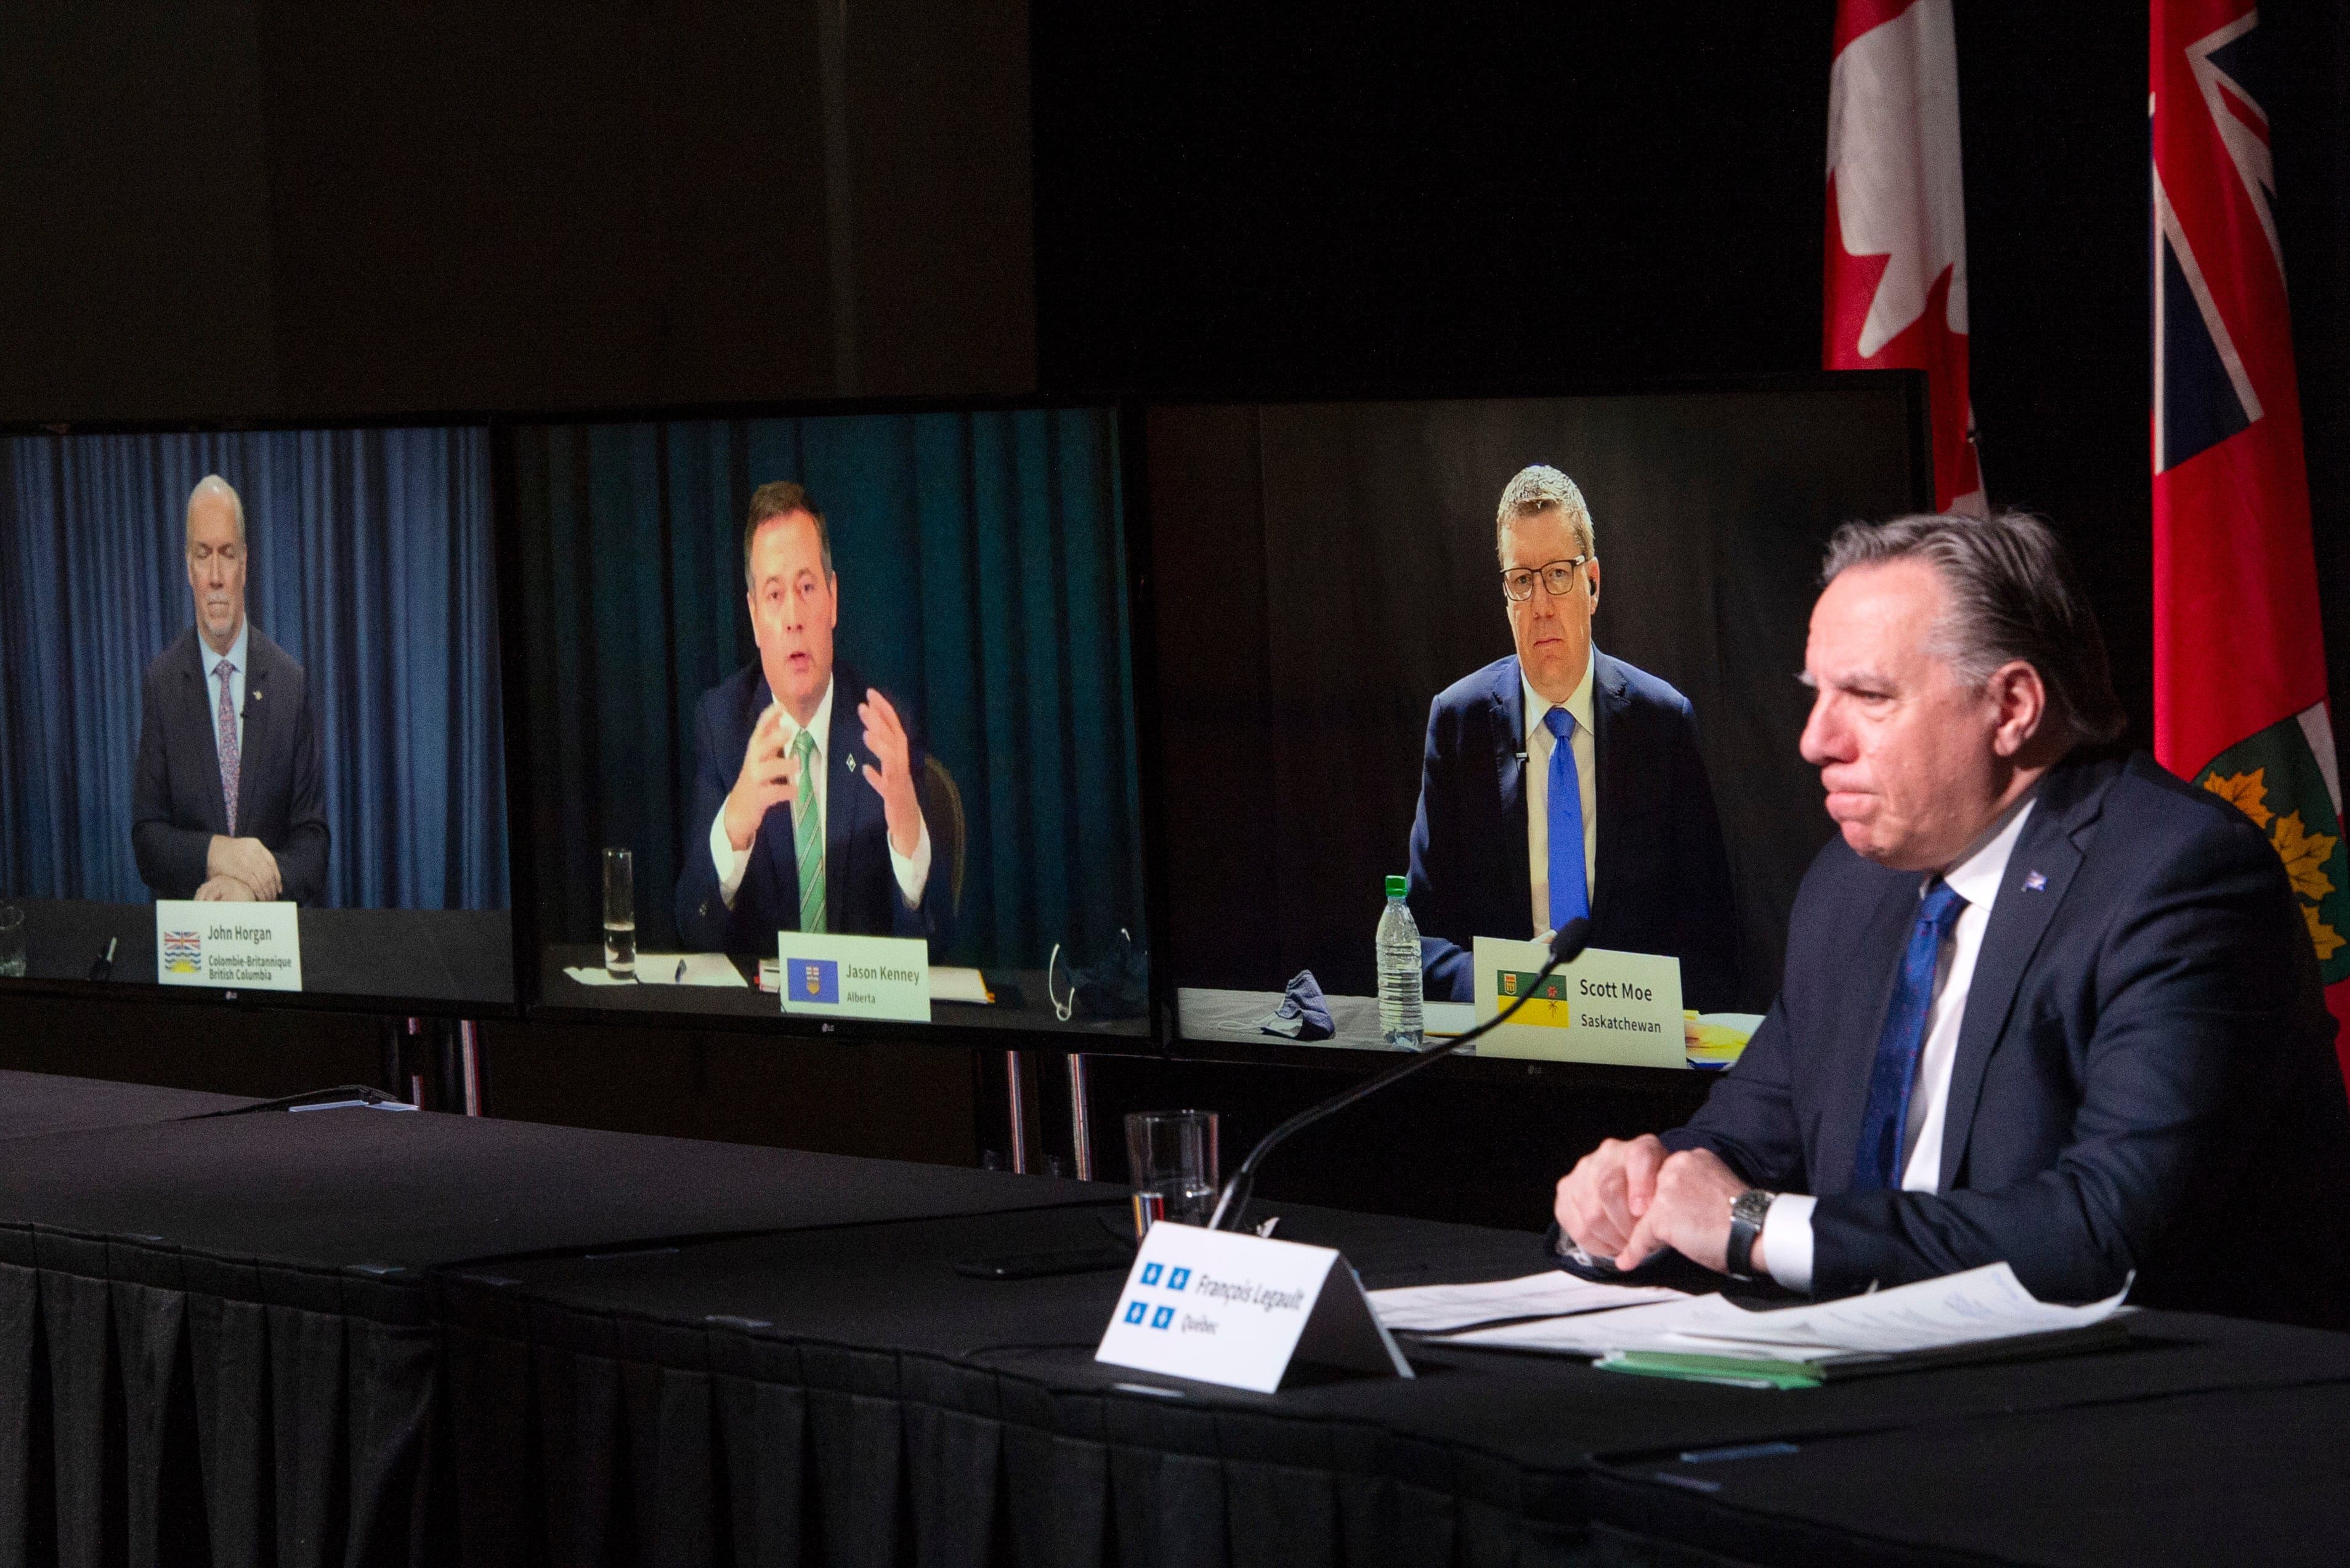
338Canada: A tale of two premiers

Pope Francis apologizes for residential school abuses
And while the Conservative lead is sharply reduced in the party’s Prairie strongholds—a cluster of 44 seats Lyle calls “CPC Strong (Prairies),” ridings like Brandon—Souris, Prince Albert and Calgary—Nose Hill—the Conservative lead in this cluster was so overwhelming in 2019 that, even now, Erin O’Toole’s party maintains a clear lead. He should have little trouble holding these Conservative fortresses.
But elsewhere, the Liberals would go into a campaign with clear and sometimes surprising advantage. “The Liberals are flat in their strong seats,” Lyle said, summarizing the results, “but they are up in every combination of swing seats.”
Highlights from the survey, using Innovative Research’s designated seat clusters:
CPC Strong (Non-Prairies): These are 37 seats that Stephen Harper’s Conservatives won in 2015, even as he was losing power to a Liberal majority. They include ridings like Durham and Sarnia—Lambton in Ontario and North Okanagan—Shuswap in British Columbia. The Conservatives held all of these seats in 2019 under Andrew Scheer.
But now the Liberals are strongly competitive with the Conservatives in this cluster. Conservative support across these ridings stands at an average of 35 per cent, down from 48 per cent in the 2019 election, while Liberal support stands at 36 per cent, up from 27 per cent in 2019. The two parties are essentially tied in this cluster.
CPC-LPC Swing (Non-Ontario): These are 31 seats outside Ontario that have been been defined by close Liberal-Conservative fights over the last decade, often flipping between the two parties. This cluster includes ridings like Fundy Royal in New Brunswick, Yukon, Regina—Wascana, and Calgary Centre. The Conservatives won 28 of these 31 seats in 2011, the year of the Harper majority. The Liberals won 30 in 2015 when the party swept to power. But the Conservatives took 16 of those seats back in 2019.
Now, Lyle finds the Liberal advantage over the Conservatives in this cluster of ridings is 16 points—the same as when the Liberals nearly swept these battlegrounds in 2015.
If those two clusters are bad news for the Conservatives, Lyle finds the Liberals are making trouble for the NDP in a cluster he calls Consistent NDP based on results over the last decade. These are the 29 seats that formed the basis of Jack Layton’s Orange Wave in 2011, but even in 2019 Jagmeet Singh was able to hold 19 of them. (The rest were spread among the Bloc Québécois, Liberals and NDP.) This cluster includes ridings across the country like Laurier—Ste Marie, Hamilton Centre and Burnaby South, whose main similarity is strong support for the contemporary NDP.
But now, Lyle found, NDP support is down 15 points from 2019. Liberal support is up 9 points. So whereas the NDP led the Liberals by 12 points across this cluster at the last election, the Liberals now lead the NDP by 12 points.
It’s a similar story in the 28 Swing NDP ridings. These are ridings like Davenport, Surrey Centre and Port Moody—Coquitlam: Layton won most of them in 2011 but the NDP has had trouble holding them, and in 2019 the Liberals won 17 of these ridings.
Now Innovative Research finds Liberal support up 8 points across these ridings, while NDP and third-place Conservative support are both down six points. So where the Liberals used to win most seats in this category on three-way splits, they now clearly dominate this cluster: 41 per cent Liberal, 25 per cent NDP, 21 per cent Conservative.
One clear departure from this pattern of potential Liberal gains is in Quebec. The Liberals have worked hard to gain voter support with their policies and their stances on controversies like a proposed unilateral constitutional amendment. But in most of the province it all seems to have produced no new advantage. The Bloc can expect to keep many of the seats it now holds.
An exception is the part of Quebec where the Liberals mostly have been fighting the Conservatives more than the Bloc. That’s the distinctive political micro-climate around Quebec City, historically more conservative than the rest of the province. Lyle calls these 13 seats the Capitale-Nationale Plus Chaudière—Appalaches cluster. It includes ridings like Beauce, Louis-Hébert, Québec and Richmond—Arthabaska.
This has been the CPC’s relative Quebec stronghold. It won 9 of these 13 seats in 2019, with 2 each going to the Liberals and Bloc. The Conservative share of the vote in this cluster was 10 points higher than the Bloc’s in 2019, with the Liberals running third. But the Conservative vote is now 10 points lower than in 2019. The Bloc vote is up very slightly. And Liberal support is up seven points. So the region is now a tight three-way race: 29 per cent Bloc, 28 per cent Liberal, 27 per cent Conservative.
No public-opinion survey is a prediction. Campaigns change things. It’s been commonplace in recent years for experts and columnists to wearily predict at the beginning of a campaign that nothing will change, only to be amazed by surprises once voters begin to focus on the choices. But after a year and a half of global crisis, the Liberals would look at these numbers and see more room for early optimism than in 2019.
Stories like this come with explanations of their methodology tacked on the end. Here comes Innovative’s, and it’s long. But what’s perhaps most important for readers is that this sort of survey is much closer to the way election strategists look at voter opinion than the smaller-sample national surveys we see all the time. It’s not much help, when you’re trying to decide how to spend the next $1,000 of your online ad budget, to know that your party’s at 32 per cent nationally. Knowing you’re in a tough fight with the NDP in small towns, or with the Conservatives around Quebec City, is more useful.
OK, here’s the methodology language from Innovative:
This report combines the results of three online surveys conducted in April to June 2021.
In total, the dataset contains an unweighted sample of 6,360 respondents (representative sample of n=5,000 Canadians, 18 years or older.) The online samples of these surveys were conducted through INNOVATIVE’s Canada 20/20 national research panel with additional respondents were provided from Dynata, a leading provider of online samples. The dates and sample sizes for each survey were:
CTM.2104 CTM April 2021: Conducted from April 22nd to May 5th, 2021 with an unweighted sample size of 2,738 (weighted to 2,000)
CTM.2105 CTM May 2021: Conducted from May 7th to May 31st, 2021 with an unweighted sample size of 2,579 (weighted to 2,000)
CTM.2016 CTM June 2021: Conducted from June 3rd to June 8th, 2021 with an unweighted sample size of 1,043 (weighted to 1,000)
The combined sample is weighted to n=5,000 by age, gender and provincial sub-regions using the latest Statistics Canada Census data. Results are weighted to ensure that the overall sample’s composition reflects that of the actual population to provide results that are intended to approximate a probability sample.
Respondents were grouped together into their federal electoral districts based on their postal code. A weighted total of 107 respondents could not be grouped into a federal electoral district because they did not provide a postal code or their postal code matched multiple districts.
INNOVATIVE provides each panellist with a unique URL via an email invitation so that only invited panel members are able to complete the survey, and panel members can only complete a particular survey once. Sub-regional quotas are set within regions to ensure there is a representative sample of respondents from across the entire region.
This is a representative sample. However, since the online survey was not a random probability-based sample, a margin of error cannot be calculated. Statements about margins of sampling error or population estimates do not apply to most online panels.
Related Posts
Inflation rate surpasses a three decade high

New federal budget will include up to $8 billion in defence spending

The federal budget is a mixed bag
Jonathan Vance pleads guilty, gets conditional discharge
Get the Best of Maclean’s straight to your inbox.
Sign up for news, commentary and analysis. Join 60,000+ Canadian readers.