Who wins Election 2019 under a ranked-ballot system
Philippe J. Fournier: The system the Liberals once favoured would have benefitted that party—and exposed a real Conservative weakness
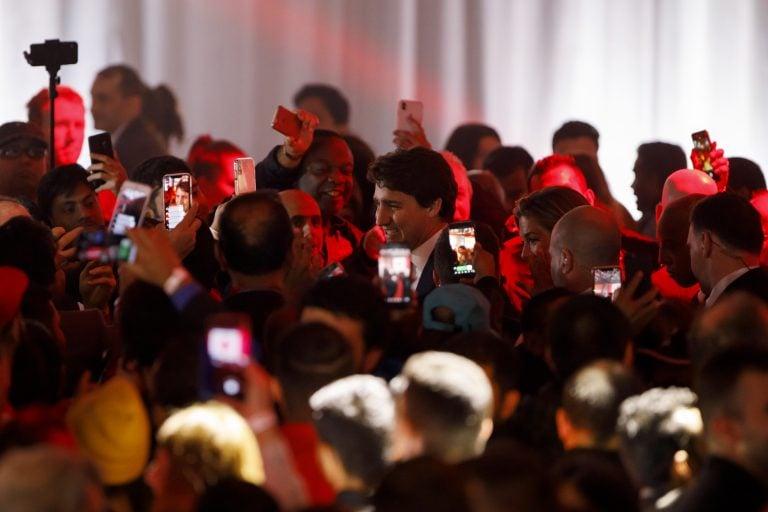
Trudeau walks through supporters after delivering his victory speech at his election night headquarters on Oct. 21, 2019 in Montreal (Cole Burston/Getty Images)
Share
Shortly after the “Proportional Representation Thought Experiment” I published near the end of the federal campaign, several readers asked me to perform other kinds of simulations to test various voting systems. Even though electoral reform will most likely not be on the radar of this 43rd legislature, I am always willing to play a little politics-fiction—especially if data of quality is available.
How about an instant runoff voting system (IVR), or ranked-ballot? Under this system, voters do not put an X or a check mark next to their preferred candidate, but rather ranks them with numbers “1”, “2”, “3”.
This electoral system was the one preferred by the governing Liberals when the electoral reform debate raged on two years ago. Those who followed these consultations closely will remember that the NDP and Greens wanted proportional representation, the Liberals insisted on a ranked-ballot and the Conservatives wanted no reform at all. Without a consensus, the Liberals abandoned electoral reform altogether, leaving behind several disappointed (and angry) voters.
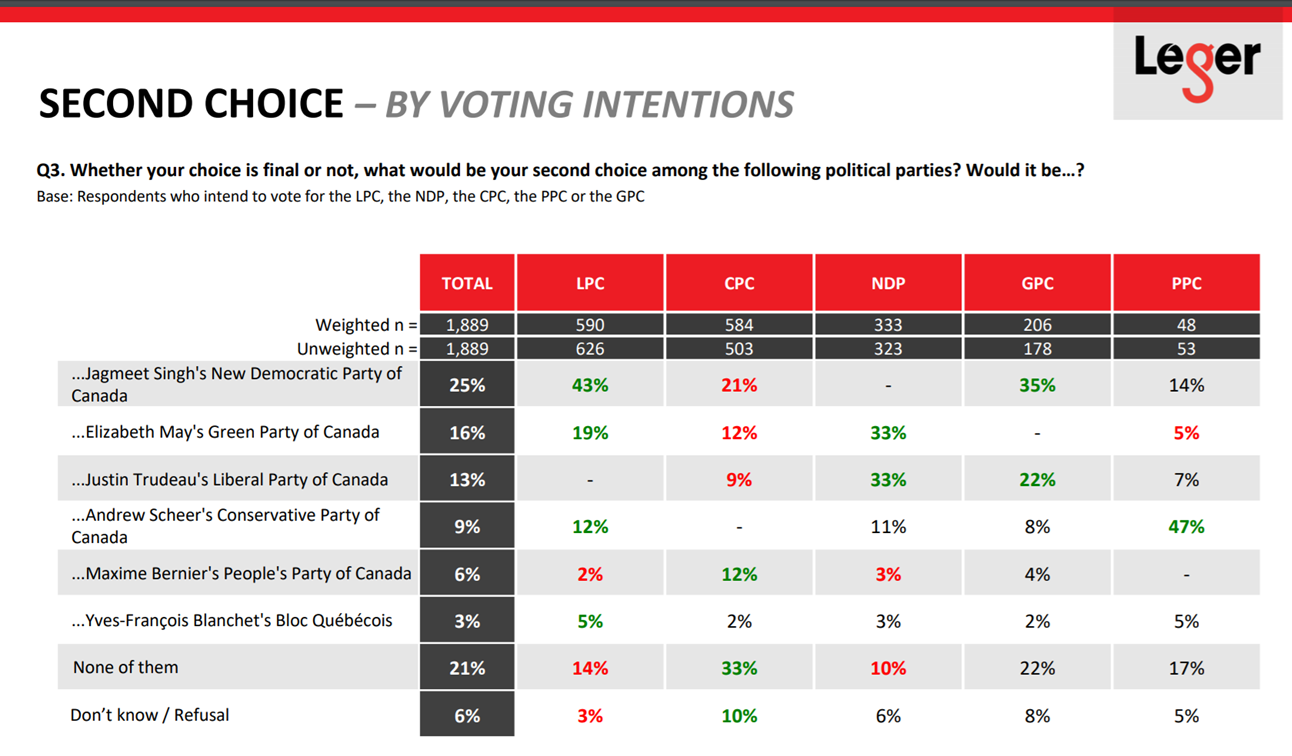
Near the end of the last campaign, Léger (among the most accurate pollster in this election) published a poll that measured voters’ second choices—and those were tabled both according to region and party preferences. You can find the Léger/Canadian Press poll here. Scroll to pages 8 and 9 for the full breakdown of voters’ second choices.
We will use this precious data, along with the actual election results to simulate the results of a ranked-ballot election. This simulation went according to the following rules:
- We take the results from the federal election in all 338 electoral districts. Candidates from parties that won over 50 per cent of the vote in a single riding are automatically elected. A total of 123 candidates reached that threshold on Oct. 21: 57 Conservatives, 54 Liberals, 11 Bloquistes, and one New Democrat (and no Greens);
- If no candidate reaches 50 per cent, the last-place candidate is eliminated and votes that were cast for him/her are redistributed according to those ballots’ second choices. We repeat this cycle until one candidate reaches 50 per cent.
- Obviously, we have to work with the data we have, not the data we wish we had—meaning that we have no information on voters’ third and fourth choices. Therefore, this simulation only uses voters’ second choices according to the aforementioned Léger poll. It is an imperfect system, but I wouldn’t want to just make numbers up. Moreover, since we have no specific information on second choices of voters who voted for smaller parties or independent candidates, those were simply ignored in this simulation.
Once again, this is an exercise of politics-fiction: It is just a way to picture what things could look like. As it was mentioned in this hypothetical Proportional Representation column from last month, they are mere “thought experiments”, or Gedankenexperiment.
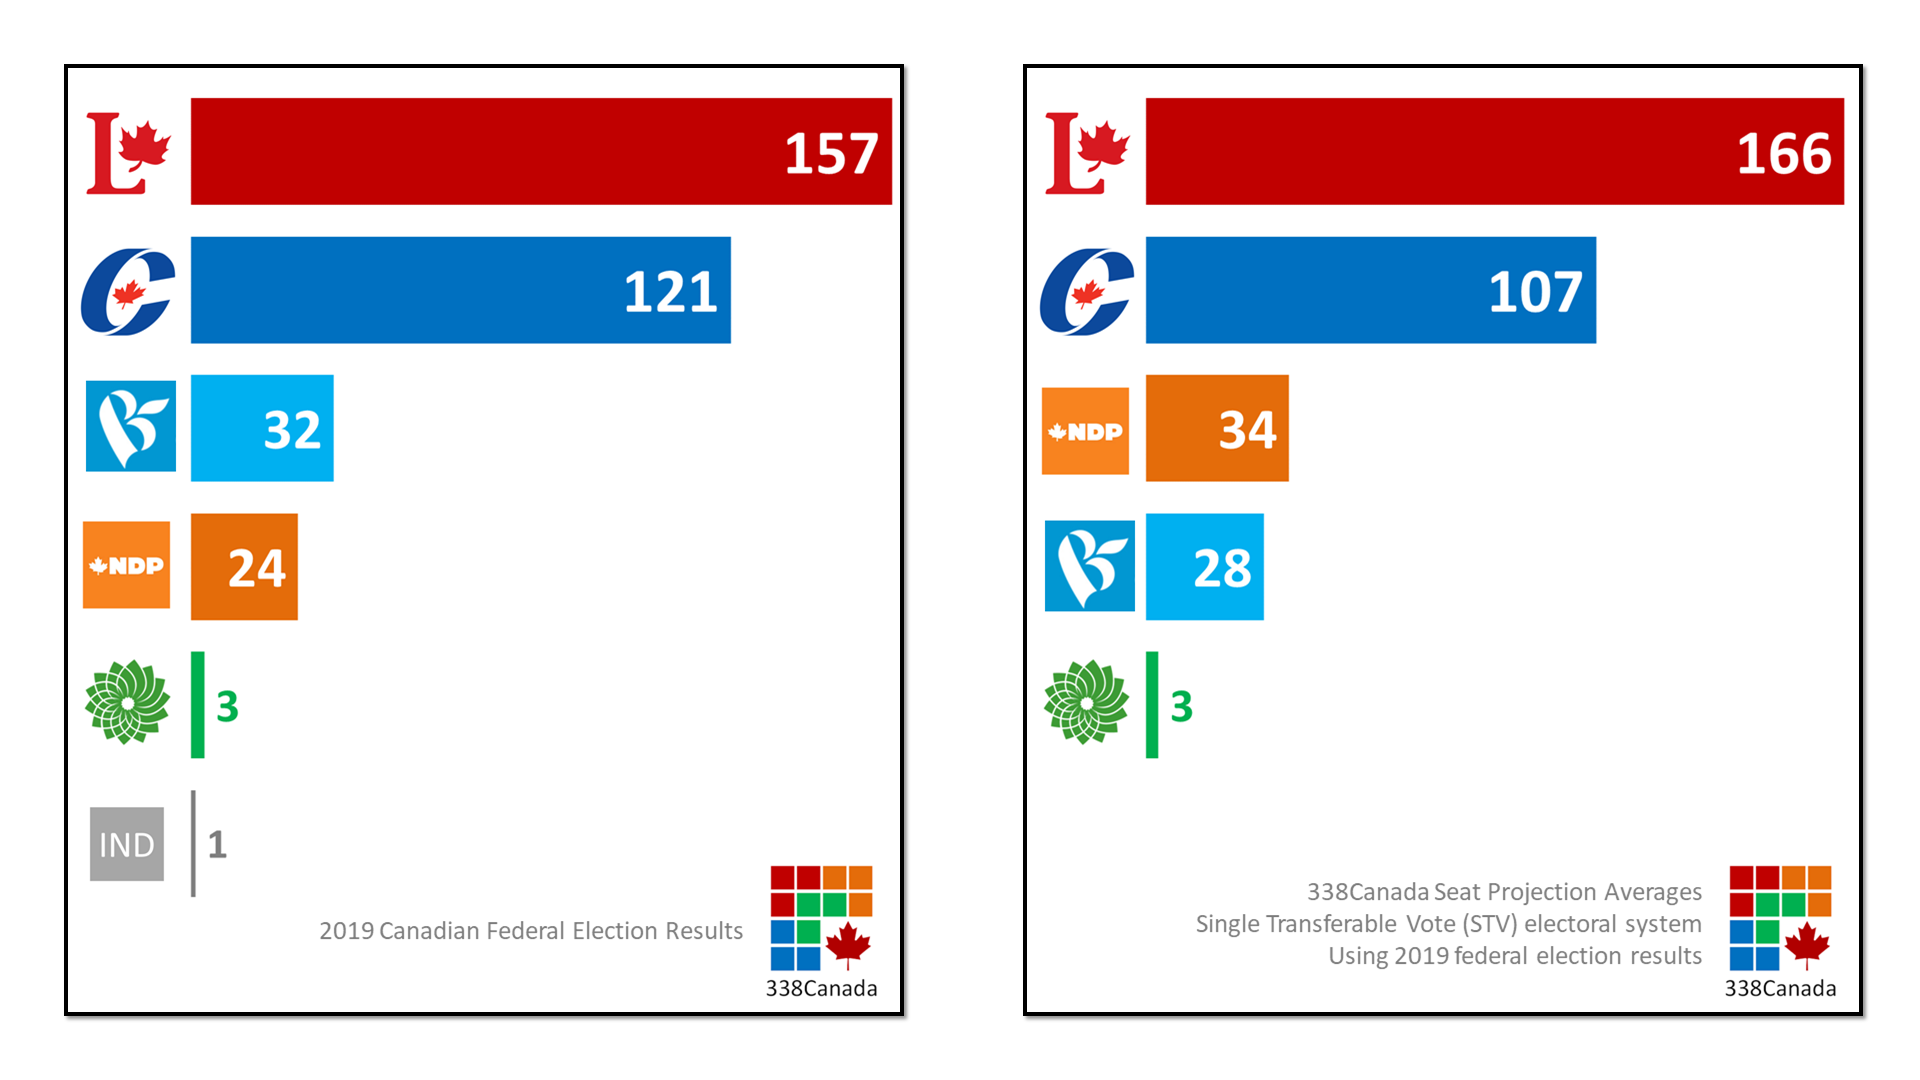
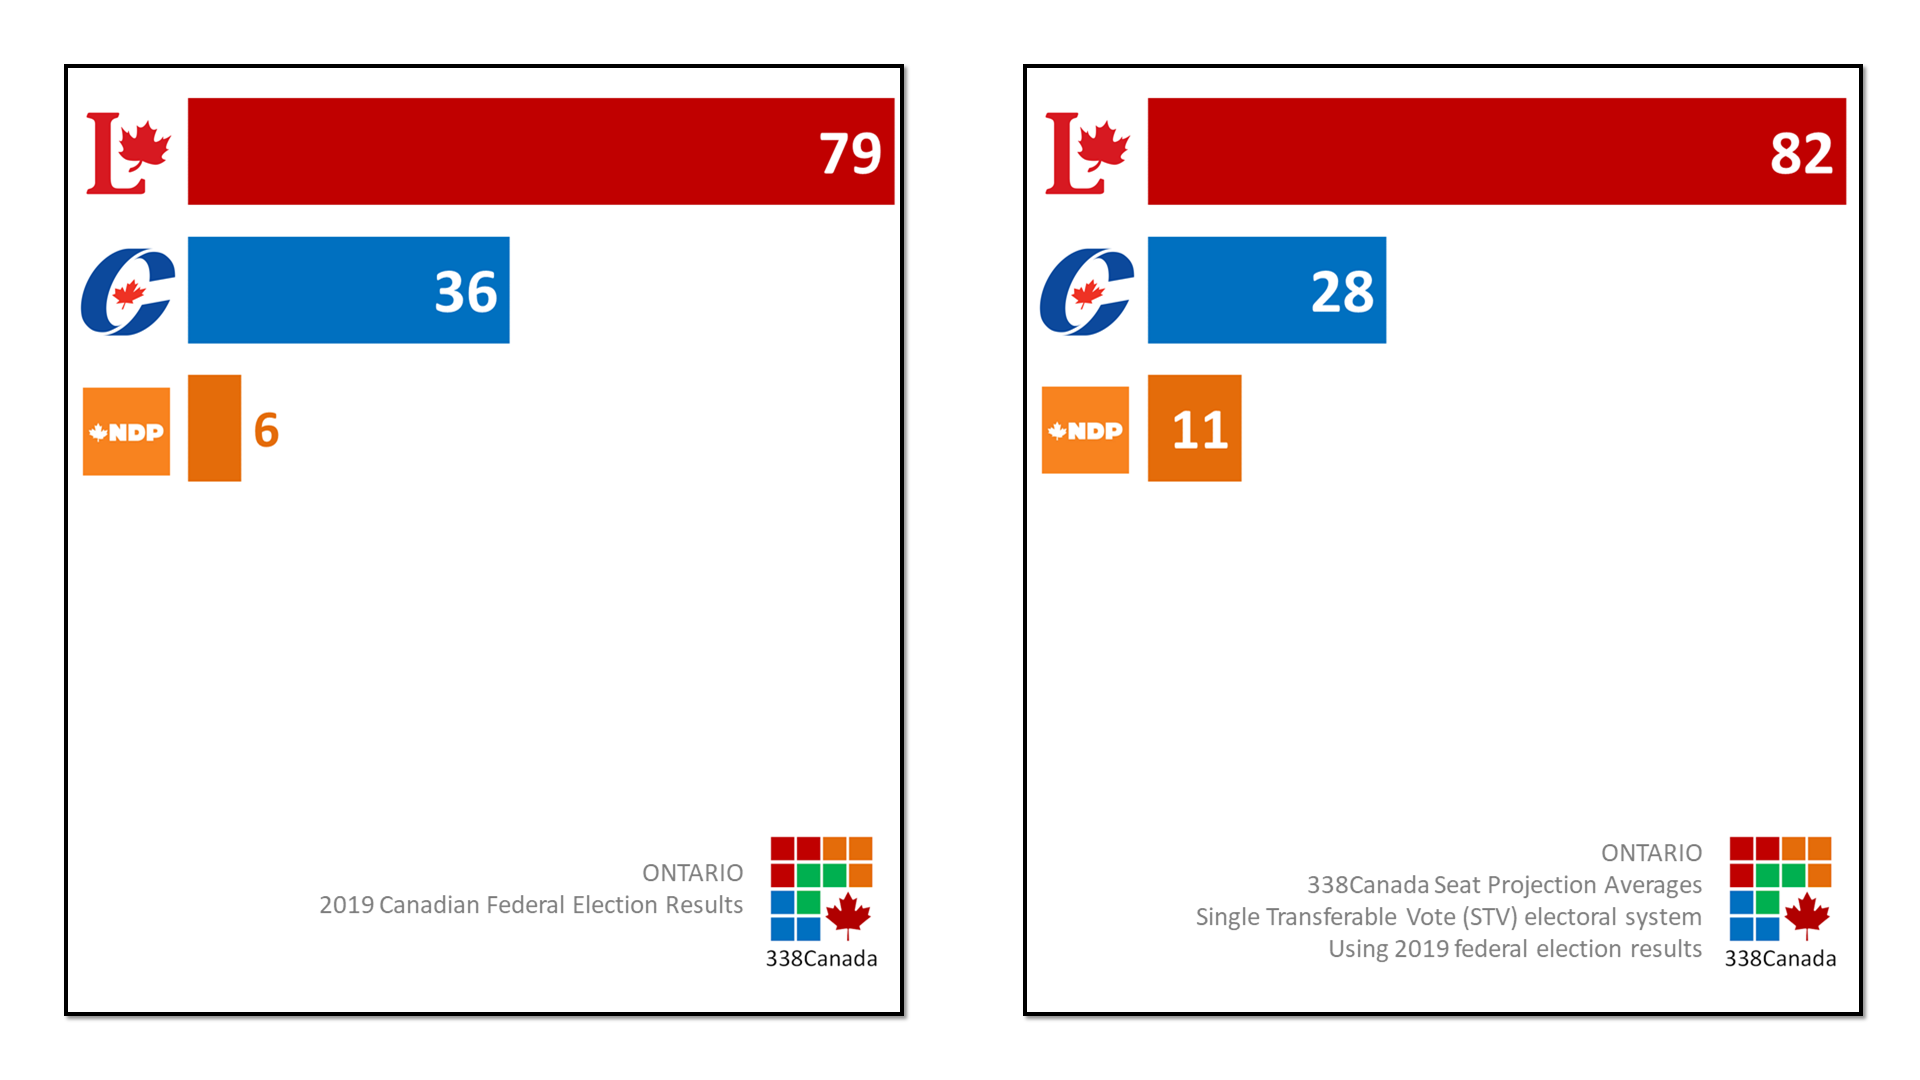
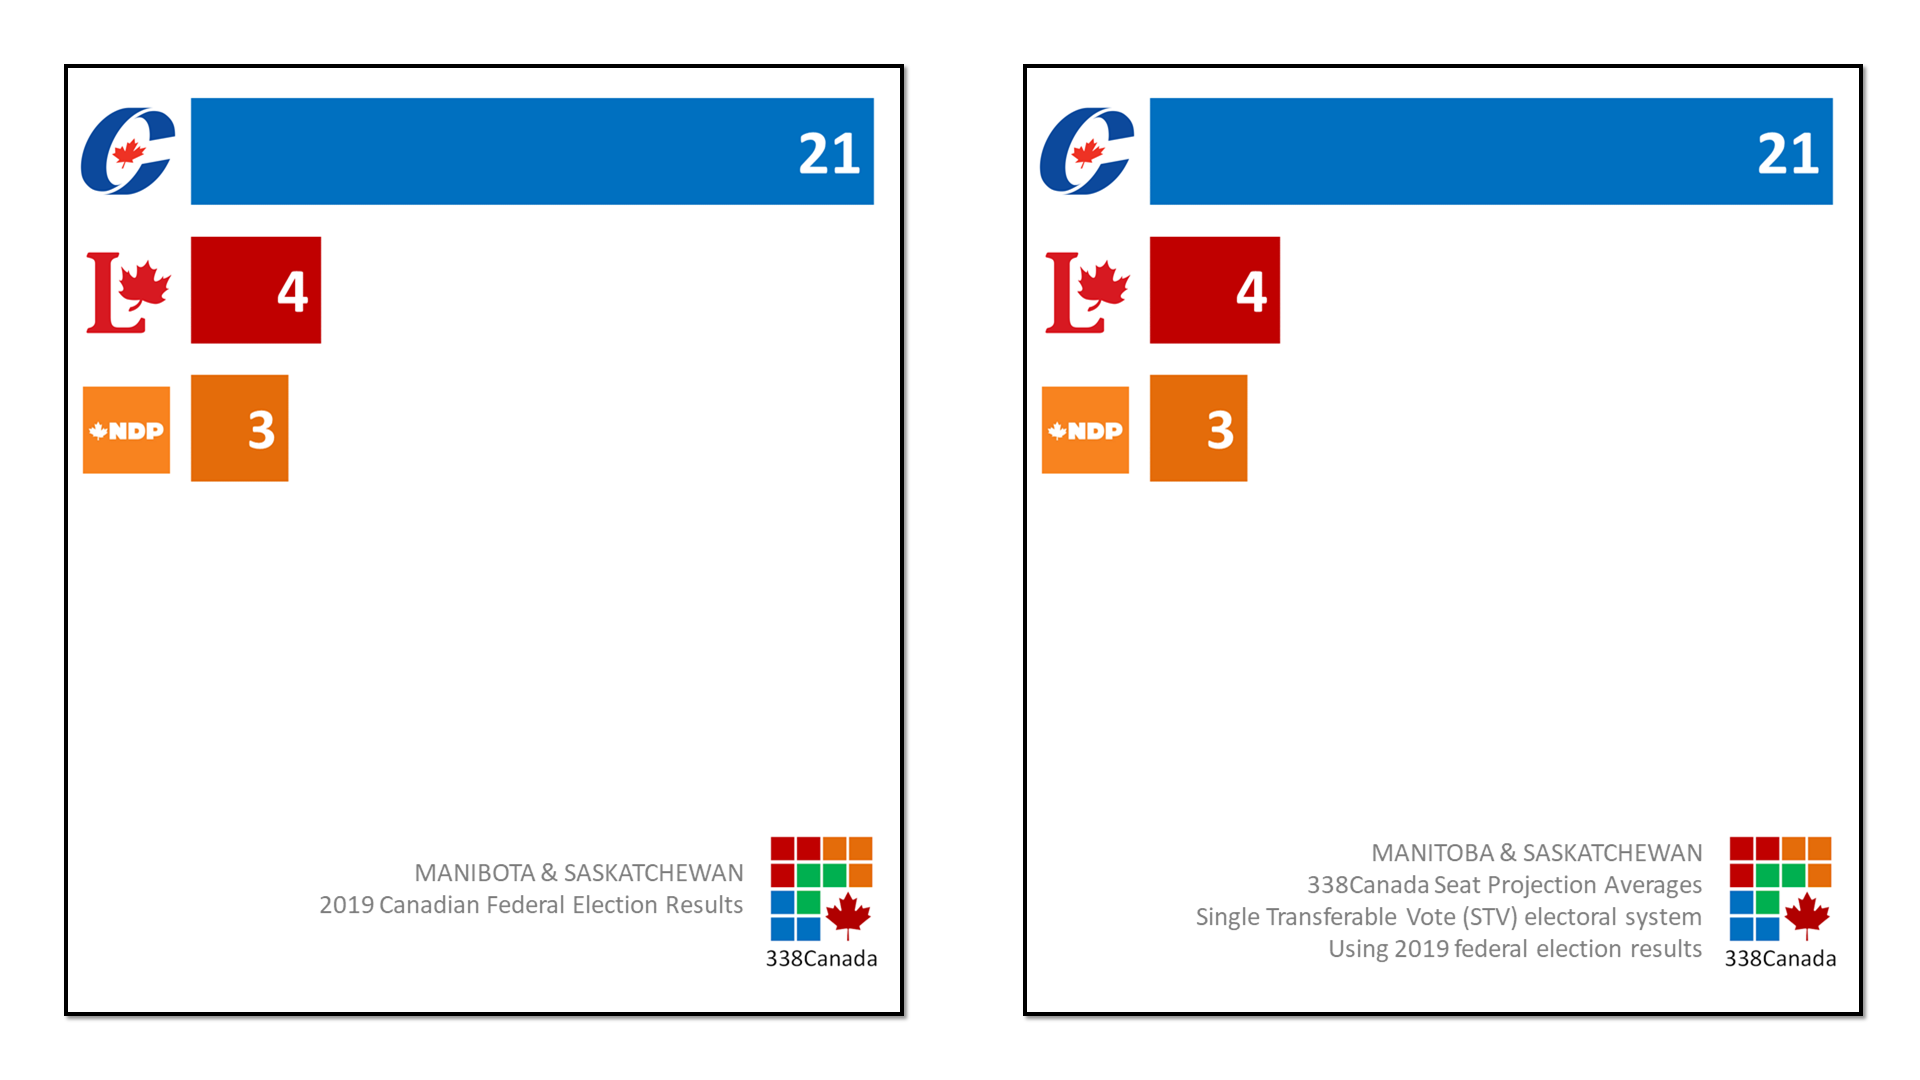
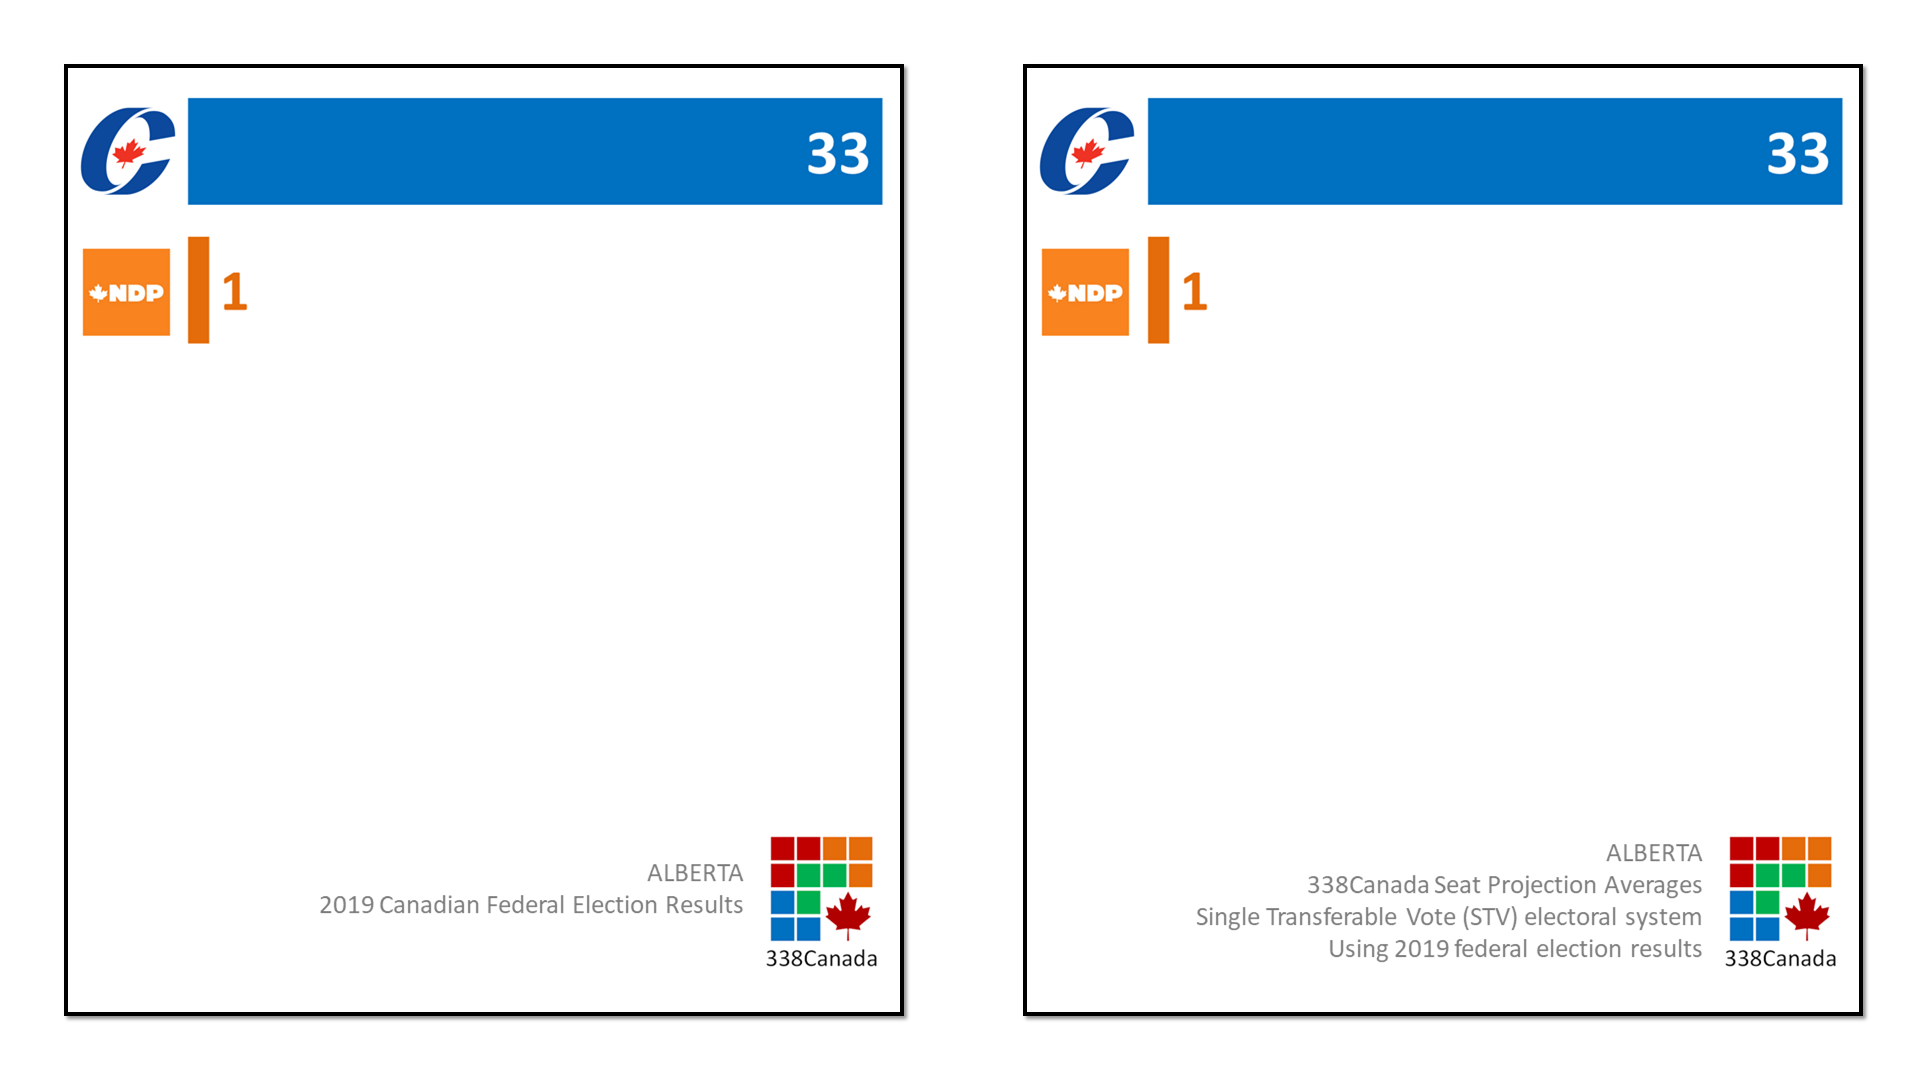
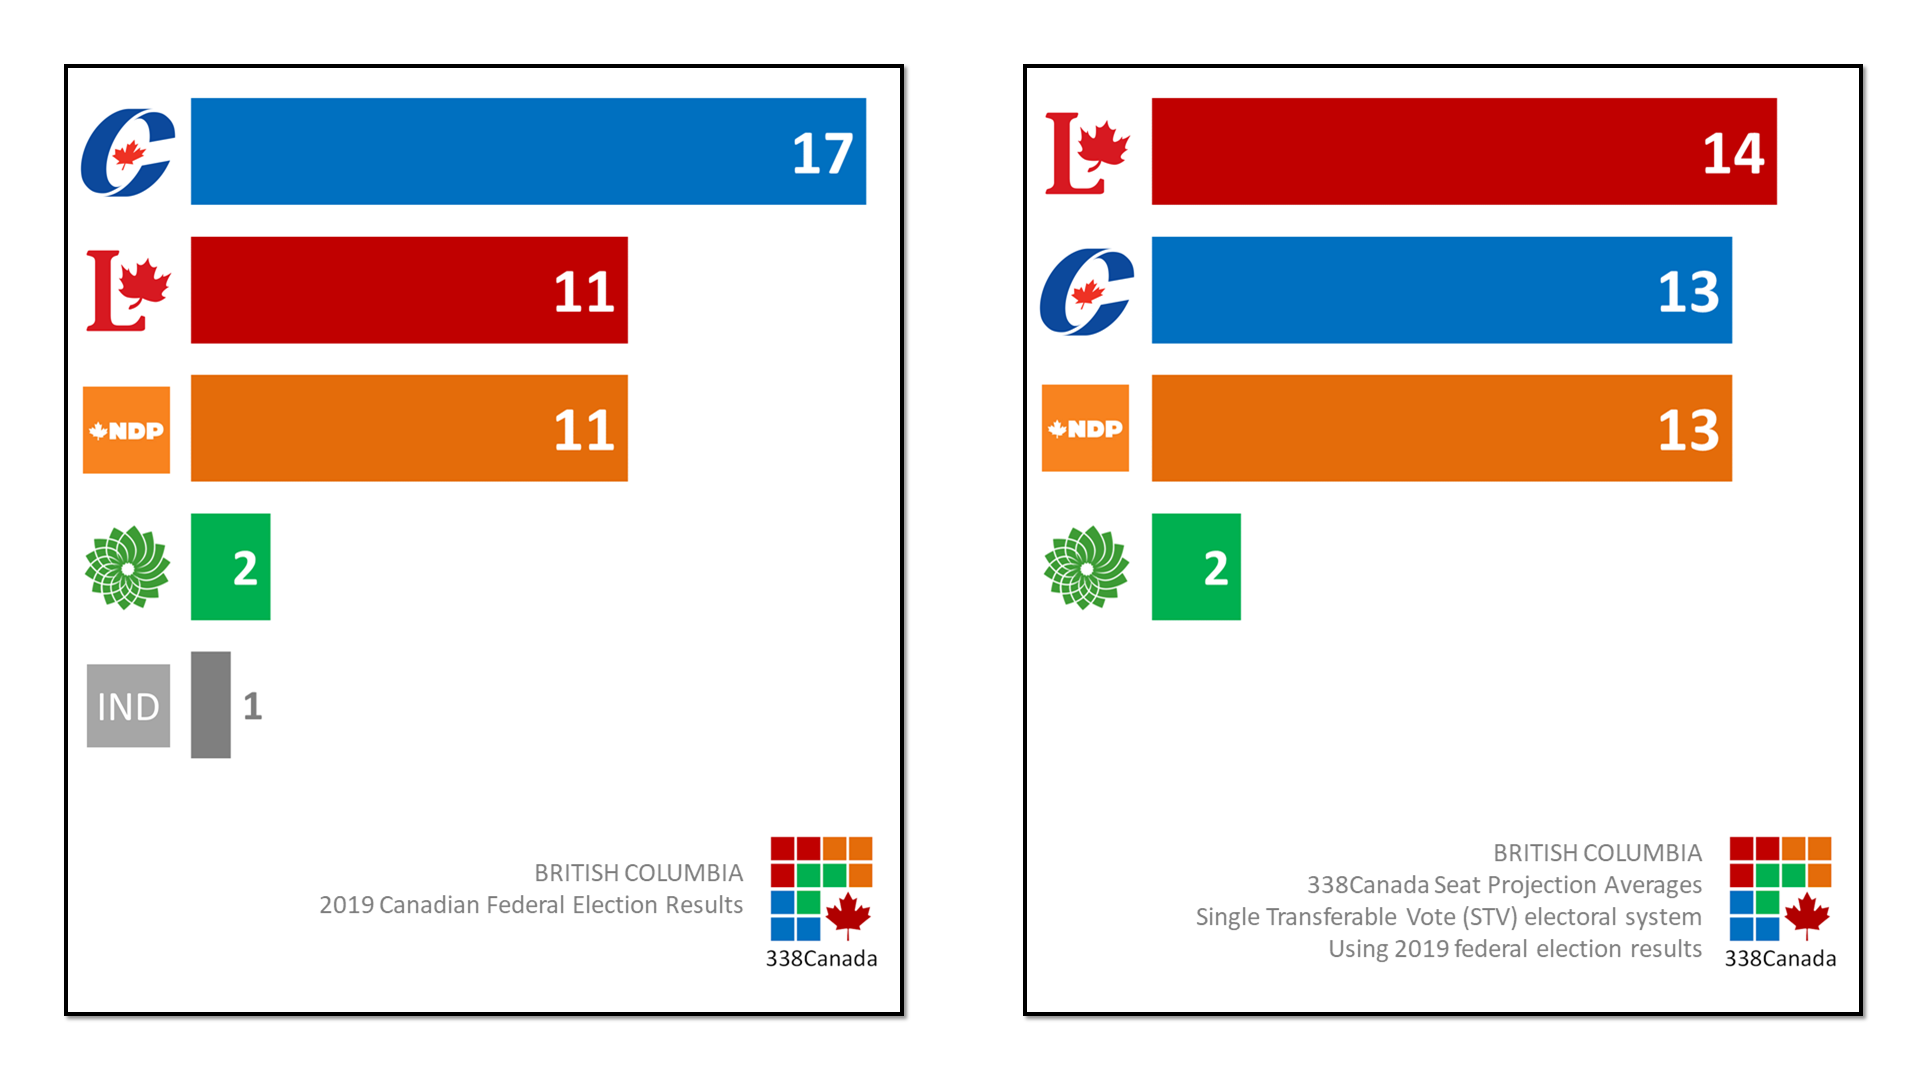
Consider the following graphs. On the left are the actual election seat results, and on the right the seat averages according to the ranked-ballot rules stated above:
At first sight, it is striking how similar those results actually are. The Liberals, which won 157 first-past-the-post (FPTP) seats last month, win an average of 166 seats when second choices are considered. When digging a little deeper into the results, we notice the LPC also finished second in 115 districts, the most of any party (the CPC came in second in 114 districts). The Léger poll shows the Liberals were the second choices of 13 per cent of respondents, and it is enough to keep them in comfortably in first place, just short of a majority.
The current version of the Conservatives would lose the most under a ranked ballot system. According to this simulation, they would go from 121 seats in FPTP to an average of 107 seats.
This should not be surprising considering the CPC was the second choice of only 9 per cent of respondents (including nearly half of PPC voters). Several observers noted that should the CPC have won the most seats on election night, it would have been hard pressed to find partners to support their policies. (For instance, under a CPC minority scenario, which other party would have supported scrapping the carbon tax?) These numbers tell us that although the Conservatives did win the popular vote, the anti-Conservative vote was somewhat stronger than the anti-Liberal vote.
It should not be surprising that the NDP gains the most from this ranked ballot simulation. According to the Léger poll, 25 per cent of respondents had Jagmeet Singh’s party as their second choices, by far the most of any party—including 21 per cent in Quebec and 29 per cent in Ontario.
However, we should state again that these results are highly similar as those of the election. Would a ranked ballot really produce a Parliament more representative to Canadian voters’ wishes?
Let’s look at some of the regional results.
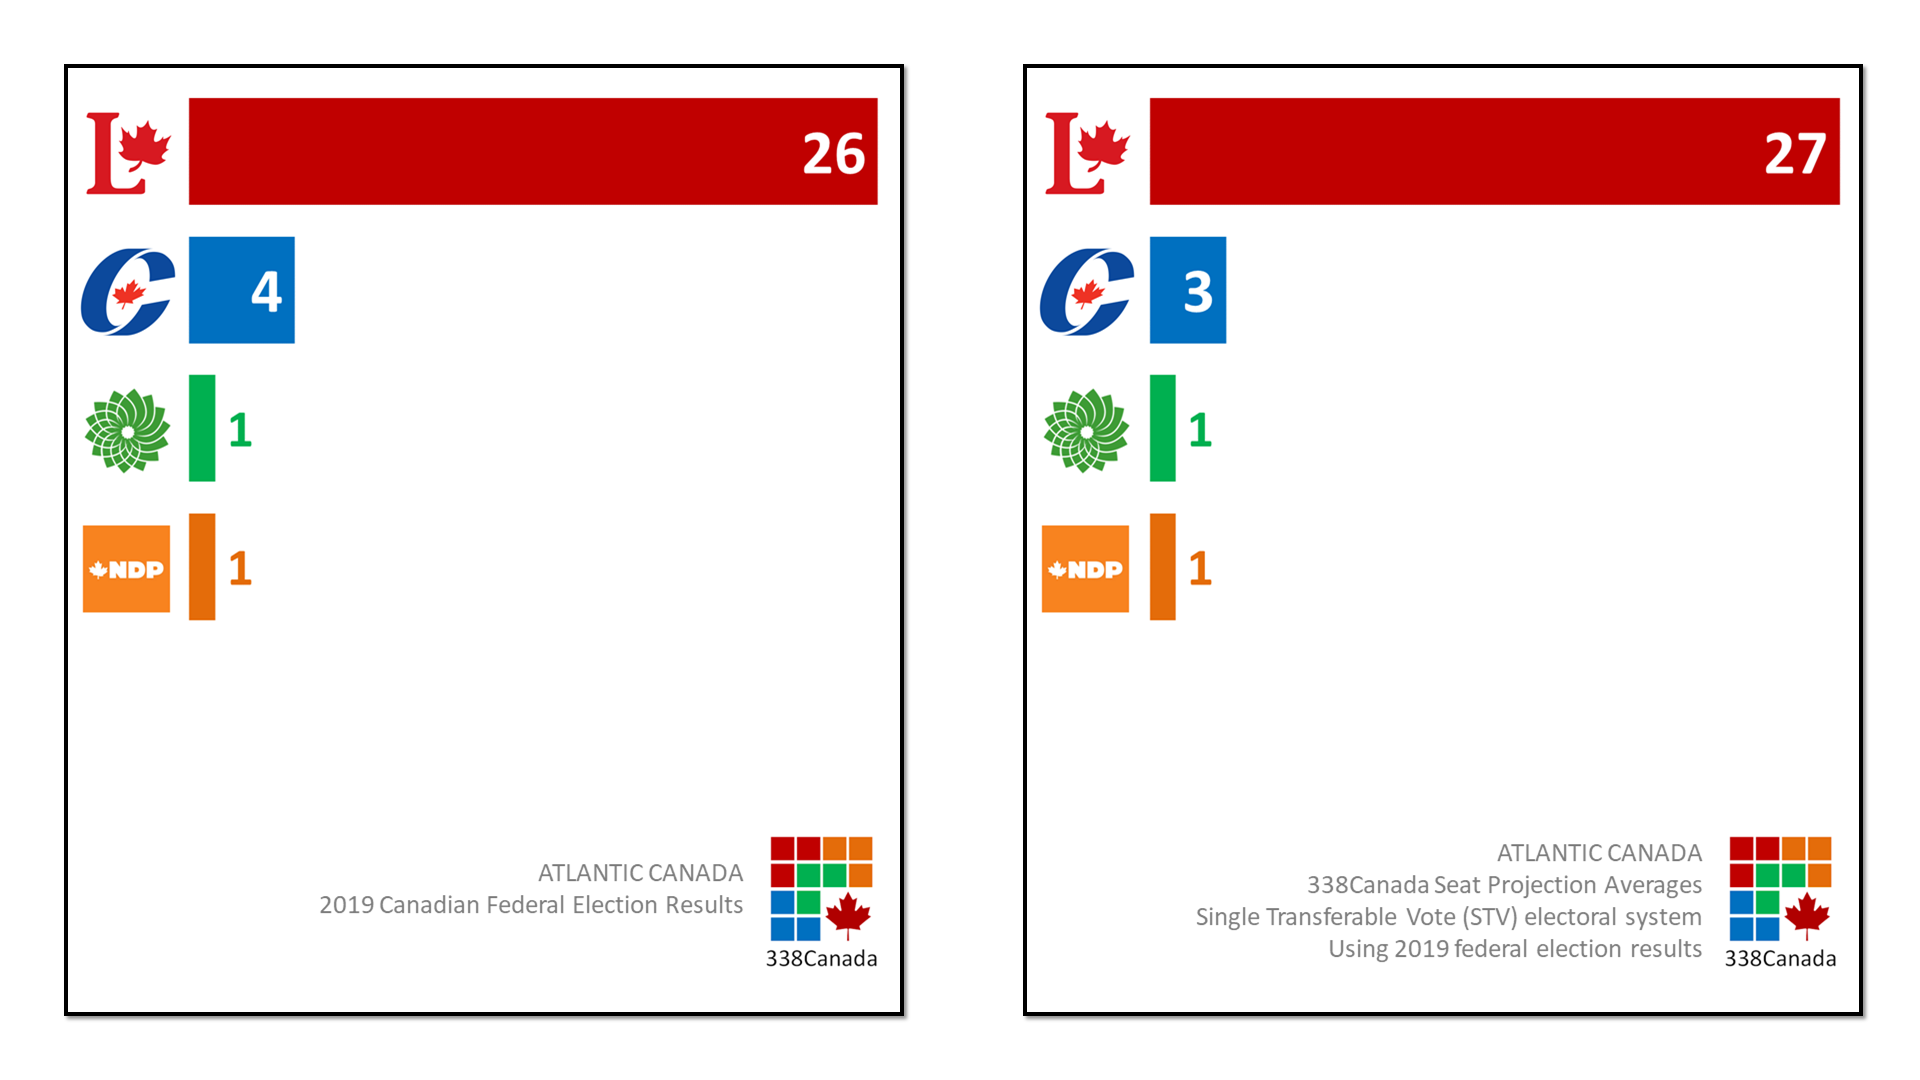
Here are the results in Atlantic Canada. On the left, actual election results; on the right, the simulation results:
Even by considering second place votes, the simulation results in Atlantic Canada are almost identical to the actual election results.
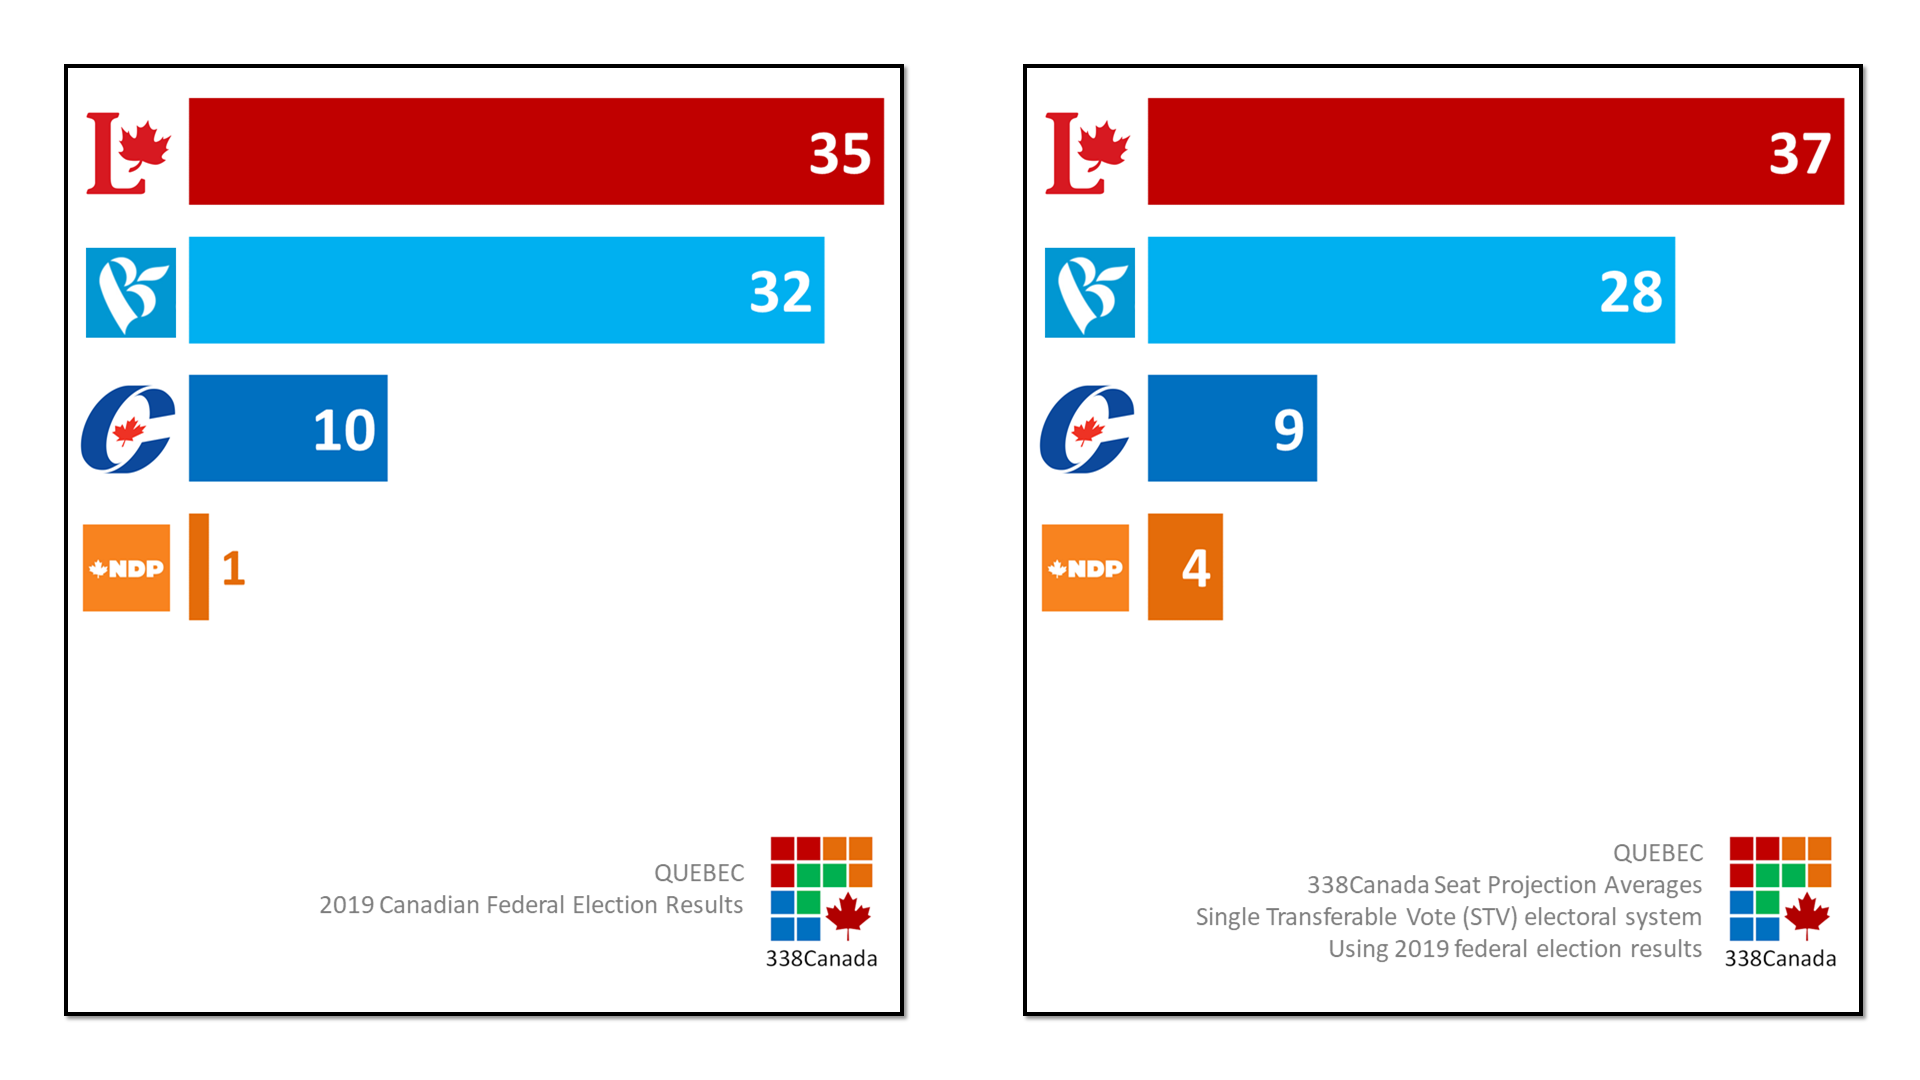
In Quebec, the NDP would have fared a little better than it did, since it has the most second place votes of any party. But still, the results are highly similar to the Oct. 21 seat count:
In Ontario, the Conservatives would drop an average of eight seats to the benefit of the NDP and the Liberals:
In the Prairies and in Alberta, the simulation results are identical to the election results:
The case of Alberta is pretty straight forward: of the 33 seats the CPC won in the province, 32 were won with more than 50 per cent of the popular vote, meaning that second choices were not considered at all in these ridings.
Finally, in British Columbia, both the Liberals and NDP would take a modest bite out of the CPC seat totals, but overall the results are highly similar:
Naturally, we would now have to question voters on the following: how many Liberal voters in this election would have put the NDP or the Greens ahead of the Liberals in a ranked ballot system? According to the poll average, the NDP and Greens slightly underperformed on election day—could it be that a fraction of those voters decided to vote strategically for the Liberals hoping to block the Conservatives? This is very plausible, but also hard to quantify with currently available data. We could imagine both the Greens and NDP winning a handful more seats apiece in this scenario.
Nevertheless, it looks as though the Liberals would still have won the most seats under a ranked-ballot system, and the Conservatives would no doubt have done worse.
It is somewhat curious that the party that won the popular vote also has the fewest second place support among the main national parties, but this is yet another way to emphasize that the Conservatives, although they have the most solid and faithful base of voters in the country, absolutely must broaden their tent in order to win. Pleasing your base at the cost of antagonizing others dramatically narrows the available paths to victory.
CORRECTION, Nov. 13, 2019: An earlier version of this story referred to the ranked ballot system as a single transferable vote system. The correct term is instant runoff voting.
