The Maclean’s-Pollara Ontario poll: Doug Ford’s lingering advantage
However you cut the numbers—by region, demographics or voter enthusiasm—the PCs remain in command

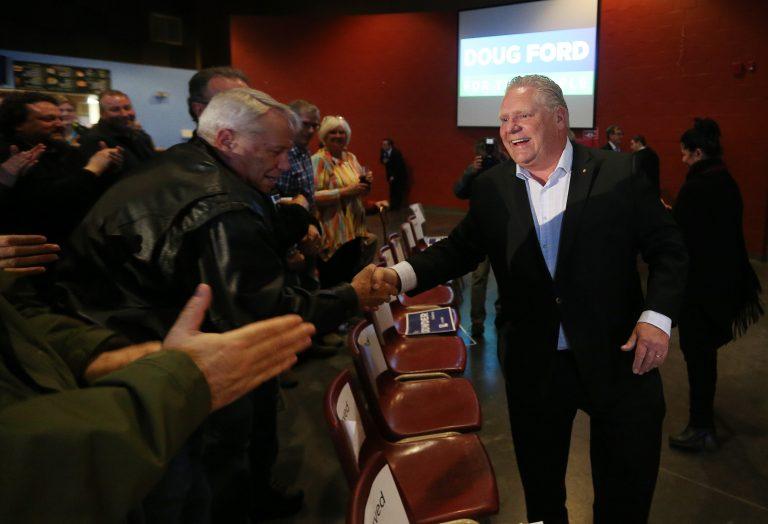
PC Leader Doug Ford at a rally attended by approximately 300 people at Cambrian College in Sudbury. (Steve Russell/Toronto Star via Getty Images)
Share
Let’s go back to the Maclean’s-Pollara Ontario election poll we reported on Monday, to see why its most surprising element—Andrea Horwath and the NDP are in second place!—may mask the significance of the least surprising element—Doug Ford and the Conservatives are in first!
By several measures, climbing from second to first place looks like a challenge for the Horwath NDP. Ford’s Progressive Conservatives aren’t clinging to a tenuous advantage. They’re ensconced.
First, geography. In Toronto, the most densely populated part of the province (duh), Pollara found the New Democrats in third place, at 26 per cent support behind the Liberals, at 31 per cent, and the PCs at 38 per cent. The margin of error increases for smaller regional subsamples, so you shouldn’t take any of these numbers to the bank, but they at least give you an idea of the landscape.
And most of Ontario’s landscape is tinted blue for the moment. In Ottawa, the PCs dominate at 49 per cent to 28 per cent for the Liberals and 20 per cent for the NDP. In the rest of Eastern Ontario, it’s 43 per cent PC, 26 per cent NDP and 18 per cent Liberal. Ford’s party is also solidly in first place in Peel region, York-Simcoe-Durham and Southwestern Ontario. Only in the Hamilton-Niagara region west of Toronto does the NDP dominate, at 58 per cent to 27 per cent for the PCs and a paltry nine per cent for the Liberals. In Northern Ontario, New Democrats and Conservatives are tied at 34 per cent each, with the Liberals well back on 16 per cent.
Second, demographics. Ford’s party has a solid advantage among male voters, with 45 per cent of the decided vote to 25 per cent for the NDP and 24 per cent for the Liberals. But the PCs are also tied with the NDP for the support of women voters at 35 per cent, compared to 22 per cent for the Liberals. Ford’s party is in the lead among immigrants to Canada—40 per cent to 30 per cent for the Liberals, with the NDP pulling up the rear at 23 per cent—and among respondents whose parents were immigrants, at 43 per cent to 29 per cent for the Liberals and 21 per cent for the NDP. The NDP is also third among respondents who identified themselves as members of visible minorities, 44 per cent of whom would vote Liberal, compared to 36 per cent PC and 17 per cent NDP.
READ MORE: The Maclean’s-Pollara Ontario Election Poll: Welcome to third place, Liberals
Finally, there’s what Pollara’s Don Guy calls an “enthusiasm gap” in the Conservatives’ favour. Before they were asked which party they plan to support, respondents were asked how enthusiastic they are about voting. A response of “0” would mean not at all, a “10” would mean they were extremely eager, with the rest of the range in between. When responses on that scale are compared to party preference, the results are striking.
Among respondents who said they’re a “10” on the enthusiasm scale, 53 per cent were planning to vote PC, compared to 23 per cent for the NDP and 21 per cent for the Liberals. Among those who scored themselves from 8 to 10, 47 per cent support Ford’s party, 26 per cent Horwath’s, 23 per cent Wynne’s. At the lowest end of the scale, those whose self-diagnosed enthusiasm for voting was between 0 and 5, a plurality, 36 per cent, plan to vote NDP if they bother to vote at all. The Conservatives were second at this low end, at 29 per cent, the Liberals third at 22 per cent.
Conservative supporters are really sure they’re going to vote, they solidly outnumber other parties’ supporters in most regions of the province, and they are more numerous than NDP supporters among immigrant and visible-minority respondents. That’s one reason why the Conservatives aren’t yet showing signs of worry about the NDP’s progress.
METHODOLOGY: Pollara Strategic Insights conducted a 10-minute online survey of 1,010 Ontarians who self-identified as eligible to vote in Ontario Elections from May 3 to 4, 2018. Because the sample is based on those who initially self-selected for participation in the panel rather than a probability sample, no estimates of sampling error can be calculated. All sample surveys and polls may be subject to multiple sources of error, including, but not limited to sampling error, coverage error, and measurement error. A probability sample of equivalent size would have a margin of error of plus or minus 3.1 per cent.
The data are statistically weighted to ensure the sample’s regional, age and gender composition reflects that of the Ontario adult 18+ population and accounting for the increased propensity to vote with age.
Results are expressed as percentages unless otherwise noted. Results may not add to 100 per cent due to rounding or multiple responses.