
Why do they call it Dutch ’disease,’ anyways?
So Dutch consumers are roughly 10% better off than they would have been, but companies have been able to compete only by paring their profit margins.
"The Dutch disease," The Economist, November 26, 1977
Talk about burying the lede. That sentence appears at the end of the 10th paragraph of the much-referred-to but rarely read article in The Economist that coined the phrase "Dutch Disease." In the normal course of things, a 10 per cent increase in consumers’ purchasing power would be the stuff of banner headlines, but, for some reason, The Economist chose to hide that point deep into the story and qualify it with a caveat about how hard it had become for companies to compete. (The answer to that, by the way, is: "So what if producers are struggling?" What really matters is consumer welfare.)
My take on the Dutch Disease debate can be summed up as follows: Why are we calling it a disease?
The Economist was reporting on the difficulties Dutch manufacturers were having in the wake of the discovery and exploitation of natural gas reserves in the Netherlands in the 1970s. The parallels with the recent Canadian experience are obvious: the surge in the prices of oil and other commodities that began in 2002 has been accompanied by a fall in employment in the Canadian manufacturing sector. (Here I’m going to concentrate on the period 2002-2008; the recession complicates the analysis of the last four years.)
No-one can plausibly deny that the increase in resource prices during 2002-2008 led to a reduction in manufacturing employment. But this shift was part of a labour market adjustment that produced broad-based increases in wages and incomes — and broad-based increases in wages and incomes are good things.
The rest of this post is based on a presentation I gave at a the symposium on Dutch Disease organised by the University of Calgary’s School of Public Policy held in Toronto on March 6-7. (It was there that the University of Alberta’s Andrew Leach drew my attention to that remarkable quote.)
The Dutch Disease story is one of sectoral shifts. Let me explain. Suppose, for now, that there are only two sectors in the economy: manufacturing and resources. (If this level of abstraction bothers you, replace "resources" with "non-manufacturing" in what follows.) If people can work in either sector, wages will be the same in both — otherwise, workers would move to the sector that pays more.
Now suppose that world demand for Canadian resources increases. This increases the demand for labour in the resources sector:
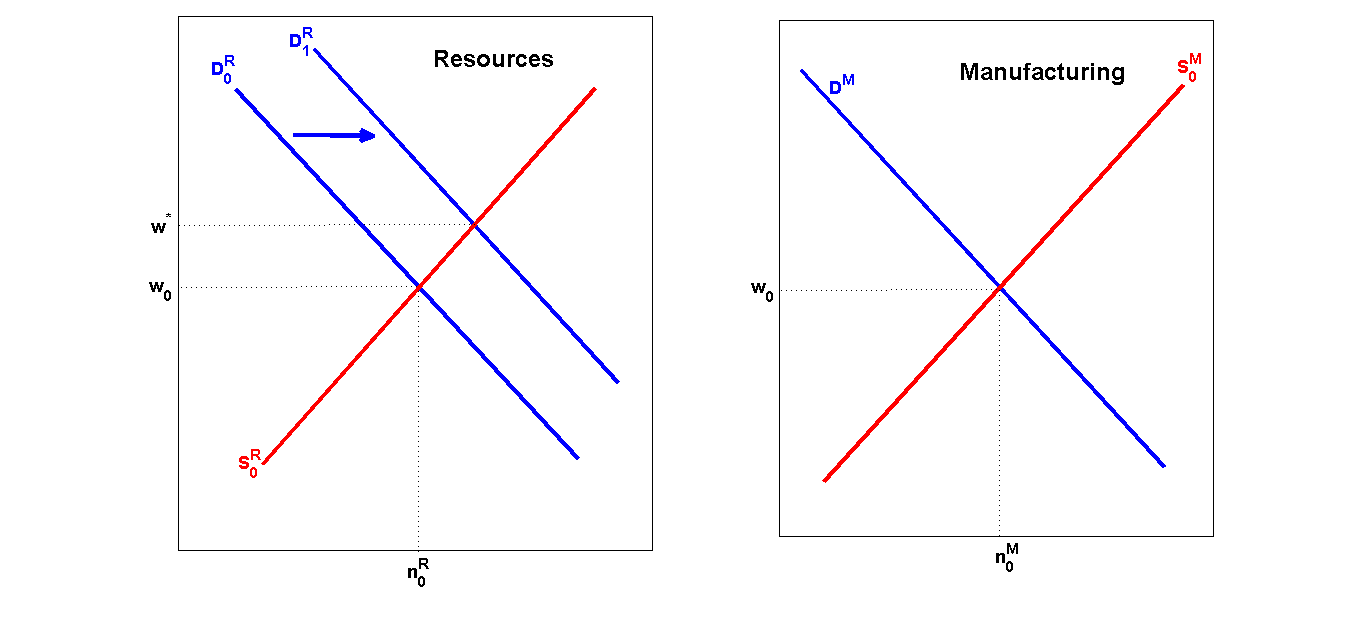 The blue lines are the demand for labour in the two sectors (higher wages reduce the quantity of labour demanded) and the red lines are the supply of labour (higher wages increase the quantity of labour supplied). Market-clearing wages and employment are at the intersection of the labour demand and supply curves — where supply equals demand and there’s no excess supply or excess demand. Before the shock, wages and employment are at levels denoted by the 0 subscript.
The immediate effect of the increase in the demand for labour in the resources sector is to produce upward pressure on wages in the resource sector. Some people stop the story there and conclude that the only people who benefit from high commodity prices are those who work in the resource sector, but this is obviously an incomplete analysis. Manufacturing workers will notice the higher wages on offer in the resource sector and react by moving from manufacturing to resources:
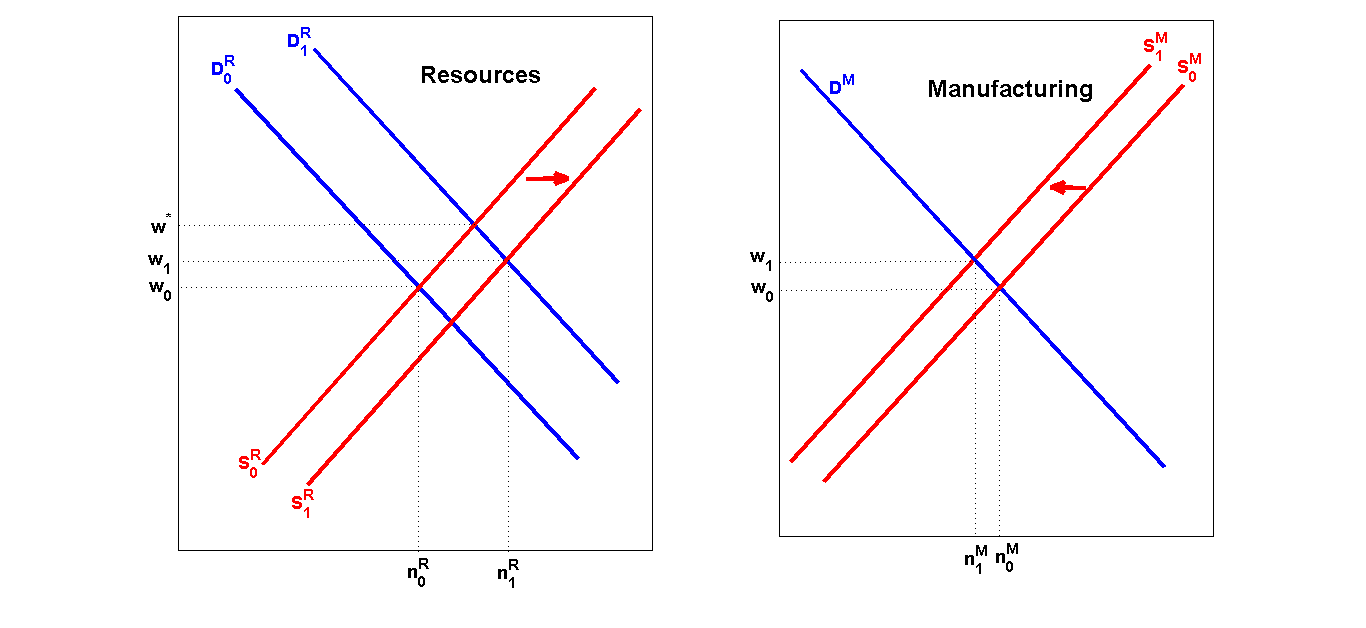 The arrival of new workers in the resource sector attenuates the wage increase there, and — this is the important bit — the departure of workers from the manufacturing sector increases manufacturing wages. The shift of workers from manufacturing to resources will continue so long as the resource sector offers higher wages. When wages are equalized across sectors — at w1 — there is no reason to move from one sector to the other. Note also that w1 is higher than w0: an increase in labour demand in one sector increases wages in both sectors.
Here are the main predictions of the sectoral shifts story:
- Employment in the manufacturing sector falls
- Employment outside the manufacturing sector increases
- Wages increase in both the non-manufacturing and manufacturing sectors
The first prediction obviously fits the data: according to the Labour Force Survey, manufacturing employment fell by 328,000 between 2002 and 2008. So does the second: even though manufacturing employment fell, unemployment rates hit record lows and employment rates hit record highs during Canada’s Dutch Disease period. And here’s what happened to real wages:
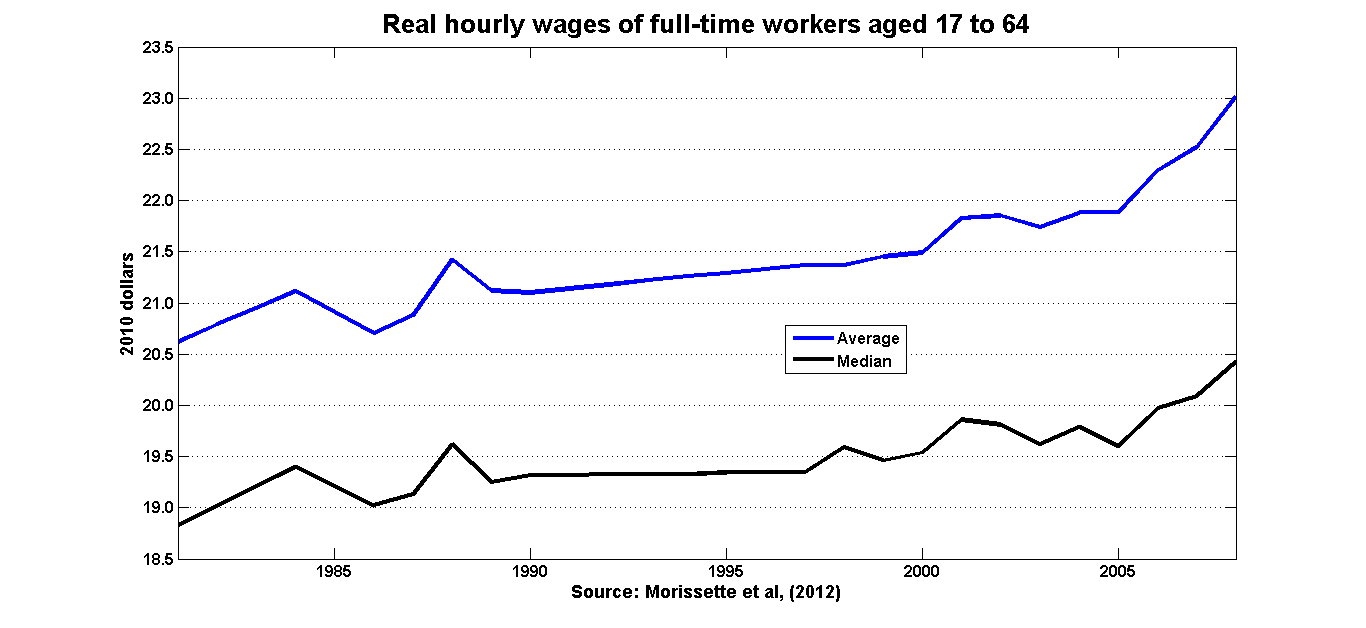
The Dutch Disease period was a time when real wage growth accelerated after decades of sluggish improvement: the increase in median real wages in the six years after 2002 was the same as the increase observed over the preceding 18 years. As far as consumer welfare goes, this is a much more important statistic than the number of manufacturing jobs lost over the period.
There is one curious thing though: manufacturing wages are generally higher than wages in other sectors. How can a decline in employment in a high-paying sector generate an increase in overall wages? The answer is that the manufacturing jobs that disappeared were generally low-paying. (The numbers in the tables are calculated from the Public Use Microdata Files of the Labour Force Survey.)
All jobs: 2002 Manufacturing jobs: 2002 Lost manufacturing jobs: 2002-2008 Mean hourly wage: $21.49 $22.39 $18.00 Median hourly wage: $19.05 $20.42 $16.50 Interquartile range: [$12.53 , $27.38] [$14.60 , $27.98] [$11.58 , $24.08] Hourly wages: 2012 dollars
(The interquartile range spans the middle 50 per cent of the distribution: its lower bound is the 25th percentile and its upper bound is the 75th percentile.)
The lost jobs were not only relatively low-paying compared to the rest of the manufacturing sector, they were low-paying relative to the economy as a whole. Again, this is consistent with a sectoral shifts story in which workers leave the manufacturing sector in search of higher wages elsewhere.
The next question is whether or not the new jobs created in the non-manufacturing sector did in fact pay better than the manufacturing jobs that were lost. For the most part, they did:
Manufacturing Non-manufacturing Total Lowest quartile (under $12.53/hr) -142.5 -140.8 -283.3 Second quartile ($12.53/hr - $19.05/hr) -80.3 550.0 469.8 Third quartile ($19.05/hr - $27.38/hr) -49.0 740.1 691.1 Highest quartile ($27.38/hr and up) -56.5 968.4 911.9 Total -328.3 2117.8 1789.5 Net change in employment: 2002-2008 (Thousands)
The lost manufacturing jobs are mainly concentrated in the bottom part of the wage distribution, and the new non-manufacturing jobs are mainly concentrated in the top part of the distribution. This doesn’t mean that no high-wage manufacturing worker ended up at a low-wage non-manufacturing job, but it does mean that those transitions were not representative of what was going on during the shift out of manufacturing.
There’s another point to consider that I cover in my presentation: the mechanics of the transition. I may get to this later, but for now suffice it to say that the reduction in manufacturing employment between 2002 and 2008 was brought about by attrition: layoff rates held steady while hiring rates fell.
So why does an income-boosting shift of workers from one industry to another get such a bad name? I blame the editors at The Economist. A phenomenon that increased consumers’ buying power by 10 per cent should never have been called a "disease."
Get the Best of Maclean’s straight to your inbox.
Sign up for news, commentary and analysis. Join 60,000+ Canadian readers.