Myth-busting ridings: Shedding light on women in federal politics
A new myth-busting study by Equal Voice, a national, multi-partisan organization dedicated to electing more women to all levels of political office in Canada, provides a fresh way of looking at female representation on the federal stage. In analyzing Canada’s 33 most ethnically diverse ridings, they found that, contrary to stereotypes that visible minority communities are less open to women leaders, representation of female visible minority candidates is far higher than that of the non-visible minority candidate pool. Part of the reason? Political parties cultivate visible minority women in these communities in a way we don’t see them do with so-called “old stock” Canadians, to employ the risible term used by Stephen Harper in a recent leaders’ debate. The Equal Voice study was undertaken to determine candidate diversity in diverse ridings, says its executive director Nancy Peckford. Researcher Grace Lore, a Ph.D. political science student at the University of British Columbia, crunched data on 33 ridings where more than 50 per cent of the population is visible minority as identified by Andrew Griffith in Multiculturalism in Canada: Evidence and Anecdote—23 ridings in Ontario, eight in B.C., one in Quebec and one in Alberta. Forty per cent of visible minority candidates were women; among candidates of the non-visible minority pool, women comprised just 21 per cent. These aren’t lame-duck contenders, says Lore: “Many of the visible minority women in those 33 ridings are absolutely in winnable ridings.” Parties are strategic in these ridings, says Peckford, many of which are battlegrounds in the current federal campaign: “Parties inherently understand that to be competitive they need to reflect the community back to them,” she says. “I think there is a lot of diligence to ensure they’re choosing candidates who have fairly comprehensive reach.” The effort seems to be encouraging women to come forward, she says: “It’s auspicious. We need more of it.” Asked why less diverse ridings don’t field women, Peckford is quick to answer: “I don’t think they have to try as hard,” she says. The study’s finding is consistent with research documenting that female visible minority MPs are better represented in Parliament than in the general population. A 2008 study, “Ethnoracial minorities in the 38th Parliament: Patterns of change and continuity,” by Jerome Black reveals that representation of minority women doubled between 1993 and 2004, from just 4 per cent to 8 per cent (though, as Lore points out: “that’s hardly a level to cheer about”). By 2004, minority women comprised 40 per cent of minority MPs. “Given that, in 2004, women overall comprised just 21 per cent of all MPs, that’s pretty incredible,” Lore says. Minority women have done better than minority men, she points out: “So the way we can phrase this is when we do more to get more women, we end up with more diverse candidates overall.”
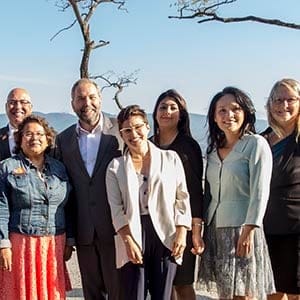
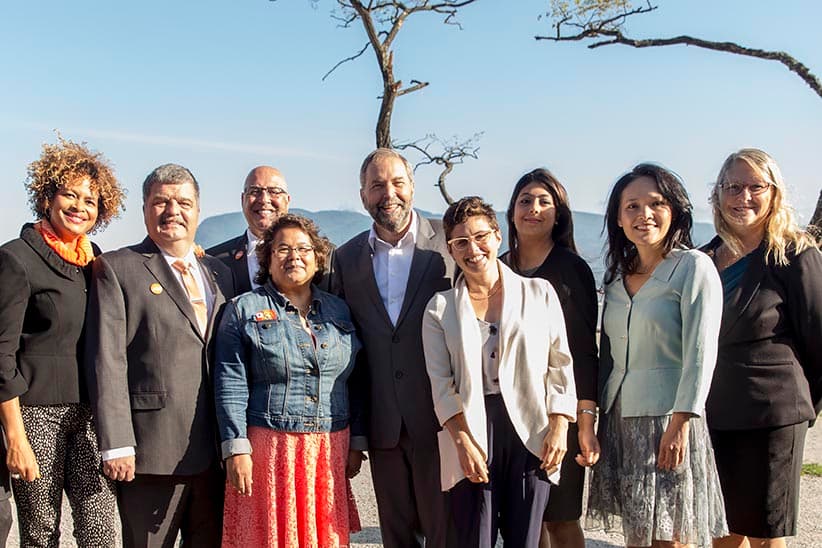
The study reflects broader national trends. And these can’t help but remind us that the history of electoral franchise in Canada is a barometer of institutionalized bigotry in this country. When we say Canadian women were given the vote in 1919—52 years after Confederation—we’re not talking all women. It wasn’t until 1948 that sections of the federal Elections Act that made race a basis for exclusion were repealed, and the right to vote was extended to Canadians of Asian origin. Even then, the vast majority of Indigenous men and women were not granted the franchise to vote until 1960. Despite that grievously unequal playing field, female representation within Indigenous candidates nationally stands at 55 per cent, according to the Indigenous Politics blog; Indigenous women comprise 2.2 per cent of all candidates running for the major five parties, a percentage consistent with their representation in the population. A similar trend is seen in the black community; of the 25 candidates running, 52 per cent are women. If the total number of such candidates is still quite small, the female percentage of both Indigenous and black candidates is still higher than that of all women candidates running for the major three parties (31.5 per cent.) Twenty per cent of Conservative candidates are women. It’s 31 per cent for the Liberals, and the NDP stand at 43 per cent, the latter being a historic high for any Canadian federal party. Even so, at the rate of progress seen in the last two elections (an increase of 1.5 per cent per election), it would take another 11 federal elections, some 45 years, to reach anything approaching gender balance on the ballot. So why the marked difference? Peckford posits that there’s increased motivation in certain minority communities to be part of the democratic process and governance institutions. “You wonder if it’s not taken for granted the way it may be in some communities that have been part of Canada’s evolution since earlier days,” she says. Her own interactions with prospective female candidates reveals a palpable desire to participate, she says: “They want to contribute and they see Canada’s democracy—their democracy—as a tangible way to do that.” Denise Siele, the founder of the Ottawa-based Black Women’s Civic Engagement Network, speaks of the appetite for more black female representation. The challenge is to make politics more attractive and encourage all women to see it as an avenue for change, she says. “In my sphere, black women are at the forefront of community organizations in leadership roles. And that seems the most important way to get things done.” Translating that leadership to the political stage was part of a discussion held by the Network of Black Business and Professional Women last week, says Siele, who was a panellist alongside Senator Anne Cools, the first black Canadian senator. “What was clear was the political process is not open in a way that can meet black women where they are at,” Siele says. “One woman running municipally said it was very lonely to be in that space. It’s the same on the Hill.” Yet black women are incredibly effective mobilizing other black women, she notes: “There’s a real need for mentors.” You also can’t speak only of black women, says Siele. “You need to include LGBTQ black women, Muslim women, to drill deeper.” Peckford agrees: “Hearing more women’s voices on the political stage is vital, but so is the diversity of those voices, she says. “No one woman can represent all women.” It’s a mission that takes on urgency in a federal campaign dominated by male voices arguing about a Canadian woman’s right to wear the niqab. As Peckford puts it: “Better to hear the voices of women than to talk about them.”
33 ridings with more than 50 per cent visible minority population:
33 ridings with more than 50 per cent visible minority population
| Riding name | Province | Visible minority population (%) |
|---|---|---|
| Scarborough North | Ontario | 90.1% |
| Brampton East | Ontario | 87.6% |
| Markham—Thornhill | Ontario | 82.0% |
| Vancouver South | B.C. | 79.2% |
| Scarborough—Agincourt | Ontario | 79.0% |
| Markham—Unionville | Ontario | 78.8% |
| Mississauga—Malton | Ontario | 75.2% |
| Etobicoke North | Ontario | 72.8% |
| Surrey—Newton | B.C. | 72.2% |
| York West | Ontario | 72.2% |
| Brampton West | Ontario | 71.2% |
| Vancouver Kingsway | B.C. | 71.1% |
| Steveston—Richmond East | B.C. | 70.5% |
| Richmond Centre | B.C. | 70.3% |
| Scarborough—Rouge Park | Ontario | 70.2% |
| Scarborough—Guildwood | Ontario | 68.1% |
| Don Valley North | Ontario | 67.1% |
| Mississauga Centre | Ontario | 67.0% |
| Scarborough Centre | Ontario | 64.4% |
| Burnaby South | B.C. | 63.4% |
| Fleetwood—Port Kells | B.C. | 62.3% |
| Brampton North | Ontario | 61.4% |
| Willowdale | Ontario | 60.3% |
| Surrey Centre | B.C. | 60.1% |
| Calgary Skyview | Alberta | 59.6% |
| Brampton South | Ontario | 59.5% |
| Mississauga—Erin Mills | Ontario | 59.5% |
| Don Valley East | Ontario | 55.9% |
| Richmond Hill | Ontario | 54.9% |
| York South—Weston | Ontario | 54.3% |
| Brampton Centre | Ontario | 53.7% |
| Scarborough Southwest | Ontario | 51.1% |
| Saint-Laurent | Quebec | 50.4% |
Related Posts

The federal budget is a mixed bag

New federal budget will include up to $8 billion in defence spending
Inflation rate surpasses a three decade high
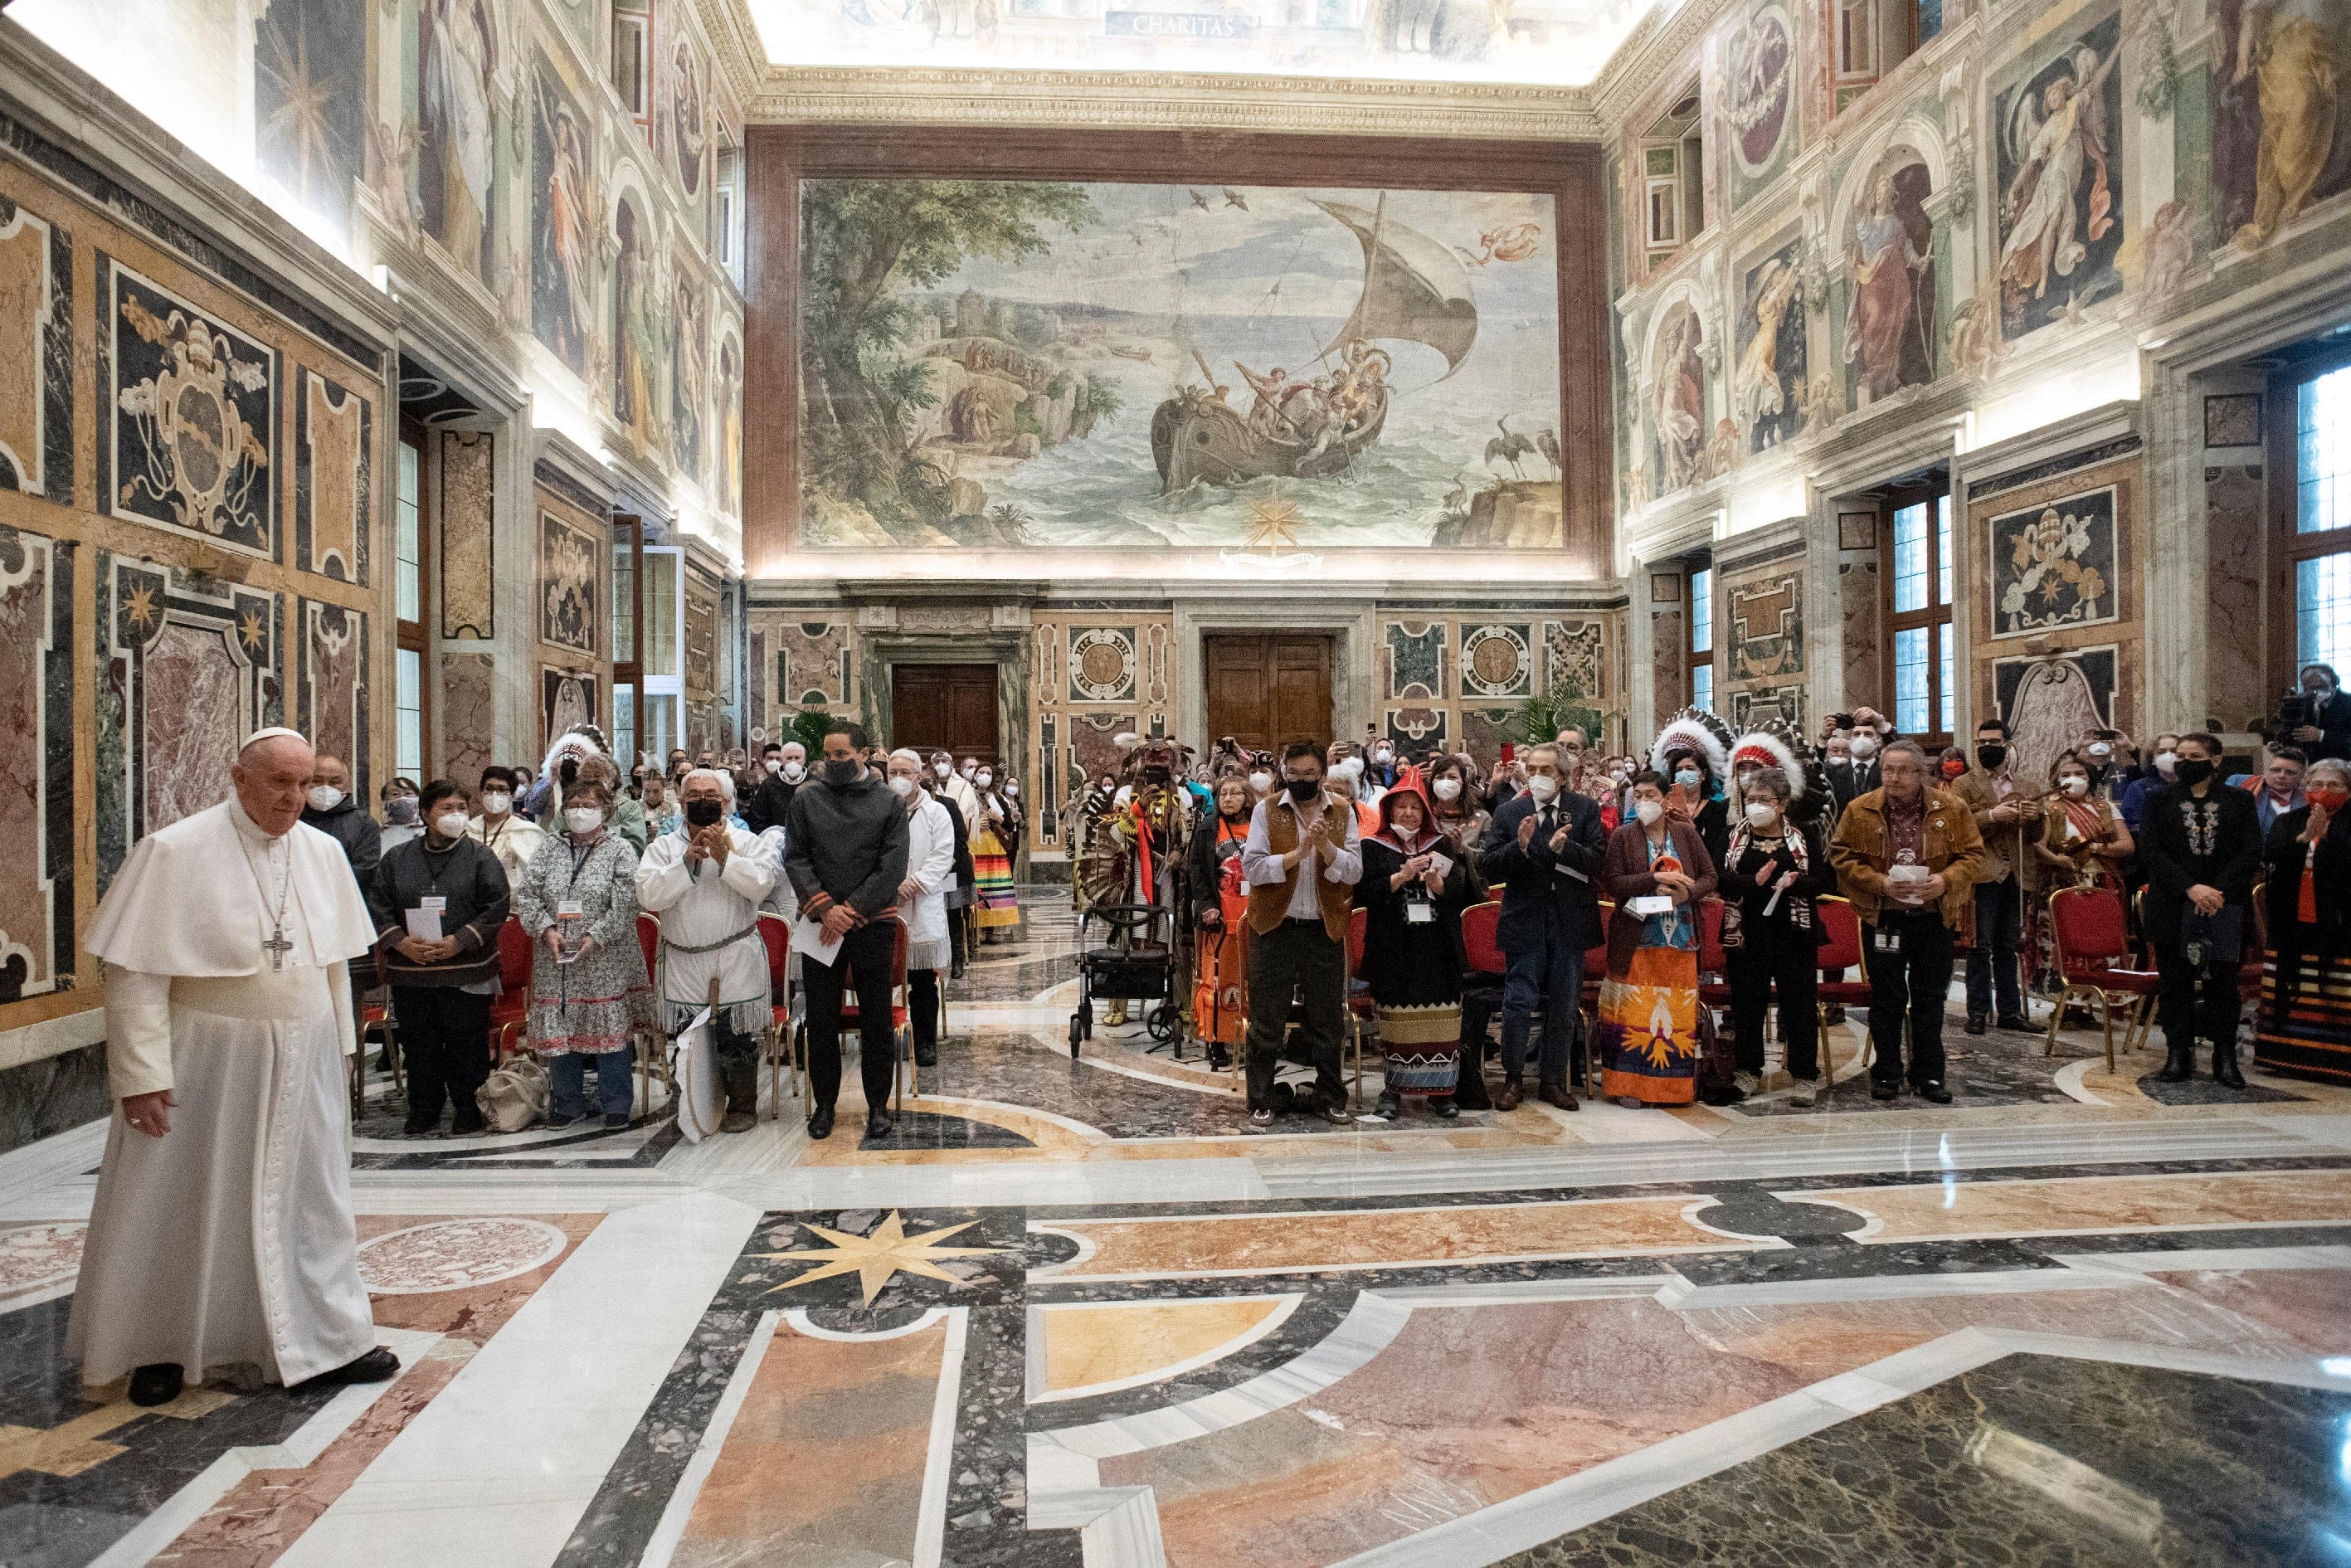
Pope Francis apologizes for residential school abuses
Get the Best of Maclean’s straight to your inbox.
Sign up for news, commentary and analysis. Join 60,000+ Canadian readers.