National Survey of Student Engagement: A truer measure of quality

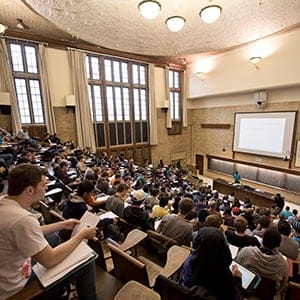
When measuring the quality of education, Alexander McCormick is hardly swayed by a university’s reputation, nor its entrance exam scores. “Neither of those really tells you anything about teaching and learning on the campus,” says the professor of educational leadership and policy studies at Indiana University Bloomington. Reputation is highly correlated with the wealth of an institution, while exam scores offer little indication of what happens after students are admitted. “What ends up standing in for quality are not terribly good measures of what actually goes on in a university.” As director of the National Survey of Student Engagement (NSSE), a North American survey offered annually since 2000, McCormick is most interested in improving higher education by asking current undergraduates about specific measures for levels of engagement on and off campus.
RELATED: Canadian University Survey Consortium: Surveying student satisfaction
With NSSE, approximately 100 questions are designed to evaluate best educational practices such as student-faculty interaction, collaborative learning and supportive campus environments, and give feedback to schools. How often have students attended an arts performance in the past year? How much of their course work emphasizes memorization? How often have they prepared two or more drafts of a paper before turning it in? How often do they ask another student for help with course material? How often have they had discussions with people of a different race? A different economic background? A different religious belief? If it all sounds extremely specific, that’s the goal. “We ask about activities and experiences that previous research has shown to be positively related to learning outcome,” McCormick says. The higher the score, the better the odds that undergrads are getting the most from university. When Quest University Canada was founded back in 2002 as a small, private, but non-profit liberal-arts school in Squamish, B.C., it was designed to provide many of the best practices found in this kind of survey. A sign of its success is that, in the five years it has participated in NSSE, Quest has come out at the top four times, and second once, when students rated their entire educational experience. Similarly, when students were asked if they would attend the same school all over again, Quest was in the upper echelon there, too. While receiving high praise from students is always good, Quest president David Helfand believes the two overall-satisfaction questions Maclean’s publishes are the least important from NSSE, which had 114,511 surveys returned from first- and fourth-year students across all participating Canadian campuses last year, a response rate of 36 per cent. “These are the only two questions in the survey that represent student opinion,” he says. “The most important are those that measure what the students actually do.” This year, 73 Canadian institutions took part in the survey, the largest number in its 15-year history. “We want to know that we’re actually having an impact on these students,” Helfand says, “that, when they come in, they’re in one state, and when they go out, they’re in a different state, presumably, better prepared for life.” The questions and answers on student engagement that Helfand refers to (six of which are published on Macleans.ca) are a measure of what Quest is accomplishing. NSSE itself aggregrates the results and does not identify institutions. “We don’t give anyone the information that allows them to say: ‘We’re the best,’ ” says McCormick. Schools get their own scores, which they can compare to averages in different groups, including the top 50 per cent and the top 10 per cent. (Maclean’s asks all participating schools for their data on two student-satisfaction questions and six of 10 student-engagement measures; this year, 66 of 73 consented. Because most schools do not do the survey every year, we use data from the previous year’s results to fill in the blanks.) Overall, compared to our American counterparts—622 U.S. institutions took part in last year’s NSSE—Canadian schools didn’t appear to perform as well, says McCormick. Another overarching trend was: The bigger the university, the lower it tended to perform on student-faculty interaction. Last, Maclean’s includes the results from two questions posed to middle-year students by the Canadian University Survey Consortium. Of 28 universities that took part last year, 22,537 students filled out the survey—a response rate of 30 per cent—answering questions about participation in activities and the perception of the quality of the educational experience. Robert Lapp, president of Canada’s Society for Teaching and Learning in Higher Education, says, “The differences within universities can be greater than between universities.” The point is to make use of “formative feedback.” In Lapp’s ideal scenario, university courses would be constructed collaboratively between a professor—the expert in content—and an educational developer, an expert in best teaching practices. “That would be utopia.”
Engagement indicator results from the 2014 National Survey of Student Engagement (NSSE)
NSSE created 10 engagement indicators organized across 4 major themes: academic challenge; learning with peers; experience with faculty; and campus environment. Each indicator reflects students’ responses to a set of questions relating to these themes. Results are organized to compare performance across all participating schools—American and Canadian. The following charts show results from the 2014 survey for six of the 10 NSSE engagement indicators. We have listed the universities in descending order of achievement, according to their senior-year scores. Scores are on a scale of 60.
Scroll down to view the charts sequentially, or view them individually via the links below:Higher-Order LearningQuantitative ReasoningCollaborative LearningStudent-Faculty InteractionEffective Teaching PracticesSupportive EnvironmentStudent questions:How would you evaluate your entire educational experience at this institution?If you could start over, would you go to the institution you are now attending?
Related Posts
Canada’s best university education programs: 2022 rankings
Canada’s best university engineering programs: 2022 rankings
Higher-Order Learning This engagement indicator assesses how often coursework emphasizes such skills as applying facts, analyzing ideas in depth, evaluating points of view, and forming new ideas from various pieces of information.
Higher-order learning
| First-year results | Senior-year results | |
|---|---|---|
| Quest | 50.6 | 52.2 |
| Trinity Western | 39.7 | 43.9 |
| Ambrose | 37.2 | 43.4 |
| Saint Paul (Ottawa) | 39.3 | 42.9 |
| St. Thomas | 37.4 | 42.6 |
| Huron (Western) | 38 | 42.2 |
| Mount Royal | 39.6 | 42.2 |
| Tyndale | 36.2 | 42.2 |
| Bishop's | 36.6 | 42 |
| Cape Breton | 35.3 | 41.5 |
| Kwantlen | 35.4 | 41.5 |
| Briercrest | 38.8 | 41.4 |
| MacEwan | 37.6 | 41.4 |
| Algoma | 35.2 | 40.8 |
| NSSE 2013 & 2014 average* | 38.5 | 40.8 |
| King's (Western) | 38.2 | 40.7 |
| Trent | 37.6 | 40.7 |
| King's (Edmonton) | 37.5 | 40.6 |
| Hearst (Laurentian) | 37.9 | 40.3 |
| UOIT | 37.3 | 40.2 |
| Thompson Rivers | 36.4 | 40.2 |
| Brock | 36.6 | 40 |
| Canadian University College | 37 | 40 |
| York | 37.7 | 39.9 |
| OCAD U | 38 | 39.8 |
| Redeemer | 34.2 | 39.6 |
| Mount Allison | 34.4 | 39.4 |
| Wilfrid Laurier | 37.3 | 39.4 |
| Carleton | 36.8 | 39.3 |
| Concordia (Edmonton) | 38.4 | 39.3 |
| UNBC | 34.9 | 39.3 |
| Queen's | 38.6 | 39.2 |
| Vancouver Island | 36.9 | 39.2 |
| Lethbridge | 33.4 | 38.9 |
| Laurentian | 35 | 38.5 |
| Nipissing | 37.4 | 38.5 |
| St. Francis Xavier | 35.8 | 38.5 |
| Saint Mary's | 34.2 | 38.5 |
| Sheridan | 38.4 | 38.5 |
| Acadia | 35.5 | 38.4 |
| Fraser Valley | 37.5 | 38.4 |
| Guelph | 37.1 | 38.4 |
| Brandon | 33.9 | 38.3 |
| Concordia | 36 | 38.2 |
| Athabasca | 36.1 | 38.1 |
| Toronto | 37.9 | 38 |
| Ryerson | 36.1 | 37.8 |
| McMaster | 37.9 | 37.7 |
| Western | 38.2 | 37.6 |
| Winnipeg | 33.9 | 37.4 |
| Sherbrooke | 32.2 | 37.3 |
| Brescia (Western) | 36.2 | 37.2 |
| Lakehead | 35.5 | 37.2 |
| UPEI | 34.9 | 37.1 |
| Calgary | 34.8 | 37 |
| Simon Fraser | 34.3 | 37 |
| Victoria | 34.1 | 36.9 |
| ACAD | 36.7 | 36.8 |
| Dalhousie | 36.1 | 36.8 |
| Saskatchewan | 34.1 | 36.8 |
| UBC (Vancouver) | 37.4 | 36.7 |
| Manitoba | 34.4 | 36.6 |
| Moncton | 34 | 36.5 |
| Alberta | 35.2 | 36.4 |
| Memorial | 34.3 | 36.3 |
| Regina | 34.7 | 36.1 |
| Trois-Rivières | 32.6 | 35.7 |
| Montréal | 33.7 | 35.6 |
| Ottawa | 33.7 | 35.6 |
| UQAM | 34.9 | 35.6 |
| Rimouski | 35.1 | 35.6 |
| Outaouais | 33.7 | 35.4 |
| UBC (Okanagan) | 34.6 | 35.3 |
| Laval | 33.9 | 35.3 |
| McGill | 33.4 | 35.2 |
| Waterloo | 36.4 | 34.8 |
* NSSE average is the average score for all Canadian and U.S. universities and colleges that participated in the 2013 and 2014 surveys.[Back to top]Quantitative Reasoning This engagement indicator assesses how often students use numerical information, such as numbers, graphs and statistics, to reach conclusions, examine real-word issues, and evaluate what others have concluded from numerical information.
Quantitative reasoning
| First-year results | Senior-year results | |
|---|---|---|
| Quest | 36.8 | 42.4 |
| Athabasca | 34.1 | 35.9 |
| Acadia | 23.7 | 31.6 |
| UOIT | 27.9 | 30.5 |
| Dalhousie | 27.6 | 30.2 |
| Kwantlen | 22.2 | 29.8 |
| Guelph | 26.7 | 29.7 |
| NSSE 2013 & 2014 average* | 26.7 | 29.5 |
| Saint Mary's | 24.5 | 29.2 |
| Algoma | 23.3 | 28.9 |
| Trent | 25.9 | 28.7 |
| Hearst (Laurentian) | 21.3 | 28.6 |
| Queen's | 28.5 | 28.6 |
| Waterloo | 27.1 | 28.3 |
| Western | 25.4 | 28.1 |
| UBC (Okanagan) | 23.5 | 27.9 |
| McMaster | 26.6 | 27.9 |
| Calgary | 26.4 | 27.8 |
| UNBC | 24.4 | 27.7 |
| Carleton | 24.4 | 27.6 |
| Huron (Western) | 23 | 27.6 |
| Cape Breton | 22.3 | 27.5 |
| Mount Allison | 20.3 | 27.5 |
| MacEwan | 21.2 | 27.4 |
| UBC (Vancouver) | 26.3 | 27.2 |
| Ryerson | 22.4 | 27.2 |
| Bishop's | 23.5 | 26.8 |
| Mount Royal | 26 | 26.8 |
| Saskatchewan | 22.3 | 26.8 |
| St. Francis Xavier | 24.2 | 26.7 |
| Concordia (Edmonton) | 22.5 | 26.6 |
| Brescia (Western) | 23.1 | 26.5 |
| Simon Fraser | 21.5 | 26.4 |
| Moncton | 24.7 | 26.2 |
| Wilfrid Laurier | 26.8 | 26.2 |
| Alberta | 26.4 | 26 |
| Canadian University College | 20 | 26 |
| Sherbrooke | 21.2 | 26 |
| Laurentian | 24.1 | 25.9 |
| Trinity Western | 23 | 25.9 |
| McGill | 23.3 | 25.7 |
| Lakehead | 22.7 | 25.6 |
| Manitoba | 21.5 | 25.6 |
| Ottawa | 22.9 | 25.6 |
| Thompson Rivers | 25 | 25.6 |
| Brock | 24.5 | 25.5 |
| Toronto | 24.8 | 25.5 |
| Saint Paul (Ottawa) | 17.6 | 25.1 |
| Fraser Valley | 20.9 | 25 |
| Memorial | 19.8 | 25 |
| Nipissing | 23.2 | 24.9 |
| King's (Edmonton) | 25 | 24.8 |
| Concordia | 22.9 | 24.7 |
| Lethbridge | 20.3 | 24.6 |
| Trois-Rivières | 20.3 | 24.5 |
| Victoria | 23.1 | 24.5 |
| York | 23.4 | 24.5 |
| Outaouais | 19.7 | 24.3 |
| UPEI | 22.7 | 24.2 |
| Vancouver Island | 20.2 | 24.2 |
| King's (Western) | 23.8 | 24.1 |
| Sheridan | 19.7 | 23.8 |
| Laval | 21.9 | 23.6 |
| UQAM | 21.3 | 23.2 |
| Rimouski | 22.7 | 23.1 |
| Montréal | 20.6 | 22.9 |
| Redeemer | 20.2 | 22.8 |
| Regina | 20.3 | 22.1 |
| Brandon | 18.7 | 21.7 |
| Ambrose | 17.9 | 21.5 |
| St. Thomas | 18.5 | 21.5 |
| Winnipeg | 18.2 | 19.5 |
| OCAD U | 15.9 | 19.1 |
| Tyndale | 16 | 18.6 |
| Briercrest | 14 | 16 |
| ACAD | 11.6 | 15.7 |
* NSSE average is the average score for all Canadian and U.S. universities and colleges that participated in the 2013 and 2014 surveys.[Back to top]Collaborative Learning This engagement indicator gauges how often students work with other students on course projects or to prepare for exams, as well as how often students explain course material to other students or ask other students for help.
Collaborative learning
| First-year results | Senior-year results | |
|---|---|---|
| Quest | 46.5 | 51.8 |
| Sherbrooke | 37.8 | 37.8 |
| Queen's | 37.9 | 37.6 |
| Moncton | 35.8 | 37.1 |
| UBC (Okanagan) | 33.5 | 36.4 |
| Kwantlen | 29.3 | 36.3 |
| Outaouais | 33.8 | 36.2 |
| Trinity Western | 31.9 | 36.2 |
| Canadian University College | 32 | 36 |
| UOIT | 33.5 | 36 |
| Bishop's | 33.5 | 35.8 |
| Brock | 33.1 | 35.7 |
| Nipissing | 33.5 | 35.5 |
| Thompson Rivers | 30.5 | 35.4 |
| Lakehead | 32 | 35.2 |
| UNBC | 32 | 34.9 |
| Trois-Rivières | 32.8 | 34.9 |
| Guelph | 36.3 | 34.7 |
| Acadia | 33.3 | 34.6 |
| McMaster | 34.3 | 34.5 |
| Ryerson | 33.9 | 34.5 |
| Sheridan | 35.5 | 34.5 |
| Calgary | 35.2 | 34.4 |
| Rimouski | 31.2 | 34.4 |
| Mount Royal | 33.2 | 34.3 |
| Laval | 34.8 | 33.9 |
| Algoma | 32.6 | 33.8 |
| Dalhousie | 34.1 | 33.6 |
| St. Francis Xavier | 34.5 | 33.6 |
| Waterloo | 35.7 | 33.5 |
| Montréal | 32.3 | 33.4 |
| Wilfrid Laurier | 35.5 | 33.2 |
| Briercrest | 34.4 | 33.1 |
| McGill | 32.4 | 33.1 |
| Western | 34.9 | 33.1 |
| Redeemer | 35.3 | 33 |
| Cape Breton | 30.4 | 32.9 |
| Fraser Valley | 29.9 | 32.9 |
| UPEI | 31.5 | 32.9 |
| Mount Allison | 33.7 | 32.8 |
| Brescia (Western) | 30.6 | 32.5 |
| UBC (Vancouver) | 34.3 | 32.5 |
| Trent | 31.9 | 32.5 |
| NSSE 2013 & 2014 average* | 32 | 32.4 |
| Vancouver Island | 31.4 | 32.3 |
| Carleton | 30.1 | 32.1 |
| UQAM | 32.3 | 31.8 |
| Laurentian | 30.7 | 31.6 |
| Lethbridge | 28.9 | 31.5 |
| Alberta | 31.5 | 31.4 |
| Simon Fraser | 31.8 | 31.2 |
| Ottawa | 31.3 | 31 |
| Brandon | 25.5 | 30.9 |
| Saint Mary's | 30.4 | 30.9 |
| Victoria | 32.9 | 30.9 |
| ACAD | 24.7 | 30.8 |
| Memorial | 28.8 | 30.8 |
| Concordia (Edmonton) | 30.6 | 30.7 |
| Saskatchewan | 29.1 | 30.7 |
| Winnipeg | 23.6 | 30.5 |
| King's (Edmonton) | 30.1 | 30.4 |
| Regina | 29.6 | 30.3 |
| Concordia | 29.2 | 29.9 |
| York | 29.1 | 29.9 |
| King's (Western) | 30.8 | 29.8 |
| OCAD U | 29.4 | 29.3 |
| Toronto | 30.5 | 29.2 |
| Ambrose | 32.6 | 28.9 |
| Huron (Western) | 28.1 | 28.9 |
| St. Thomas | 27.7 | 28.8 |
| Manitoba | 26.6 | 28.1 |
| MacEwan | 26.8 | 27.6 |
| Tyndale | 31.6 | 26.6 |
| Hearst (Laurentian) | 25.6 | 25.6 |
| Saint Paul (Ottawa) | 23.4 | 25 |
* NSSE average is the average score for all Canadian and U.S. universities and colleges that participated in the 2013 and 2014 surveys.[Back to top]Student-Faculty Interaction This engagement indicator assesses such things as how often students discuss topics with a faculty member outside class, work with faculty on activities other than coursework, or discuss their academic performance and career plans with faculty.
Student-faculty interaction
| First-year results | Senior-year results | |
|---|---|---|
| Quest | 27.9 | 37.7 |
| Ambrose | 17.3 | 29.5 |
| Canadian University College | 19 | 28 |
| Bishop's | 16.8 | 27.7 |
| Trinity Western | 16.8 | 27.7 |
| Cape Breton | 16.5 | 27.2 |
| King's (Edmonton) | 18.5 | 27.2 |
| Huron (Western) | 14.4 | 26.2 |
| Acadia | 15.5 | 26.1 |
| Mount Allison | 11.5 | 25.7 |
| Thompson Rivers | 16.2 | 25.4 |
| Brescia (Western) | 17.5 | 25.2 |
| ACAD | 16.9 | 25.1 |
| Algoma | 18.2 | 25.1 |
| Sheridan | 18.8 | 25 |
| St. Francis Xavier | 17 | 24.5 |
| Vancouver Island | 15.5 | 24.3 |
| Briercrest | 16.9 | 24.1 |
| St. Thomas | 14 | 24 |
| Kwantlen | 13.7 | 23.5 |
| Redeemer | 13.7 | 23.3 |
| NSSE 2013 & 2014 average* | 19 | 23.1 |
| Brandon | 13.9 | 23 |
| Hearst (Laurentian) | 16.6 | 22.9 |
| Trent | 13.8 | 22.8 |
| Mount Royal | 14.7 | 22.7 |
| Saint Mary's | 14 | 22 |
| MacEwan | 12.3 | 21.9 |
| Moncton | 15 | 21.9 |
| King's (Western) | 15.1 | 21.8 |
| UNBC | 11.9 | 21.8 |
| Brock | 14.1 | 21.5 |
| Laurentian | 13.8 | 21.3 |
| Saint Paul (Ottawa) | 11.1 | 21.3 |
| OCAD U | 14.2 | 21 |
| Nipissing | 14.2 | 20.9 |
| Tyndale | 16.6 | 20.9 |
| Queen's | 11.7 | 20.7 |
| Western | 15.8 | 20.6 |
| UPEI | 15.1 | 20.5 |
| Lethbridge | 12.4 | 20.1 |
| Fraser Valley | 14.1 | 20 |
| Wilfrid Laurier | 15.4 | 19.7 |
| Guelph | 11.2 | 19.6 |
| Dalhousie | 15.2 | 19.5 |
| UOIT | 14.7 | 19.5 |
| UBC (Okanagan) | 12.6 | 19.4 |
| Concordia (Edmonton) | 14.4 | 19.3 |
| Regina | 13.8 | 19.3 |
| Winnipeg | 10.9 | 19.1 |
| York | 13.2 | 18.9 |
| Carleton | 12.3 | 18.6 |
| McMaster | 14.1 | 18.6 |
| Saskatchewan | 11.1 | 18.2 |
| Manitoba | 12.5 | 18 |
| Memorial | 12.7 | 17.8 |
| Victoria | 11.5 | 17.8 |
| Alberta | 13.9 | 17.7 |
| Lakehead | 13.6 | 17.6 |
| Ryerson | 12.5 | 17.6 |
| Toronto | 13.7 | 17.5 |
| McGill | 11.5 | 17.4 |
| Calgary | 13.6 | 17.3 |
| Concordia | 12.6 | 17.1 |
| Waterloo | 15.7 | 16.7 |
| Simon Fraser | 11.5 | 16.6 |
| UBC (Vancouver) | 12.4 | 16.4 |
| Sherbrooke | 11.6 | 16 |
| Ottawa | 10.3 | 15.8 |
| Trois-Rivières | 8.5 | 15.6 |
| Rimouski | 10.2 | 15.5 |
| Outaouais | 8.8 | 12.8 |
| Laval | 7.9 | 12.6 |
| Montréal | 7.3 | 12.5 |
| UQAM | 8.5 | 12.5 |
* NSSE average is the average score for all Canadian and U.S. universities and colleges that participated in the 2013 and 2014 surveys.[Back to top]Effective Teaching Practices This engagement indicator assesses how well instructors teach in an organized way, clearly explain course requirements, use examples or illustrations to explain difficult points, and provide prompt and detailed feedback on tests and assignments.
Effective teaching practices
| First-year results | Senior-year results | |
|---|---|---|
| Quest | 49.4 | 51.5 |
| MacEwan | 38.6 | 44.2 |
| Cape Breton | 36 | 43.6 |
| Trinity Western | 40.6 | 43 |
| Ambrose | 39.4 | 42.9 |
| Briercrest | 45.1 | 42.8 |
| Concordia (Edmonton) | 40.7 | 42.8 |
| Huron (Western) | 37.8 | 42.7 |
| Bishop's | 40.3 | 42.1 |
| Mount Allison | 35.7 | 40.9 |
| Mount Royal | 39.8 | 40.7 |
| Nipissing | 38.4 | 40.6 |
| Hearst (Laurentian) | 39.3 | 40.5 |
| Acadia | 37 | 40.4 |
| St. Thomas | 38.7 | 40.3 |
| NSSE 2013 & 2014 average* | 39.3 | 40.3 |
| Canadian University College | 36 | 40 |
| Sheridan | 40.2 | 39.9 |
| Fraser Valley | 39.8 | 39.8 |
| Tyndale | 37.3 | 39.8 |
| Saint Mary's | 36.5 | 39.7 |
| King's (Western) | 38 | 39.6 |
| Algoma | 37.9 | 39.5 |
| St. Francis Xavier | 38.3 | 39.5 |
| Vancouver Island | 39.8 | 39.4 |
| King's (Edmonton) | 41.5 | 39.3 |
| Redeemer | 37.4 | 39.2 |
| Trent | 35.8 | 39.1 |
| Brandon | 37.3 | 39 |
| Brescia (Western) | 36.9 | 38.8 |
| Thompson Rivers | 39.2 | 38.7 |
| Saint Paul (Ottawa) | 40.7 | 38.6 |
| Carleton | 36.7 | 38.3 |
| Kwantlen | 36.8 | 38.1 |
| Concordia | 35.8 | 37.7 |
| Brock | 35.3 | 37.6 |
| Guelph | 34.9 | 37.6 |
| Lethbridge | 36.6 | 37.6 |
| Wilfrid Laurier | 36 | 37.5 |
| UNBC | 37.7 | 37.2 |
| Queen's | 33.8 | 36.7 |
| Alberta | 36.5 | 36.6 |
| UOIT | 35 | 36.6 |
| York | 34.4 | 36.6 |
| Memorial | 35.9 | 36.5 |
| UPEI | 36.1 | 36.5 |
| Regina | 36.1 | 36.5 |
| Moncton | 37 | 36.4 |
| Western | 35 | 36.4 |
| Winnipeg | 35.4 | 36.4 |
| Manitoba | 35.9 | 36.3 |
| Simon Fraser | 33.8 | 36.3 |
| McMaster | 34.2 | 36.2 |
| Rimouski | 38.1 | 35.9 |
| Saskatchewan | 34 | 35.9 |
| ACAD | 40 | 35.8 |
| UBC (Okanagan) | 34.7 | 35.8 |
| OCAD U | 35.2 | 35.8 |
| Trois-Rivières | 35.8 | 35.6 |
| Victoria | 34.6 | 35.5 |
| Toronto | 35.5 | 35.3 |
| Laurentian | 34.5 | 35.2 |
| UBC (Vancouver) | 34.2 | 34.9 |
| Dalhousie | 36.8 | 34.9 |
| Laval | 35 | 34.6 |
| Sherbrooke | 35.3 | 34.5 |
| Calgary | 33.9 | 34.3 |
| Waterloo | 35.1 | 34.2 |
| Ryerson | 34 | 34.1 |
| Lakehead | 34.5 | 34 |
| UQAM | 34.3 | 34 |
| Outaouais | 32.4 | 33.4 |
| McGill | 33.1 | 33 |
| Ottawa | 33.3 | 33 |
| Montréal | 33.4 | 31.9 |
| Athabasca | 29.5 | 29.2 |
* NSSE average is the average score for all Canadian and U.S. universities and colleges that participated in the 2013 and 2014 surveys.[Back to top]Supportive Environment This engagement indicator assesses how well universities provide support for academic and non-academic endeavours, ranging from tutoring services and writing centres to recreation, health care and counselling. This measure also examines social interaction, including contact with students from different background.
Supportive environment
| First-year results | Senior-year results | |
|---|---|---|
| Quest | 47.1 | 46.5 |
| Trois-Rivières | 42.3 | 45 |
| St. Francis Xavier | 44.4 | 43.9 |
| Trinity Western | 38.5 | 41.9 |
| Bishop's | 39.9 | 39.2 |
| King's (Edmonton) | 38.5 | 37.8 |
| Redeemer | 38.5 | 37.8 |
| Hearst (Laurentian) | 33.1 | 37.3 |
| Canadian University College | 37 | 36 |
| Ambrose | 34.2 | 35.8 |
| Huron (Western) | 35.6 | 35.8 |
| Tyndale | 38.2 | 35.8 |
| Acadia | 34.8 | 35 |
| Queen's | 38.4 | 34.7 |
| Mount Allison | 36.4 | 34.4 |
| Briercrest | 41.3 | 34.3 |
| Trent | 34.9 | 34.2 |
| Brescia (Western) | 35.2 | 33.9 |
| Concordia (Edmonton) | 33.5 | 33.7 |
| Guelph | 36.8 | 33.7 |
| St. Thomas | 33.9 | 33.2 |
| MacEwan | 31.1 | 32.9 |
| UNBC | 35.2 | 32.9 |
| NSSE 2013 & 2014 average* | 36.3 | 32.6 |
| Cape Breton | 29.1 | 32.3 |
| Saint Mary's | 31.3 | 32.3 |
| King's (Western) | 34.2 | 32.2 |
| Mount Royal | 33.6 | 31.9 |
| Western | 35.8 | 31.7 |
| Moncton | 34.1 | 30.7 |
| Sherbrooke | 31.9 | 30.7 |
| Wilfrid Laurier | 34.8 | 30.7 |
| Carleton | 33 | 30.3 |
| Concordia | 31.8 | 30.2 |
| Laval | 32.6 | 30.1 |
| Brock | 32.8 | 29.8 |
| Algoma | 29.6 | 29.4 |
| McMaster | 32.8 | 29.4 |
| Thompson Rivers | 30.9 | 29.4 |
| Brandon | 30.6 | 28.7 |
| UOIT | 32 | 28.5 |
| Ryerson | 31.4 | 28.3 |
| York | 31.5 | 28.3 |
| UBC (Vancouver) | 31.5 | 28 |
| Kwantlen | 29.2 | 28 |
| Nipissing | 34.5 | 28 |
| Alberta | 31.2 | 27.7 |
| ACAD | 32.8 | 27.7 |
| Vancouver Island | 30 | 27.7 |
| Lethbridge | 29.7 | 27.6 |
| Saskatchewan | 29.4 | 27.2 |
| UBC (Okanagan) | 29.9 | 27.1 |
| Dalhousie | 31 | 27 |
| Fraser Valley | 30.7 | 27 |
| Memorial | 30.6 | 27 |
| Regina | 29.6 | 26.9 |
| Saint Paul (Ottawa) | 29.7 | 26.8 |
| Rimouski | 31 | 26.7 |
| Lakehead | 29.1 | 26.5 |
| Victoria | 29.9 | 26.5 |
| Calgary | 30.5 | 26.4 |
| UQAM | 29.7 | 26.4 |
| Ottawa | 29.6 | 26.3 |
| Simon Fraser | 27.8 | 26.3 |
| Winnipeg | 26.8 | 26.3 |
| Toronto | 31.2 | 26.2 |
| Montréal | 29.4 | 26.1 |
| UPEI | 29.6 | 26.1 |
| Manitoba | 29.1 | 25.9 |
| Waterloo | 32 | 25.5 |
| McGill | 32 | 25.3 |
| Sheridan | 30.4 | 25.2 |
| Laurentian | 27.4 | 24.7 |
| Outaouais | 25.4 | 24.3 |
| OCAD U | 26.9 | 22.8 |
* NSSE average is the average score for all Canadian and U.S. universities and colleges that participated in the 2013 and 2014 surveys.[Back to top]
How satisfied are students?
NSSE asks students dozens of specific questions about how they spend their time in and out of the classroom. Below are two questions that are the broadest and most representative of the student experience. Responses are ordered according to the percentage who chose the highest level of satisfaction, e.g., "Excellent." How would you evaluate your entire educational experience at this institution?
How would you evaluate your entire educational experience at this institution?
| FIRST-YEAR STUDENTS | ||
|---|---|---|
| Excellent (%) | Good (%) | |
| Quest | 76 | 21 |
| Briercrest | 72 | 25 |
| Trinity Western | 68 | 25 |
| Bishop's | 54 | 37 |
| Redeemer | 52 | 41 |
| King's (Edmonton) | 49 | 43 |
| Queen's | 49 | 41 |
| Hearst (Laurentian) | 48 | 48 |
| Saint Paul (Ottawa) | 46 | 45 |
| Mount Royal | 43 | 48 |
| Rimouski | 42 | 47 |
| St. Francis Xavier | 42 | 46 |
| Ambrose | 41 | 50 |
| Guelph | 41 | 48 |
| Sherbrooke | 41 | 48 |
| Concordia (Edmonton) | 40 | 44 |
| Western | 40 | 46 |
| MacEwan | 39 | 50 |
| Tyndale | 39 | 41 |
| Acadia | 38 | 53 |
| Nipissing | 38 | 52 |
| Sheridan | 38 | 49 |
| Athabasca | 37 | 49 |
| McMaster | 37 | 45 |
| Brescia (Western) | 36 | 51 |
| NSSE 2013 & 2014 average* | 36 | 50 |
| King's (Western) | 35 | 51 |
| Waterloo | 35 | 48 |
| Huron (Western) | 34 | 51 |
| Laval | 34 | 55 |
| Mount Allison | 34 | 46 |
| Vancouver Island | 34 | 55 |
| Wilfrid Laurier | 33 | 52 |
| UNBC | 31 | 60 |
| Canadian University College | 30 | 58 |
| Dalhousie | 30 | 53 |
| Fraser Valley | 30 | 57 |
| St. Thomas | 30 | 62 |
| Trent | 30 | 53 |
| Trois-Rivières | 30 | 54 |
| ACAD | 29 | 50 |
| Brock | 28 | 55 |
| Carleton | 28 | 55 |
| Lethbridge | 28 | 57 |
| McGill | 28 | 52 |
| UBC (Vancouver) | 26 | 54 |
| UQAM | 25 | 61 |
| UOIT | 24 | 55 |
| Victoria | 24 | 62 |
| Algoma | 23 | 56 |
| Brandon | 23 | 55 |
| Memorial | 23 | 62 |
| UPEI | 23 | 57 |
| Toronto | 23 | 51 |
| Alberta | 22 | 56 |
| Concordia | 22 | 58 |
| OCAD U | 22 | 48 |
| Cape Breton | 21 | 56 |
| Montréal | 21 | 59 |
| Ottawa | 21 | 57 |
| Ryerson | 21 | 55 |
| Saint Mary's | 21 | 56 |
| Thompson Rivers | 21 | 63 |
| Winnipeg | 21 | 60 |
| UBC (Okanagan) | 20 | 63 |
| Lakehead | 20 | 56 |
| Laurentian | 20 | 54 |
| Moncton | 20 | 58 |
| Regina | 20 | 59 |
| Calgary | 19 | 57 |
| Kwantlen | 19 | 57 |
| Saskatchewan | 18 | 60 |
| York | 17 | 52 |
| Outaouais | 16 | 60 |
| Simon Fraser | 16 | 56 |
| Manitoba | 15 | 58 |
How would you evaluate your entire educational experience at this institution? Second-year students
| SENIOR-YEAR STUDENTS | ||
|---|---|---|
| Excellent (%) | Good (%) | |
| Quest | 82 | 14 |
| Trinity Western | 77 | 21 |
| Hearst (Laurentian) | 73 | 27 |
| King's (Edmonton) | 73 | 27 |
| Ambrose | 68 | 26 |
| Briercrest | 64 | 31 |
| Huron (Western) | 64 | 28 |
| Concordia (Edmonton) | 58 | 34 |
| MacEwan | 58 | 35 |
| Acadia | 57 | 35 |
| Mount Royal | 56 | 37 |
| Redeemer | 56 | 33 |
| Bishop's | 55 | 40 |
| Tyndale | 55 | 42 |
| Guelph | 51 | 41 |
| Queen's | 51 | 39 |
| Brescia (Western) | 49 | 39 |
| Sherbrooke | 49 | 43 |
| Cape Breton | 47 | 43 |
| St. Francis Xavier | 45 | 40 |
| King's (Western) | 42 | 51 |
| Mount Allison | 42 | 45 |
| Saint Paul (Ottawa) | 41 | 54 |
| St. Thomas | 41 | 45 |
| Western | 41 | 47 |
| NSSE 2013 & 2014 average* | 41 | 45 |
| UNBC | 40 | 44 |
| Trent | 39 | 50 |
| Lethbridge | 38 | 50 |
| McMaster | 38 | 48 |
| Nipissing | 38 | 48 |
| Fraser Valley | 37 | 53 |
| Vancouver Island | 37 | 53 |
| Saint Mary's | 36 | 50 |
| Wilfrid Laurier | 35 | 51 |
| Athabasca | 33 | 49 |
| Carleton | 33 | 50 |
| Brock | 31 | 54 |
| Rimouski | 31 | 48 |
| Winnipeg | 31 | 53 |
| Alberta | 30 | 49 |
| Kwantlen | 30 | 55 |
| Laval | 30 | 54 |
| Memorial | 30 | 52 |
| Victoria | 30 | 54 |
| Waterloo | 30 | 49 |
| Algoma | 29 | 54 |
| UBC (Vancouver) | 29 | 51 |
| McGill | 29 | 48 |
| UBC (Okanagan) | 28 | 54 |
| Canadian University College | 28 | 66 |
| Concordia | 28 | 53 |
| Dalhousie | 28 | 52 |
| Thompson Rivers | 28 | 53 |
| Trois-Rivières | 28 | 55 |
| UPEI | 26 | 56 |
| Toronto | 25 | 48 |
| Brandon | 24 | 53 |
| UOIT | 24 | 50 |
| UQAM | 23 | 58 |
| ACAD | 21 | 58 |
| Laurentian | 21 | 53 |
| Regina | 21 | 56 |
| Ryerson | 21 | 54 |
| Simon Fraser | 21 | 56 |
| York | 21 | 53 |
| Montréal | 20 | 56 |
| OCAD U | 20 | 50 |
| Lakehead | 19 | 50 |
| Saskatchewan | 19 | 59 |
| Ottawa | 17 | 57 |
| Outaouais | 17 | 57 |
| Calgary | 16 | 57 |
| Manitoba | 16 | 61 |
| Moncton | 16 | 58 |
| Sheridan | 15 | 60 |
[Back to top]If you could start over, would you go to the institution you are now attending?
If you could start over, would you go to the institution you are now attending?
| FIRST-YEAR STUDENTS | ||
|---|---|---|
| Definitely Yes (%) | Probably Yes (%) | |
| Quest | 76 | 18 |
| Briercrest | 73 | 25 |
| Rimouski | 68 | 27 |
| Saint Paul (Ottawa) | 66 | 30 |
| Sherbrooke | 66 | 27 |
| Bishop's | 61 | 33 |
| Laval | 61 | 32 |
| Queen's | 60 | 32 |
| Redeemer | 60 | 35 |
| Trinity Western | 60 | 35 |
| Ambrose | 59 | 28 |
| UQAM | 57 | 35 |
| Acadia | 55 | 36 |
| Tyndale | 54 | 28 |
| Guelph | 53 | 36 |
| Mount Royal | 52 | 40 |
| Trois-Rivières | 52 | 39 |
| Nipissing | 51 | 40 |
| St. Francis Xavier | 51 | 36 |
| Sheridan | 51 | 38 |
| Western | 51 | 39 |
| Hearst (Laurentian) | 50 | 46 |
| UNBC | 50 | 42 |
| Athabasca | 49 | 41 |
| Concordia (Edmonton) | 49 | 42 |
| MacEwan | 49 | 41 |
| Brescia (Western) | 46 | 42 |
| Montréal | 46 | 41 |
| Outaouais | 46 | 39 |
| Canadian University College | 45 | 49 |
| King's (Edmonton) | 45 | 46 |
| McMaster | 45 | 44 |
| Mount Allison | 45 | 39 |
| McGill | 44 | 44 |
| Huron (Western) | 43 | 34 |
| Waterloo | 43 | 45 |
| NSSE 2013 & 2014 average* | 43 | 42 |
| UBC (Vancouver) | 42 | 46 |
| Winnipeg | 42 | 47 |
| Brock | 41 | 45 |
| Trent | 41 | 42 |
| Wilfrid Laurier | 41 | 45 |
| Dalhousie | 40 | 45 |
| King's (Western) | 40 | 45 |
| St. Thomas | 40 | 51 |
| Vancouver Island | 40 | 48 |
| Fraser Valley | 39 | 50 |
| Brandon | 38 | 48 |
| Carleton | 38 | 48 |
| Concordia | 38 | 47 |
| Memorial | 38 | 51 |
| ACAD | 37 | 45 |
| Alberta | 36 | 48 |
| Lethbridge | 36 | 51 |
| UOIT | 36 | 46 |
| Victoria | 36 | 50 |
| Laurentian | 35 | 46 |
| Moncton | 35 | 49 |
| OCAD U | 35 | 50 |
| Toronto | 35 | 45 |
| UPEI | 34 | 47 |
| Regina | 34 | 50 |
| Ryerson | 34 | 49 |
| Algoma | 33 | 47 |
| Saskatchewan | 33 | 53 |
| Lakehead | 32 | 47 |
| Ottawa | 31 | 51 |
| Saint Mary's | 31 | 48 |
| Cape Breton | 30 | 48 |
| Manitoba | 29 | 56 |
| York | 29 | 47 |
| Calgary | 28 | 55 |
| UBC (Okanagan) | 27 | 54 |
| Kwantlen | 27 | 51 |
| Simon Fraser | 26 | 54 |
| Thompson Rivers | 26 | 59 |
If you could start over, would you go to the institution you are now attending? Second-year students
| SENIOR-YEAR STUDENTS | ||
|---|---|---|
| Definitely Yes (%) | Probably Yes (%) | |
| King's (Edmonton) | 79 | 21 |
| Hearst (Laurentian) | 73 | 20 |
| Trinity Western | 73 | 19 |
| Sherbrooke | 72 | 22 |
| Quest | 71 | 22 |
| Briercrest | 69 | 25 |
| Huron (Western) | 65 | 25 |
| Bishop's | 63 | 29 |
| Concordia (Edmonton) | 59 | 33 |
| MacEwan | 59 | 35 |
| Mount Royal | 59 | 32 |
| Tyndale | 59 | 39 |
| Ambrose | 58 | 32 |
| Guelph | 57 | 33 |
| Rimouski | 57 | 29 |
| Queen's | 56 | 31 |
| Saint Paul (Ottawa) | 56 | 37 |
| Acadia | 55 | 34 |
| Brescia (Western) | 54 | 36 |
| Laval | 53 | 36 |
| Trois-Rivières | 51 | 36 |
| Cape Breton | 49 | 41 |
| Redeemer | 48 | 36 |
| Canadian University College | 47 | 41 |
| UNBC | 47 | 38 |
| King's (Western) | 46 | 42 |
| St. Francis Xavier | 46 | 31 |
| Western | 45 | 38 |
| Fraser Valley | 44 | 43 |
| UQAM | 44 | 42 |
| Trent | 44 | 41 |
| NSSE 2013 & 2014 average* | 44 | 38 |
| McMaster | 43 | 41 |
| Memorial | 42 | 42 |
| Montréal | 41 | 40 |
| Vancouver Island | 41 | 46 |
| St. Thomas | 40 | 40 |
| Winnipeg | 40 | 45 |
| Lethbridge | 39 | 46 |
| Mount Allison | 39 | 44 |
| Nipissing | 39 | 42 |
| Wilfrid Laurier | 39 | 42 |
| Athabasca | 38 | 45 |
| Brock | 38 | 44 |
| McGill | 38 | 43 |
| Saint Mary's | 38 | 41 |
| Concordia | 37 | 46 |
| UBC (Vancouver) | 36 | 49 |
| Carleton | 36 | 44 |
| Outaouais | 35 | 46 |
| Victoria | 34 | 47 |
| Waterloo | 34 | 44 |
| Alberta | 33 | 46 |
| Kwantlen | 33 | 46 |
| Sheridan | 33 | 49 |
| Dalhousie | 31 | 48 |
| Moncton | 31 | 47 |
| Toronto | 30 | 42 |
| Algoma | 29 | 48 |
| UPEI | 29 | 49 |
| Saskatchewan | 29 | 50 |
| Brandon | 28 | 45 |
| UBC (Okanagan) | 28 | 48 |
| OCAD U | 28 | 45 |
| Ryerson | 28 | 46 |
| Thompson Rivers | 28 | 50 |
| Laurentian | 27 | 49 |
| UOIT | 26 | 41 |
| York | 25 | 44 |
| Ottawa | 24 | 46 |
| Regina | 24 | 50 |
| Simon Fraser | 24 | 50 |
| ACAD | 23 | 43 |
| Lakehead | 23 | 46 |
| Manitoba | 23 | 55 |
| Calgary | 20 | 51 |
Aaron Hutchins is an award-attending journalist who writes about business, politics and public policy.
Related Posts

How these four pillars are transforming the student life experience at Bishop’s University
A day in the life of a Thompson Rivers University student
Canada’s best university nursing programs: 2022 rankings

These students are reaping the high value of a ULethbridge education
Subscribe to Message Board, our weekly newsletter guide to planning your post-secondary journey
Whether you’re a student, parent or guidance counsellor, Message Board is a resource you won’t want to miss out on.