The Maclean’s-Pollara Ontario poll: Only the NDP is gaining support
Paul Wells: Andrea Horwath’s New Democrats and Doug Ford’s PCs are in a dead heat now with voter perception of the leaders starting to settle

Provincial NDP Leader Andrea Horwath gives supporters a thumbs up before the start of an NDP rally in Brampton, Monday, May 21, 2018. (THE CANADIAN PRESS/Galit Rodan)
Share
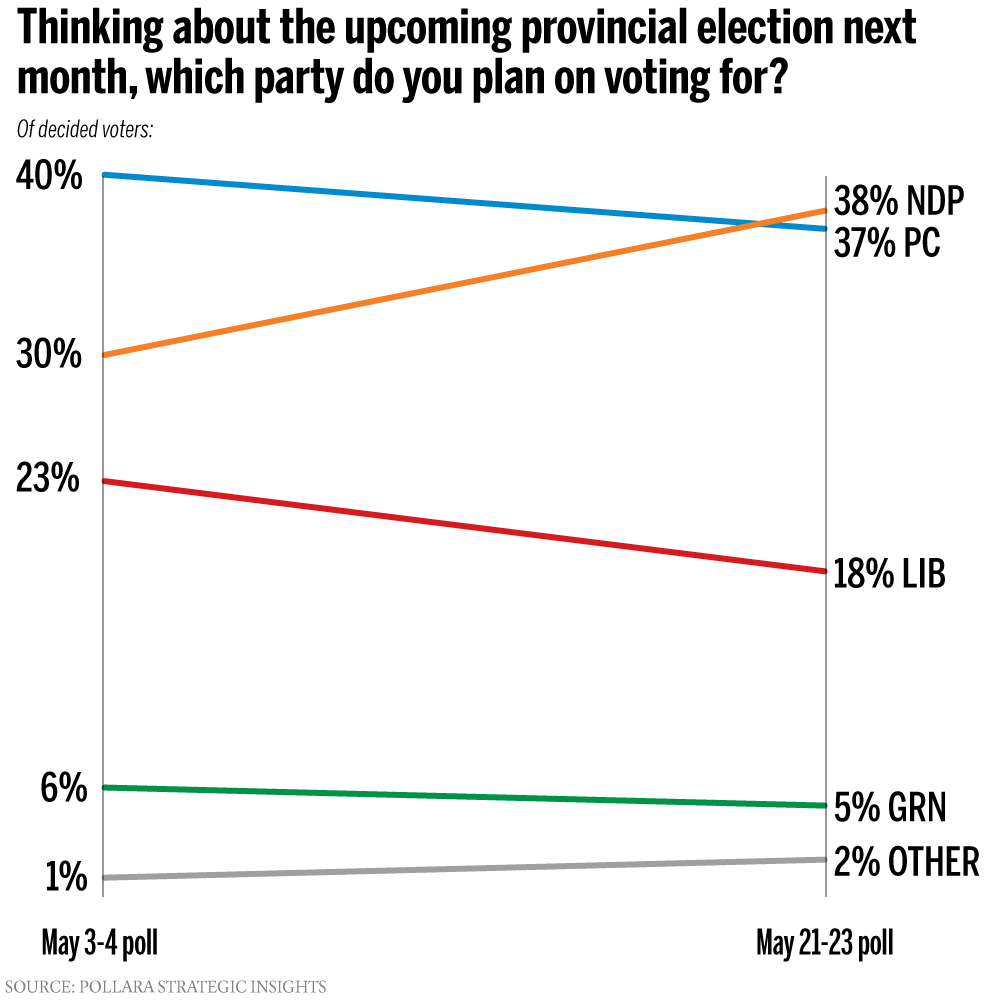
Support for the Ontario Liberal Party is collapsing, leaving Andrea Horwath’s surging New Democrats in a statistical tie with Doug Ford’s Progressive Conservatives for first place in Ontario’s provincial election, according to a new poll.
The online poll of 870 eligible voters, conducted on Monday and Tuesday for Maclean’s by Pollara Strategic Insights, shows that only the NDP has gained since a previous poll conducted May 3-4 by the same firm. Horwath’s party now has 38 per cent of the decided vote, up 8 points. That leaves it essentially tied with the Conservatives, who now stand at 37 per cent—down 3 points since early May.
Kathleen Wynne and the Liberals are in danger of a historic setback. They now command only 18 per cent of the decided vote, down 5 points. The party’s lowest share of the popular vote was in the 1923 election, when it won 21.8 per cent under a former Listowel mayor named Wellington Hay. Wynne is now on track to beat that low score.
This latest poll arrives as leaders prepare for a major election event, Sunday’s televised leaders’ debate, which could give any of the parties a chance to shake up voters’ perception. But the Maclean’s-Pollara poll suggests voter perception of the leaders is starting to settle, which makes such a shakeup less and less likely.
Positive perceptions of Horwath are up 2 points, with 48 per cent now reporting a positive impression of the NDP leader. But negative perceptions are also up 2 points, to 19 per cent. Ford’s positives are down four points to 32 per cent; his negatives are up a point to 49 per cent. Wynne’s positives are unchanged at 21 per cent, while her impressive negative score is down a point, to 63 per cent.
READ MORE: Just how far can Andrea Horwath go?
The Conservatives lead among people who say they are paying a lot of attention to the campaign, 43 per cent to 34 per cent for the NDP and 19 per cent for the Liberals. People who aren’t paying much attention strongly support the NDP, 51 per cent to 26 per cent for the Conservatives and 12 per cent for the Liberals.
But if core perceptions of the leaders haven’t much changed, respondents’ calculations about what to do with their vote have changed considerably. The NDP’s regional hand has grown stronger: the party has maintained its lead in Hamilton-Niagara, opened what was a deadlock with the PCs in Northern Ontario into a 17-point lead, and taken the lead from the Conservatives in Southwestern Ontario and Peel-Halton.
Among male voters, the NDP has narrowed the Conservatives’ advantage from 20 points to 7: male voters now break 41 per cent PC, 34 per cent NDP and 18 per cent Liberal. Among women, the NDP has gone from a tie to an 11-point advantage, 43 per cent NDP, 32 per cent PC, 19 per cent Liberal.
A note on methodology:
Pollara conducted a 10-minute online survey of 870 Ontarians who self-identified as eligible to vote in the Ontario Elections from May 21 to 22, 2018. Because the sample is based on those who initially self-selected for participation in the panel rather than a probability sample, no estimates of sampling error can be calculated. All sample surveys and polls may be subject to multiple sources of error, including, but not limited to sampling error, coverage error, and measurement error. A probability sample of equivalent size would have a margin of error of ± 3.3 per cent.
The data are statistically weighted to ensure the regional composition province wide and within region to ensure age and gender composition reflects that of the Ontario adult eligible population using information from the 2016 Census and accounting for older Ontarians’ increased propensity to vote based on an analysis of Ontario’s election performance relative to federal elections. Based on our analysis, the composition of the electorate over the age of 55 would range between 43 and 48 per cent.
In this report, results are expressed as percentages unless otherwise noted. Results may not add to 100 per cent due to rounding or multiple responses. Net results cited in the text may not exactly match individual results shown in the charts due to rounding.
