How we ranked Canada’s most dangerous places
The national crime rate has crept up, and some communities have a much bigger problem than others

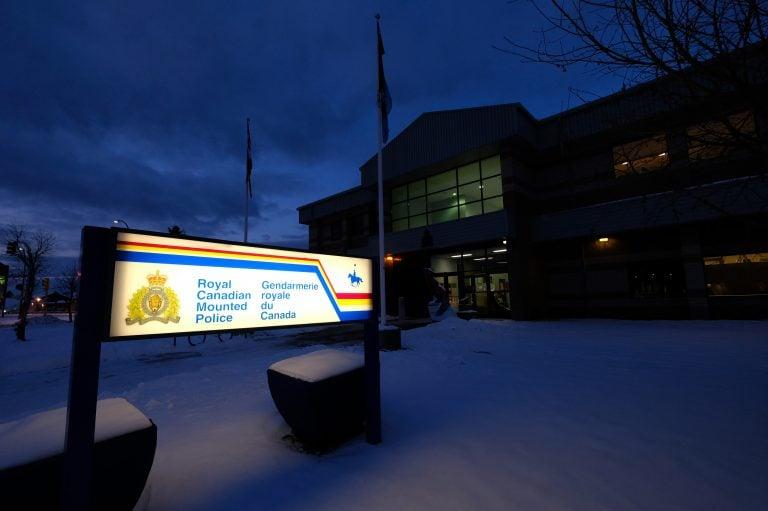
Thompson’s Royal Canadian Mounted Police detachment. Statistics Canada’s crime severity index positions Thompson, Manitoba, as Canada’s most violent city. (Photograph by Shannon VanRaes)
Share
It’s bad news for municipalities that have previously found themselves labelled Canada’s most dangerous places. Amid a two per cent increase in crime reported across the country, our latest ranking of Canada’s hottest crime spots shows many of the same communities struggling to reduce their crime rates year over year.
Maclean’s compiles an annual, interactive ranking that uses Statistics Canada data to reveal where incidents of serious crime per capita are most frequent, and whether things are getting better or worse over time. We use StatsCan’s crime severity index—a number different from the general crime rate that measures both the volume and severity of crimes in a municipality as compared to the national average—to compare 237 urban centres that have a population of 10,000 or more.
With the national index currently set at 75, a higher number than that in our ranking means a place sees a higher rate and severity of crime than average; a lower number means it sees a lower rate and severity. The national index is considerably lower than it was when the CSI was created in 2006. But it has risen steadily over the past four years. According to Statistics Canada, the most recent increase comes predominantly from a rise in reports of fraud, level 1 sexual assault (meaning without a weapon or evidence of bodily harm) and theft.
READ: Canada’s worst violent crime problem is in Thompson, Man.
Four out of five communities listed as the most criminally active last year, relative to their population size, have worse CSI scores this year, and all of them have gotten worse over the past five years. North Battleford, Sask., a city of 14,387 an hour-and-a-half northwest of Saskatoon, remains in first place. Its number rose from 372 to 385. Thompson, Man., remains in second place with a CSI of 366 this year (333 last year).
Quesnel, B.C. has the dubious honour of jumping from eighth to third place for overall crime; from 15th to fifth place for violent crime; and from 114th place to second place for the largest five-year change in its CSI. Quesnel’s CSI rose from 180 in 2013 to 292 in 2018.
Wetaskiwin, Alta., where the crime rate continues to increase the fastest, dropped to fourth place this year in terms of overall crime with a CSI of 270 (258 last year). Portage la Prairie, Man. is still in fifth; Prince Albert, Sask. and its surrounding area dropped to sixth from fourth.
For the fourth year in a row, the highest rates of violent crime, specifically, happened in Thompson, a city of 14,535 in northern Manitoba and the largest in the region. It had the highest rates of homicide, assault, sexual assault, cocaine trafficking and youth crime. We sent reporter Shannon VanRaes to investigate the story behind those trends (read her feature article here).
Rates of crime continue to be higher in parts of western Canada. Of the top 50 locations where overall crime was highest, 39 were in the Prairies or B.C. Of the top 50 locations for violent crime, 31 out of 50 were west of Ontario. Organizing the list by the type of crime committed, the only place east of Manitoba that was worst on a particular offence was St. Catharines and the Niagara region in Ontario, which had the highest rate of cannabis trafficking in 2018, before weed was legalized.
Three out of the five places that had the fastest-improving crime rates over the past five years were in B.C. The prize goes to Whistler, and second place to New Westminster. Saint-Jérôme, Que., had the third-fastest-improving crime rate, followed by Squamish and area, B.C., and Charlottetown, P.E.I.
LaSalle, Ont., next to Windsor, had the least crime per capita, according to the most recent stats available. Thames Centre, Ont., next to London, had the least violent crime.
Data source/methodology: Maclean’s compiles its ranking using Statistics Canada’s Uniform Crime Reporting Survey, which tracks all police-reported crime. We used the most recent data available, which covers the year 2018 and was released July 22, 2019.
The crime data we compare stem from police services that StatsCan categorizes as municipal, covering populations of at least 10,000 people. Some police coverage areas overlap. Where police forces cover multiple municipalities or regions, we added “and area” to the name of the primary municipality in the ranking tool.
To compile statistics for crimes of assault and sexual assault, we included reports of level 1 assault and level 1 sexual assault, the least serious levels.
To rank places with the fastest-growing and shrinking crime rates, we calculated the difference between their CSIs in 2013 and 2018.