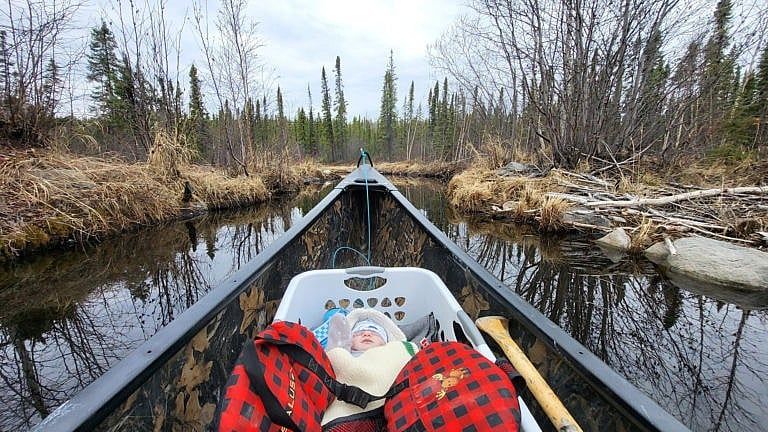
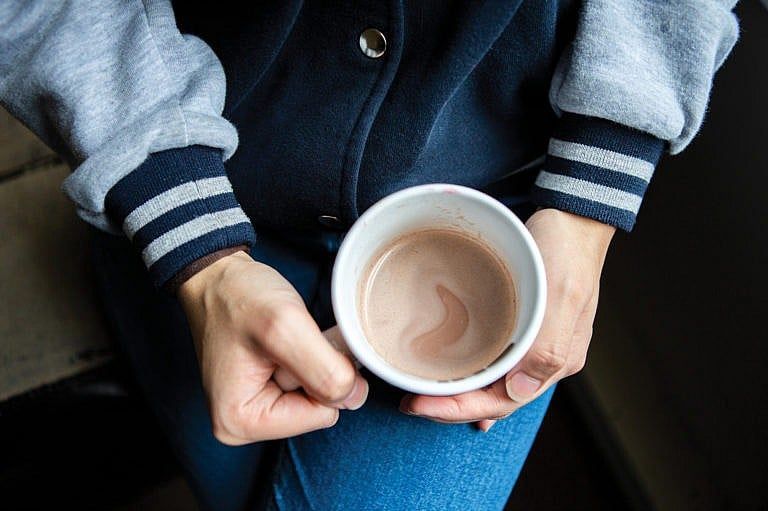
Why I Chose Not to Have Kids
Jenna Ross wasn’t sure she wanted to become a parent. The climate crisis clinched her decision.
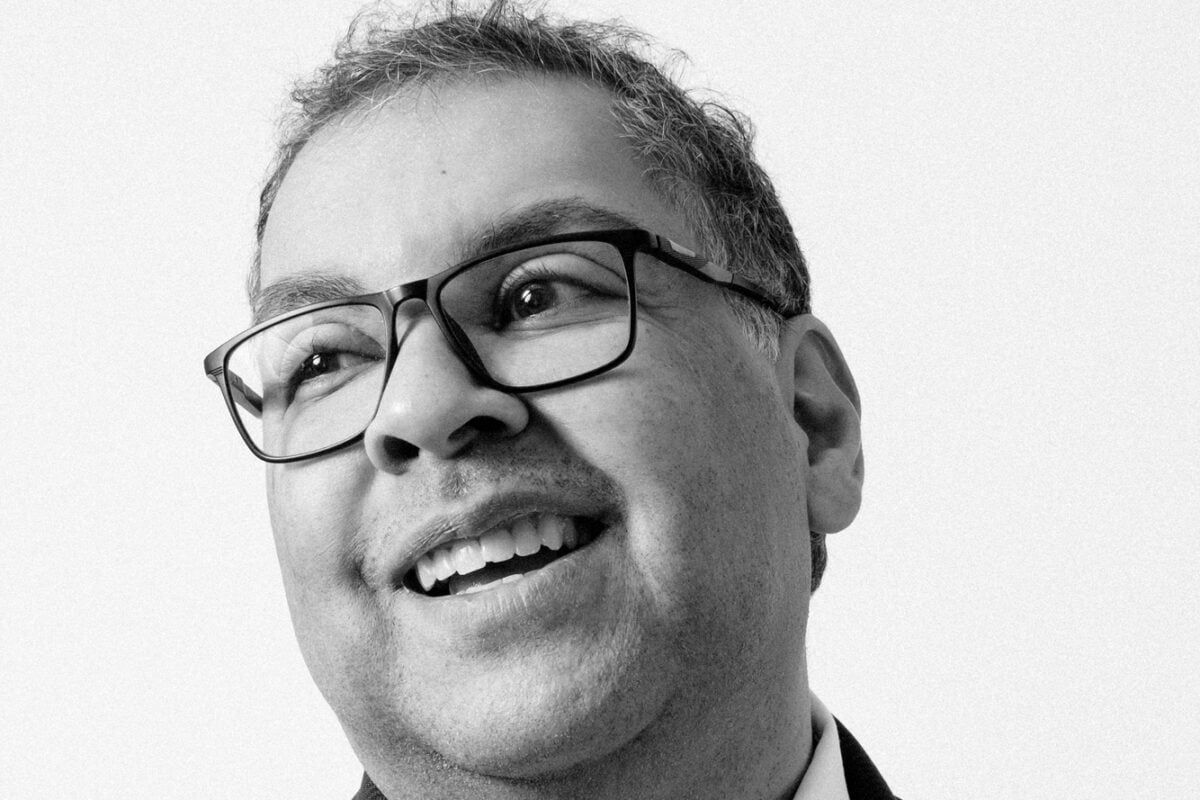
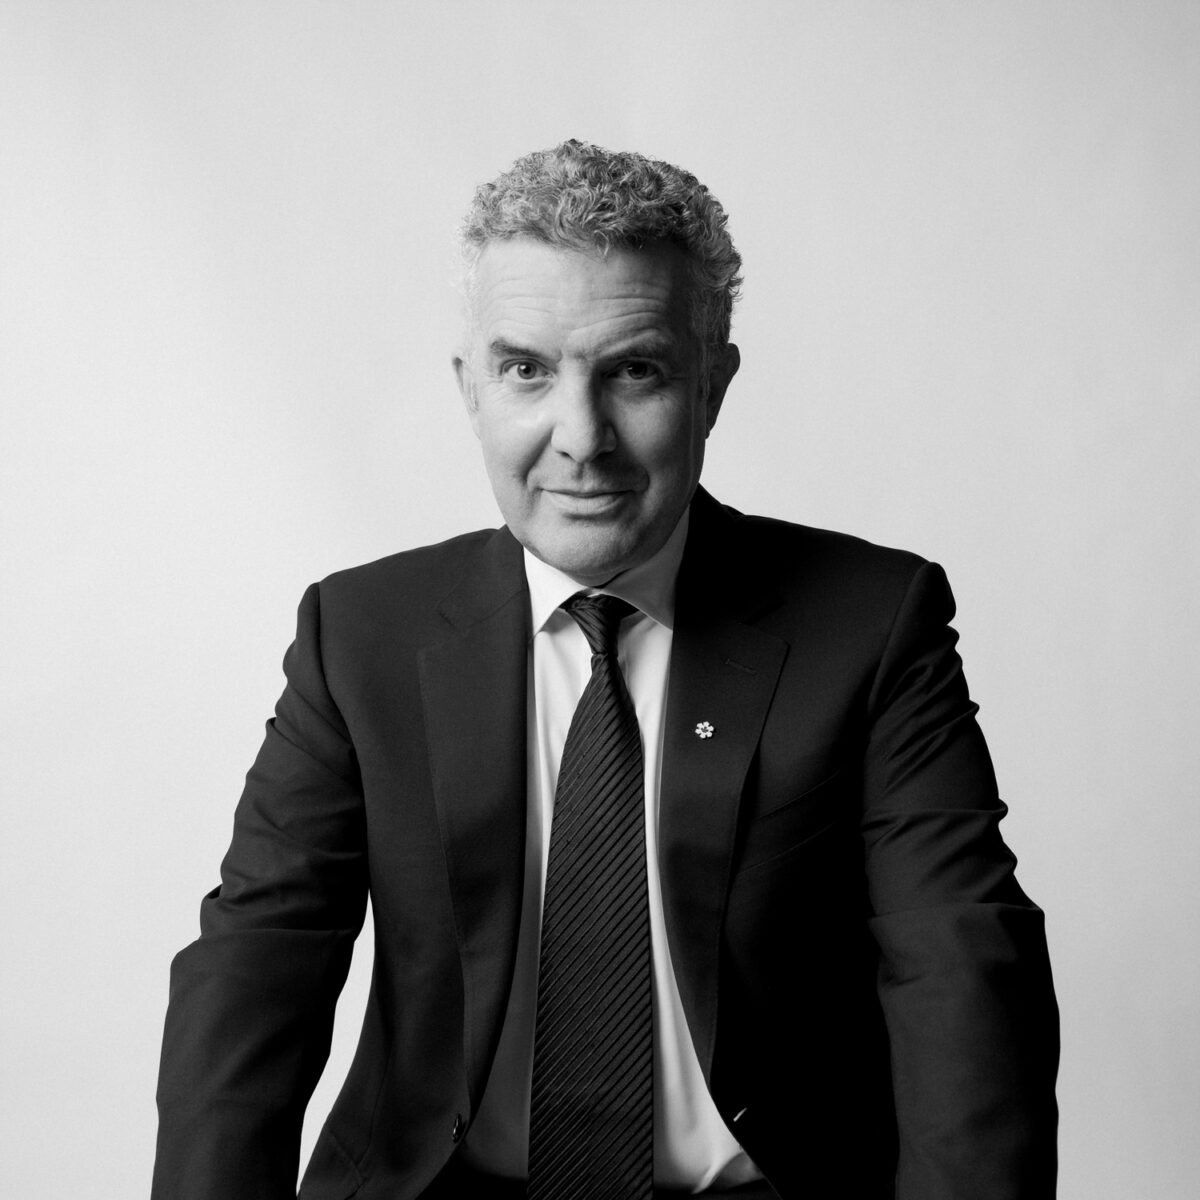
Naheed Nenshi Loves the Drama
Calgary’s centrist ex-mayor will have to win over skeptical NDP voters—and take on Danielle Smith—to reclaim Alberta. He’s looking forward to it.
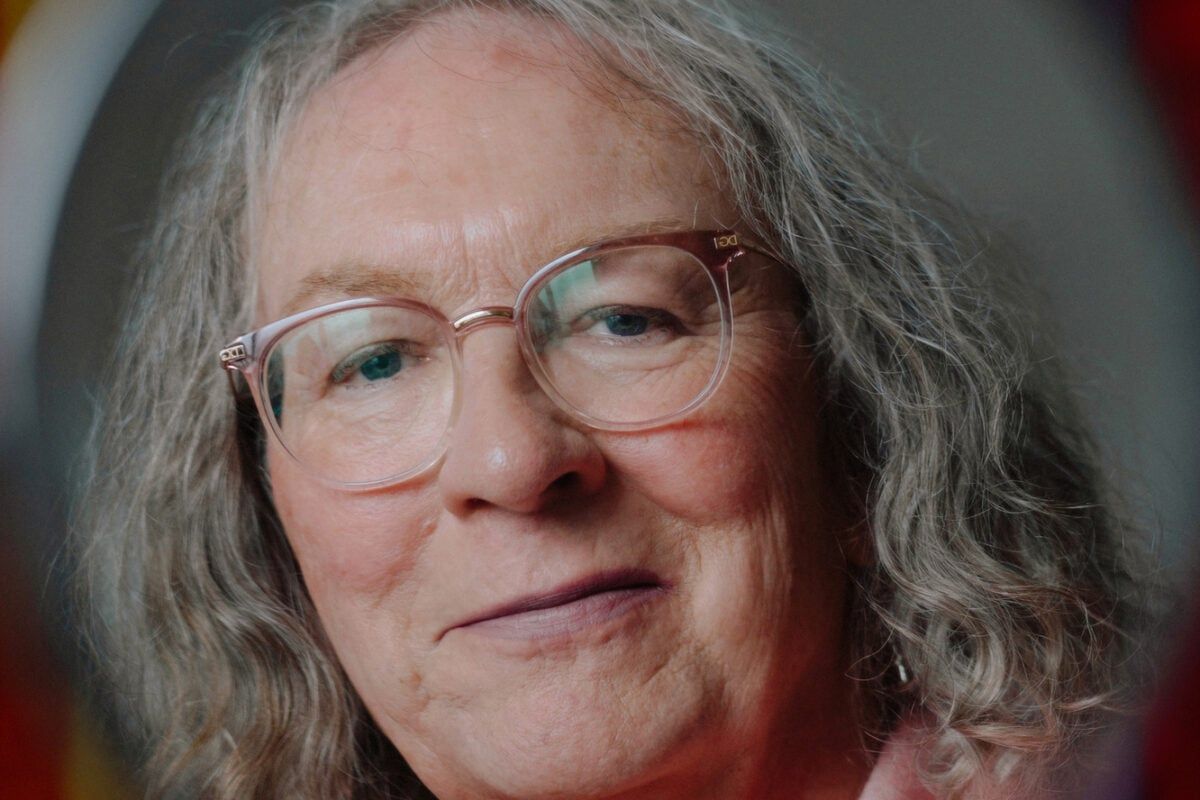
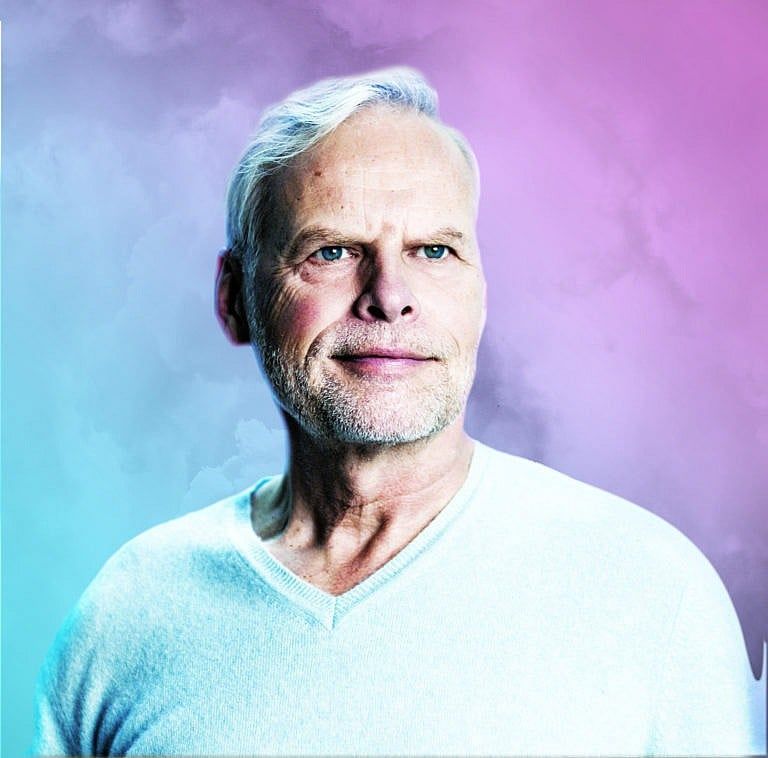
My Trans Awakening—at Age 66
I came out after a lifetime in the closet. Now, I’ve found a community of people just like me in Calgary’s Rainbow Elders.
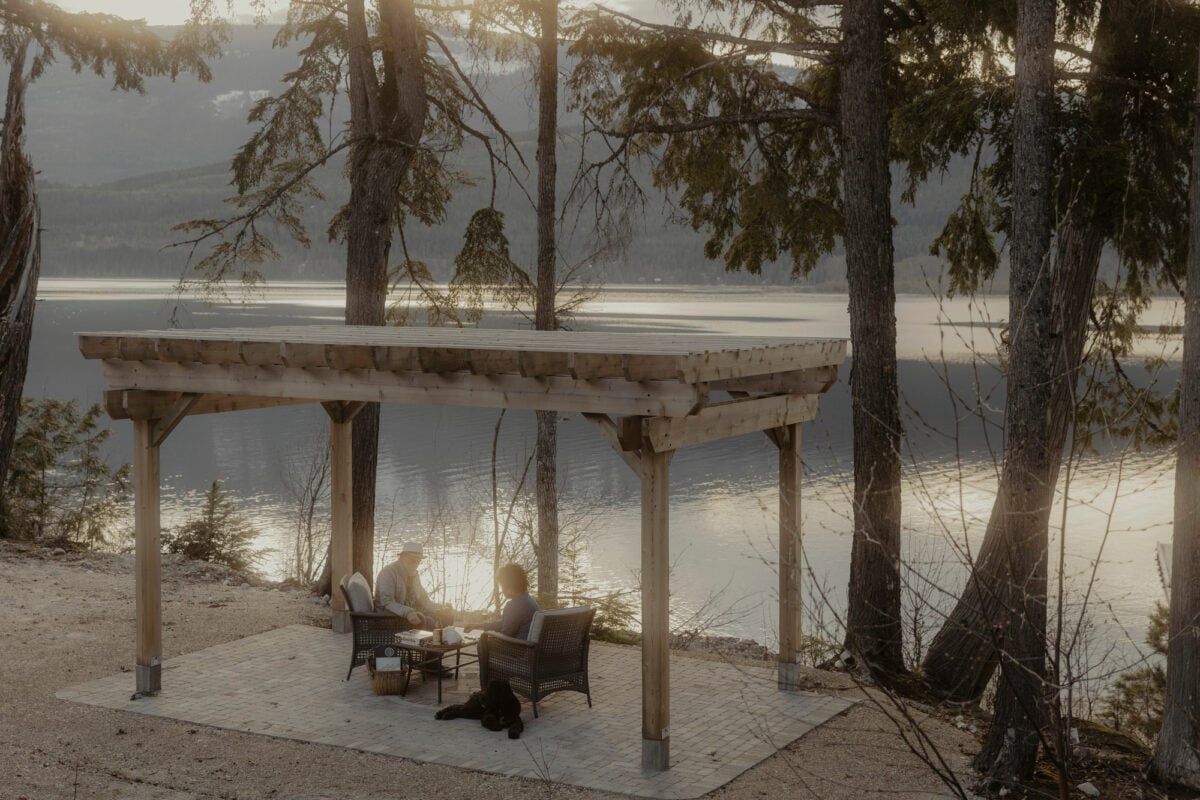
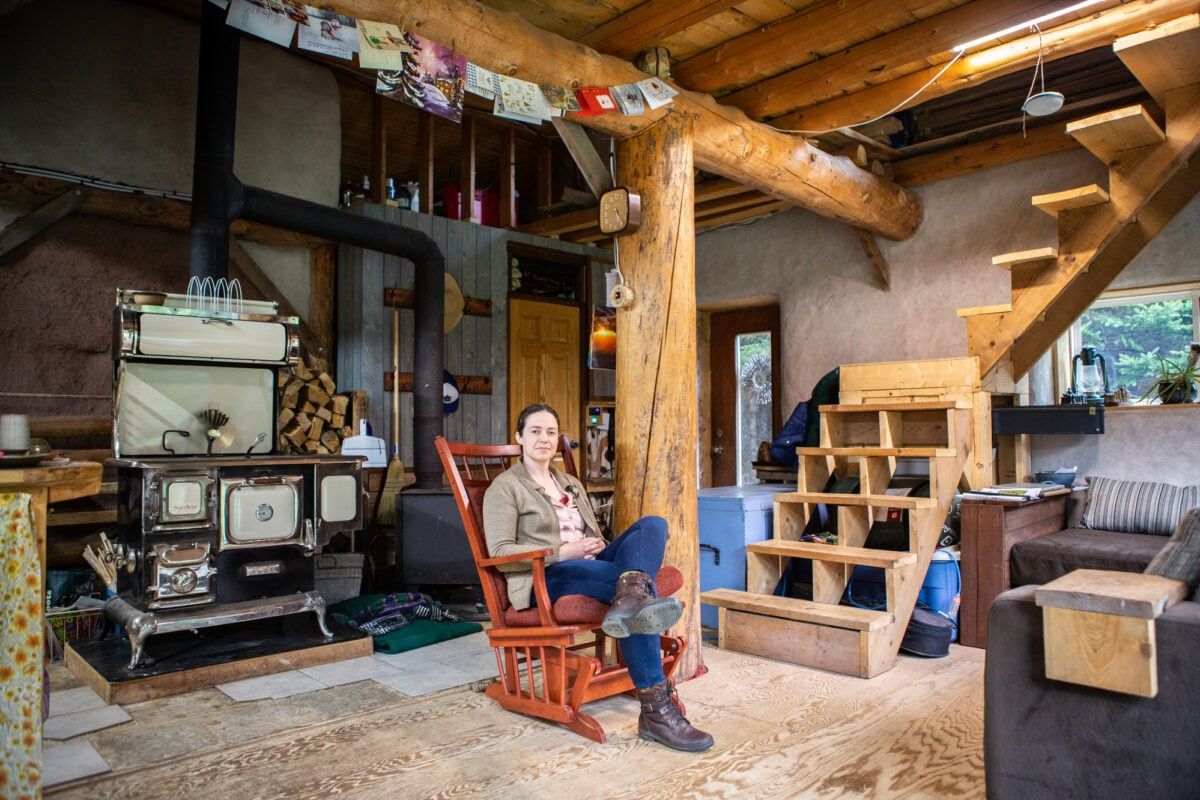
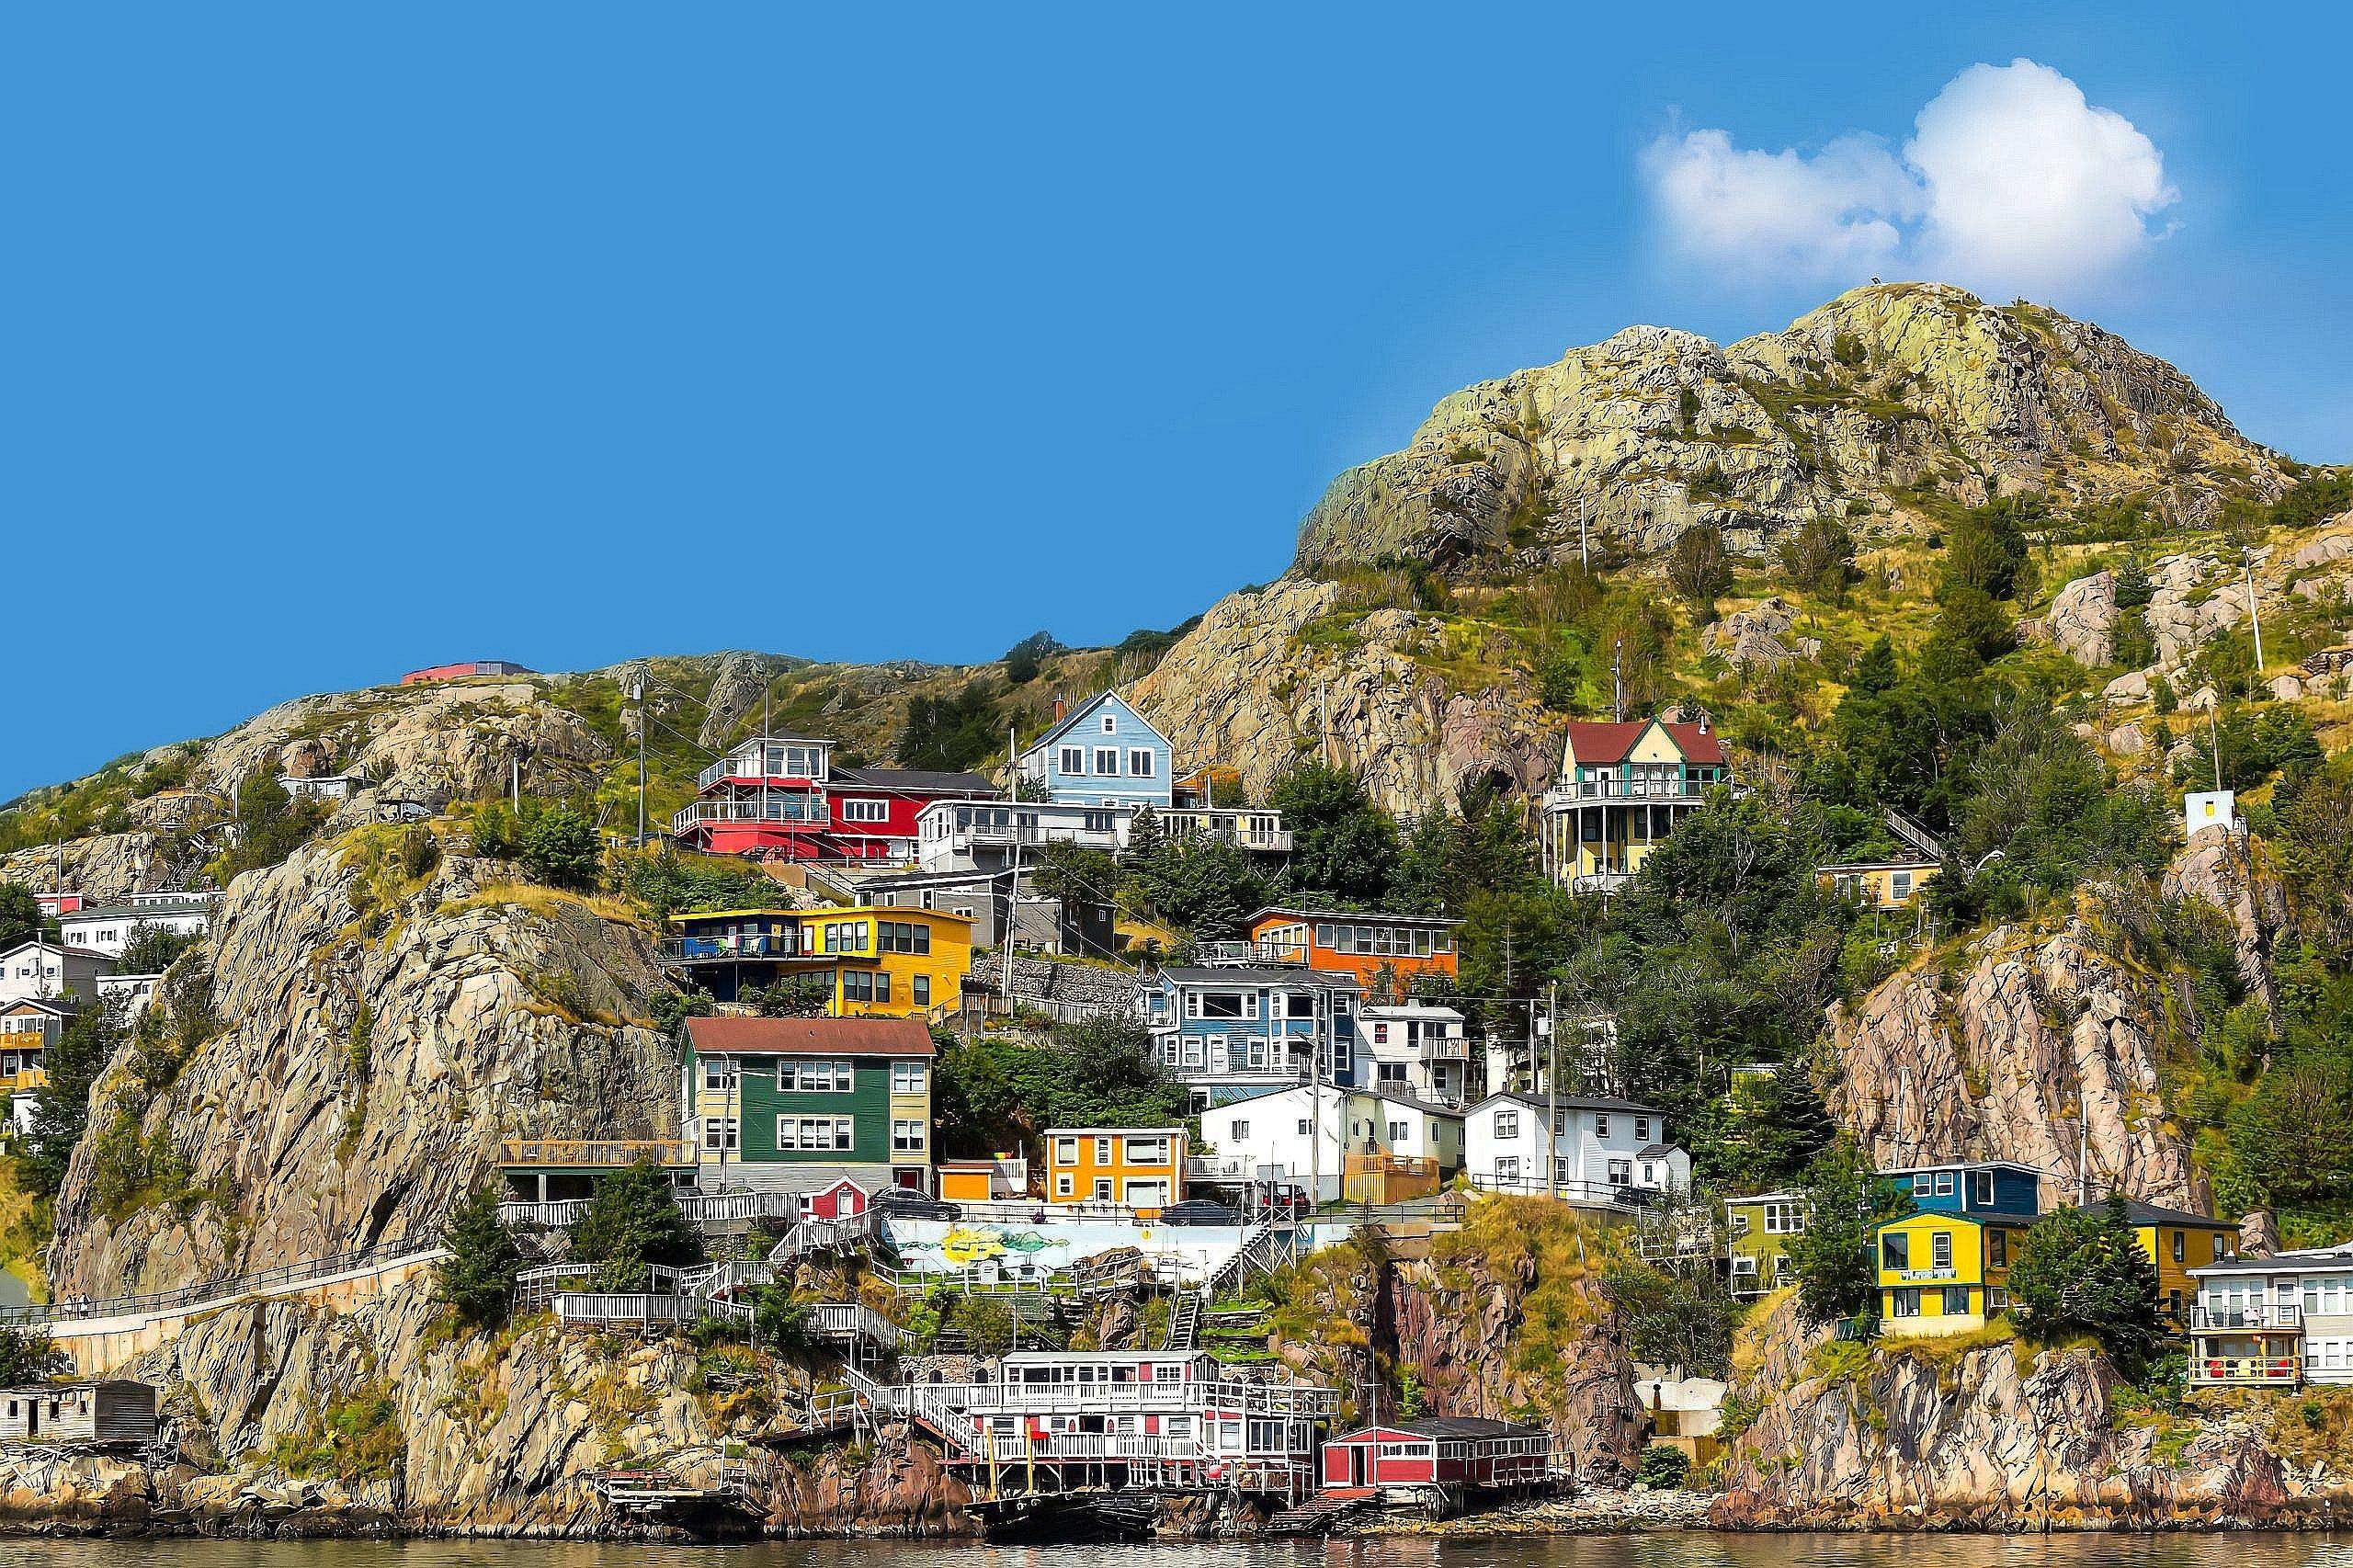
A Lakeside Vintage Wonderland
An Etsy seller fills her lakeside B.C. cottage with secondhand treasures
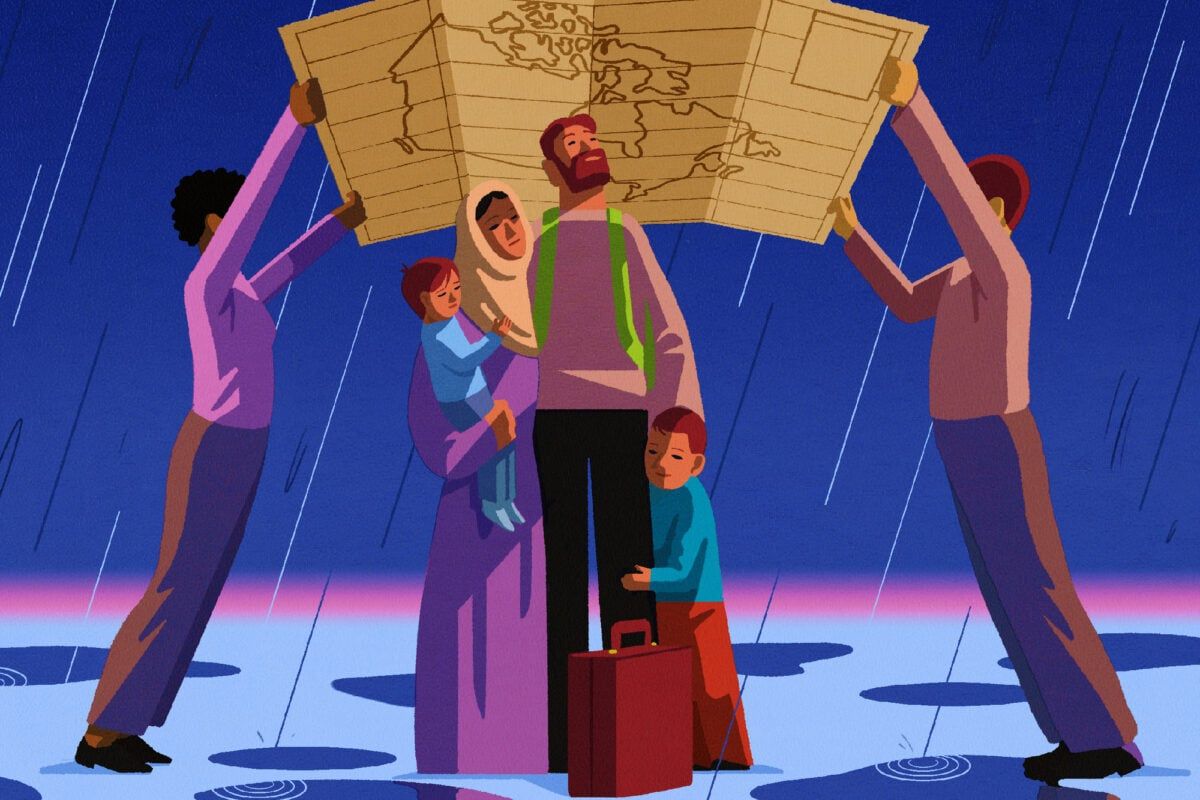
The Case For Refugee Reception Centres
Asylum seekers are arriving in Canada in record numbers, sleeping in shelters, churches and sometimes on the street. Reception centres are a more humane approach.
EDITOR’S PICKS
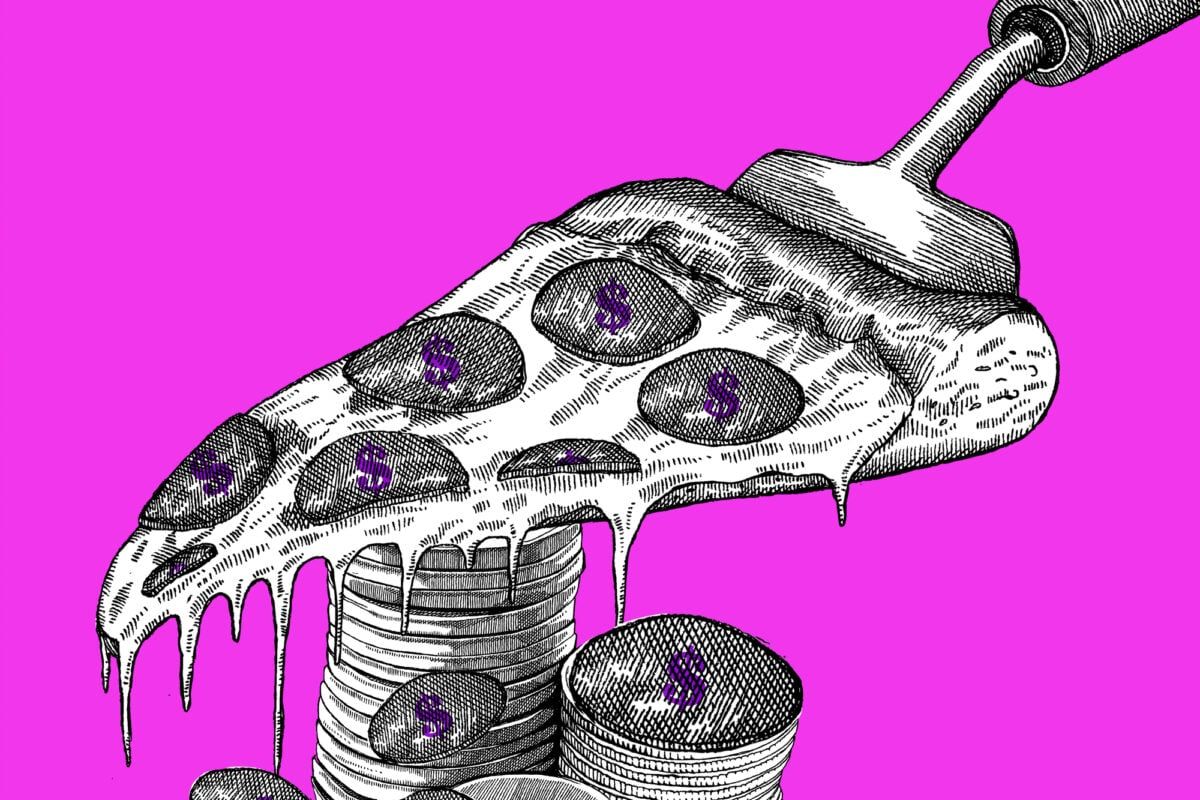
A Restaurant Ended Tipping—Then Brought It Back
We wanted to pay our staff a living wage and waive tipping. Rising costs forced us to revert to the old ways.
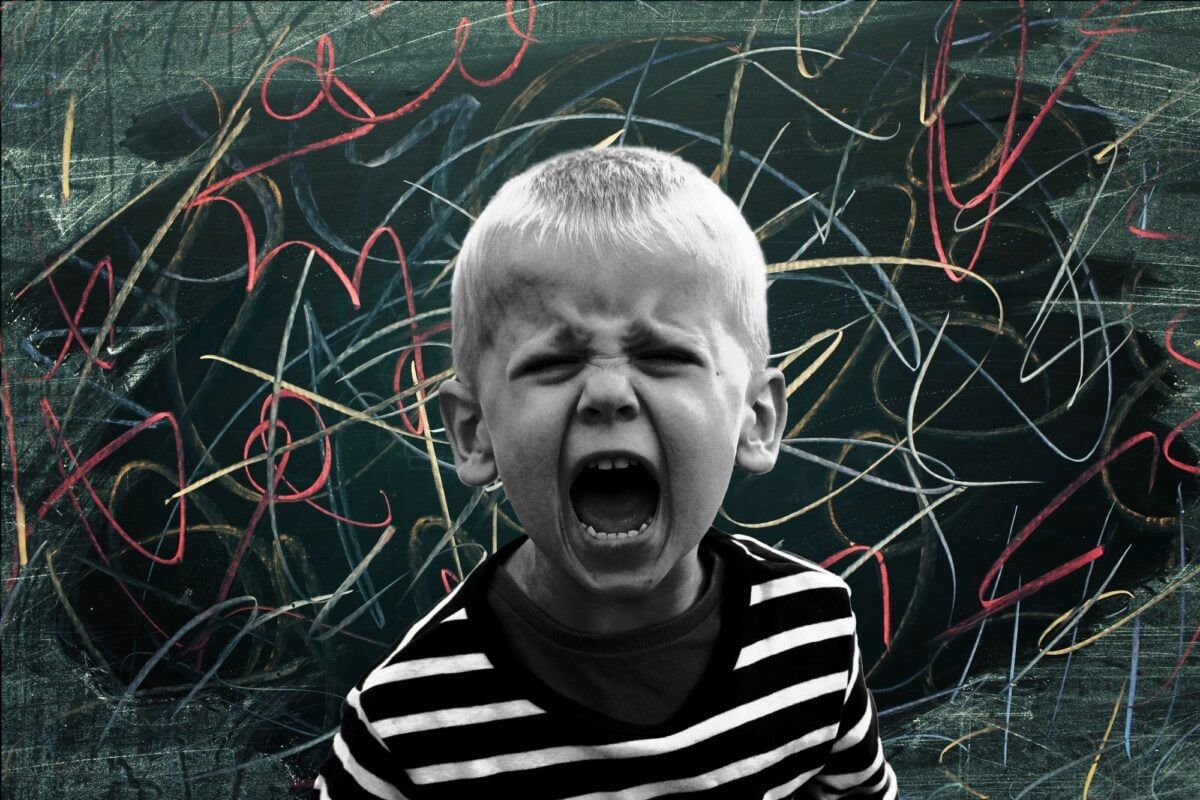
Why I Left Public Education
I spent 21 years in Hamilton schools. Drastic budget cuts and a rise in violence caused me to leave that world for good.

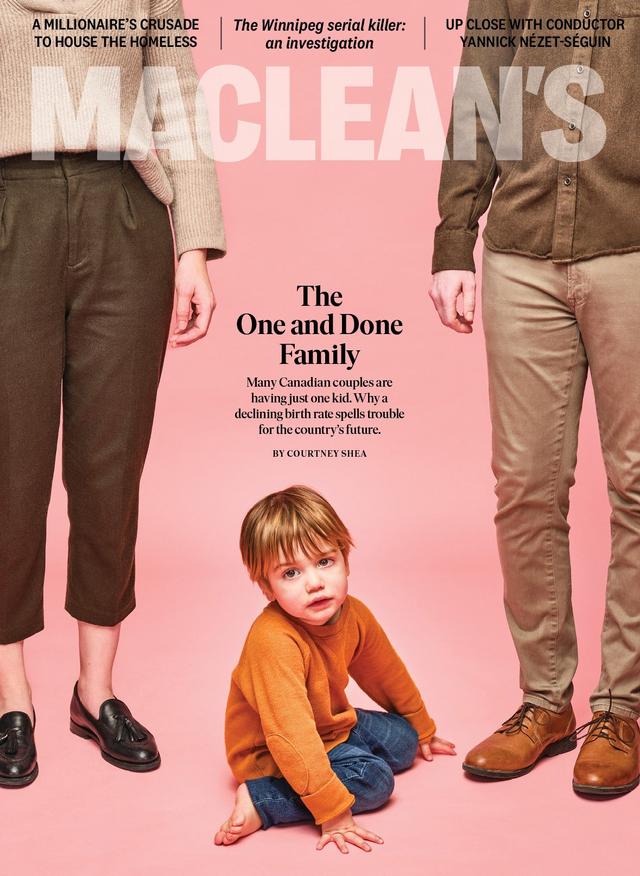
The Rise of the One-and-Done Family
Many Canadian couples are having just one kid. Why a declining birth rate spells trouble for the country’s future.
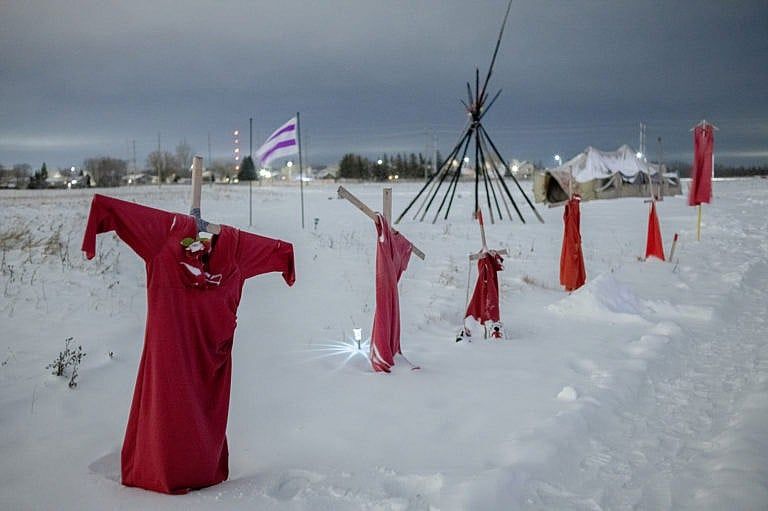
A Killer Among Them
In the spring of 2022, four women went missing within the same few blocks in downtown Winnipeg. This spring, the man accused of their murders will go on trial. So will the city they all called home.

A group of Canadian parents say their kids are so addicted to the video game Fortnite that they’ve stopped eating, sleeping and showering. Now these parents want to hold its tech-giant creator accountable.
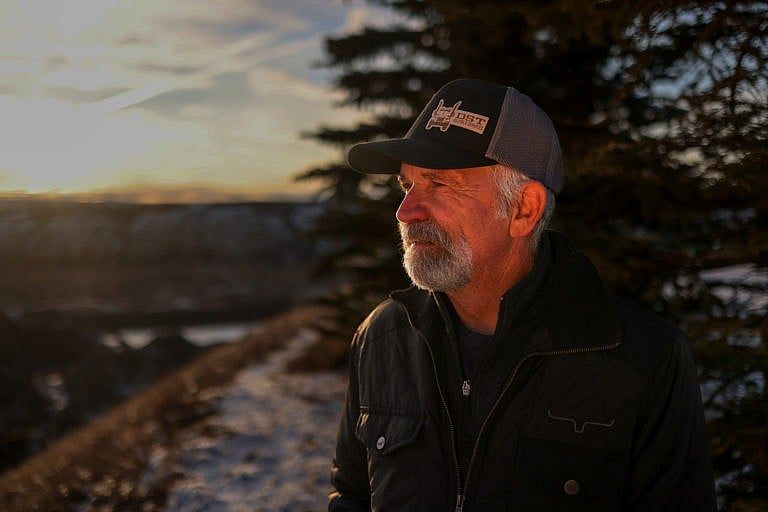
Drought Killed My Farm
Our family farm has thrived in Alberta for more than a century—but the dire weather conditions of the past few years have spelled its end

Give All Canadian Workers Paid Sick Leave
Canadians are working while ill to avoid losing income. Instituting country-wide sick-leave policies is a healthier option.

Why Canada Has So Many Cyberattacks
Cybersecurity boss Sami Khoury tells us how crime plays out in the Cyber Wild West
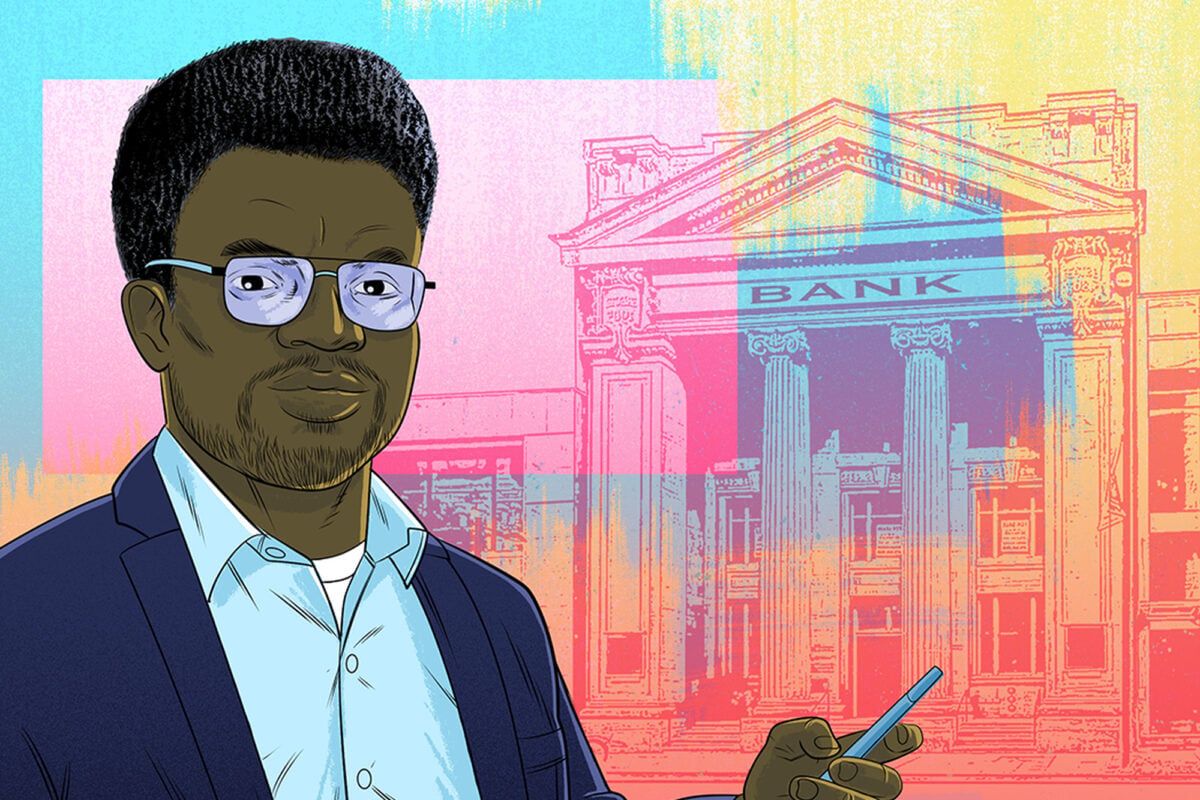
I Help Immigrants Build New Lives (and Credit)
My family and I were denied housing, car rentals and even hotel reservations, all because we didn’t have a credit card.
SUBSCRIBE TO MACLEAN’S
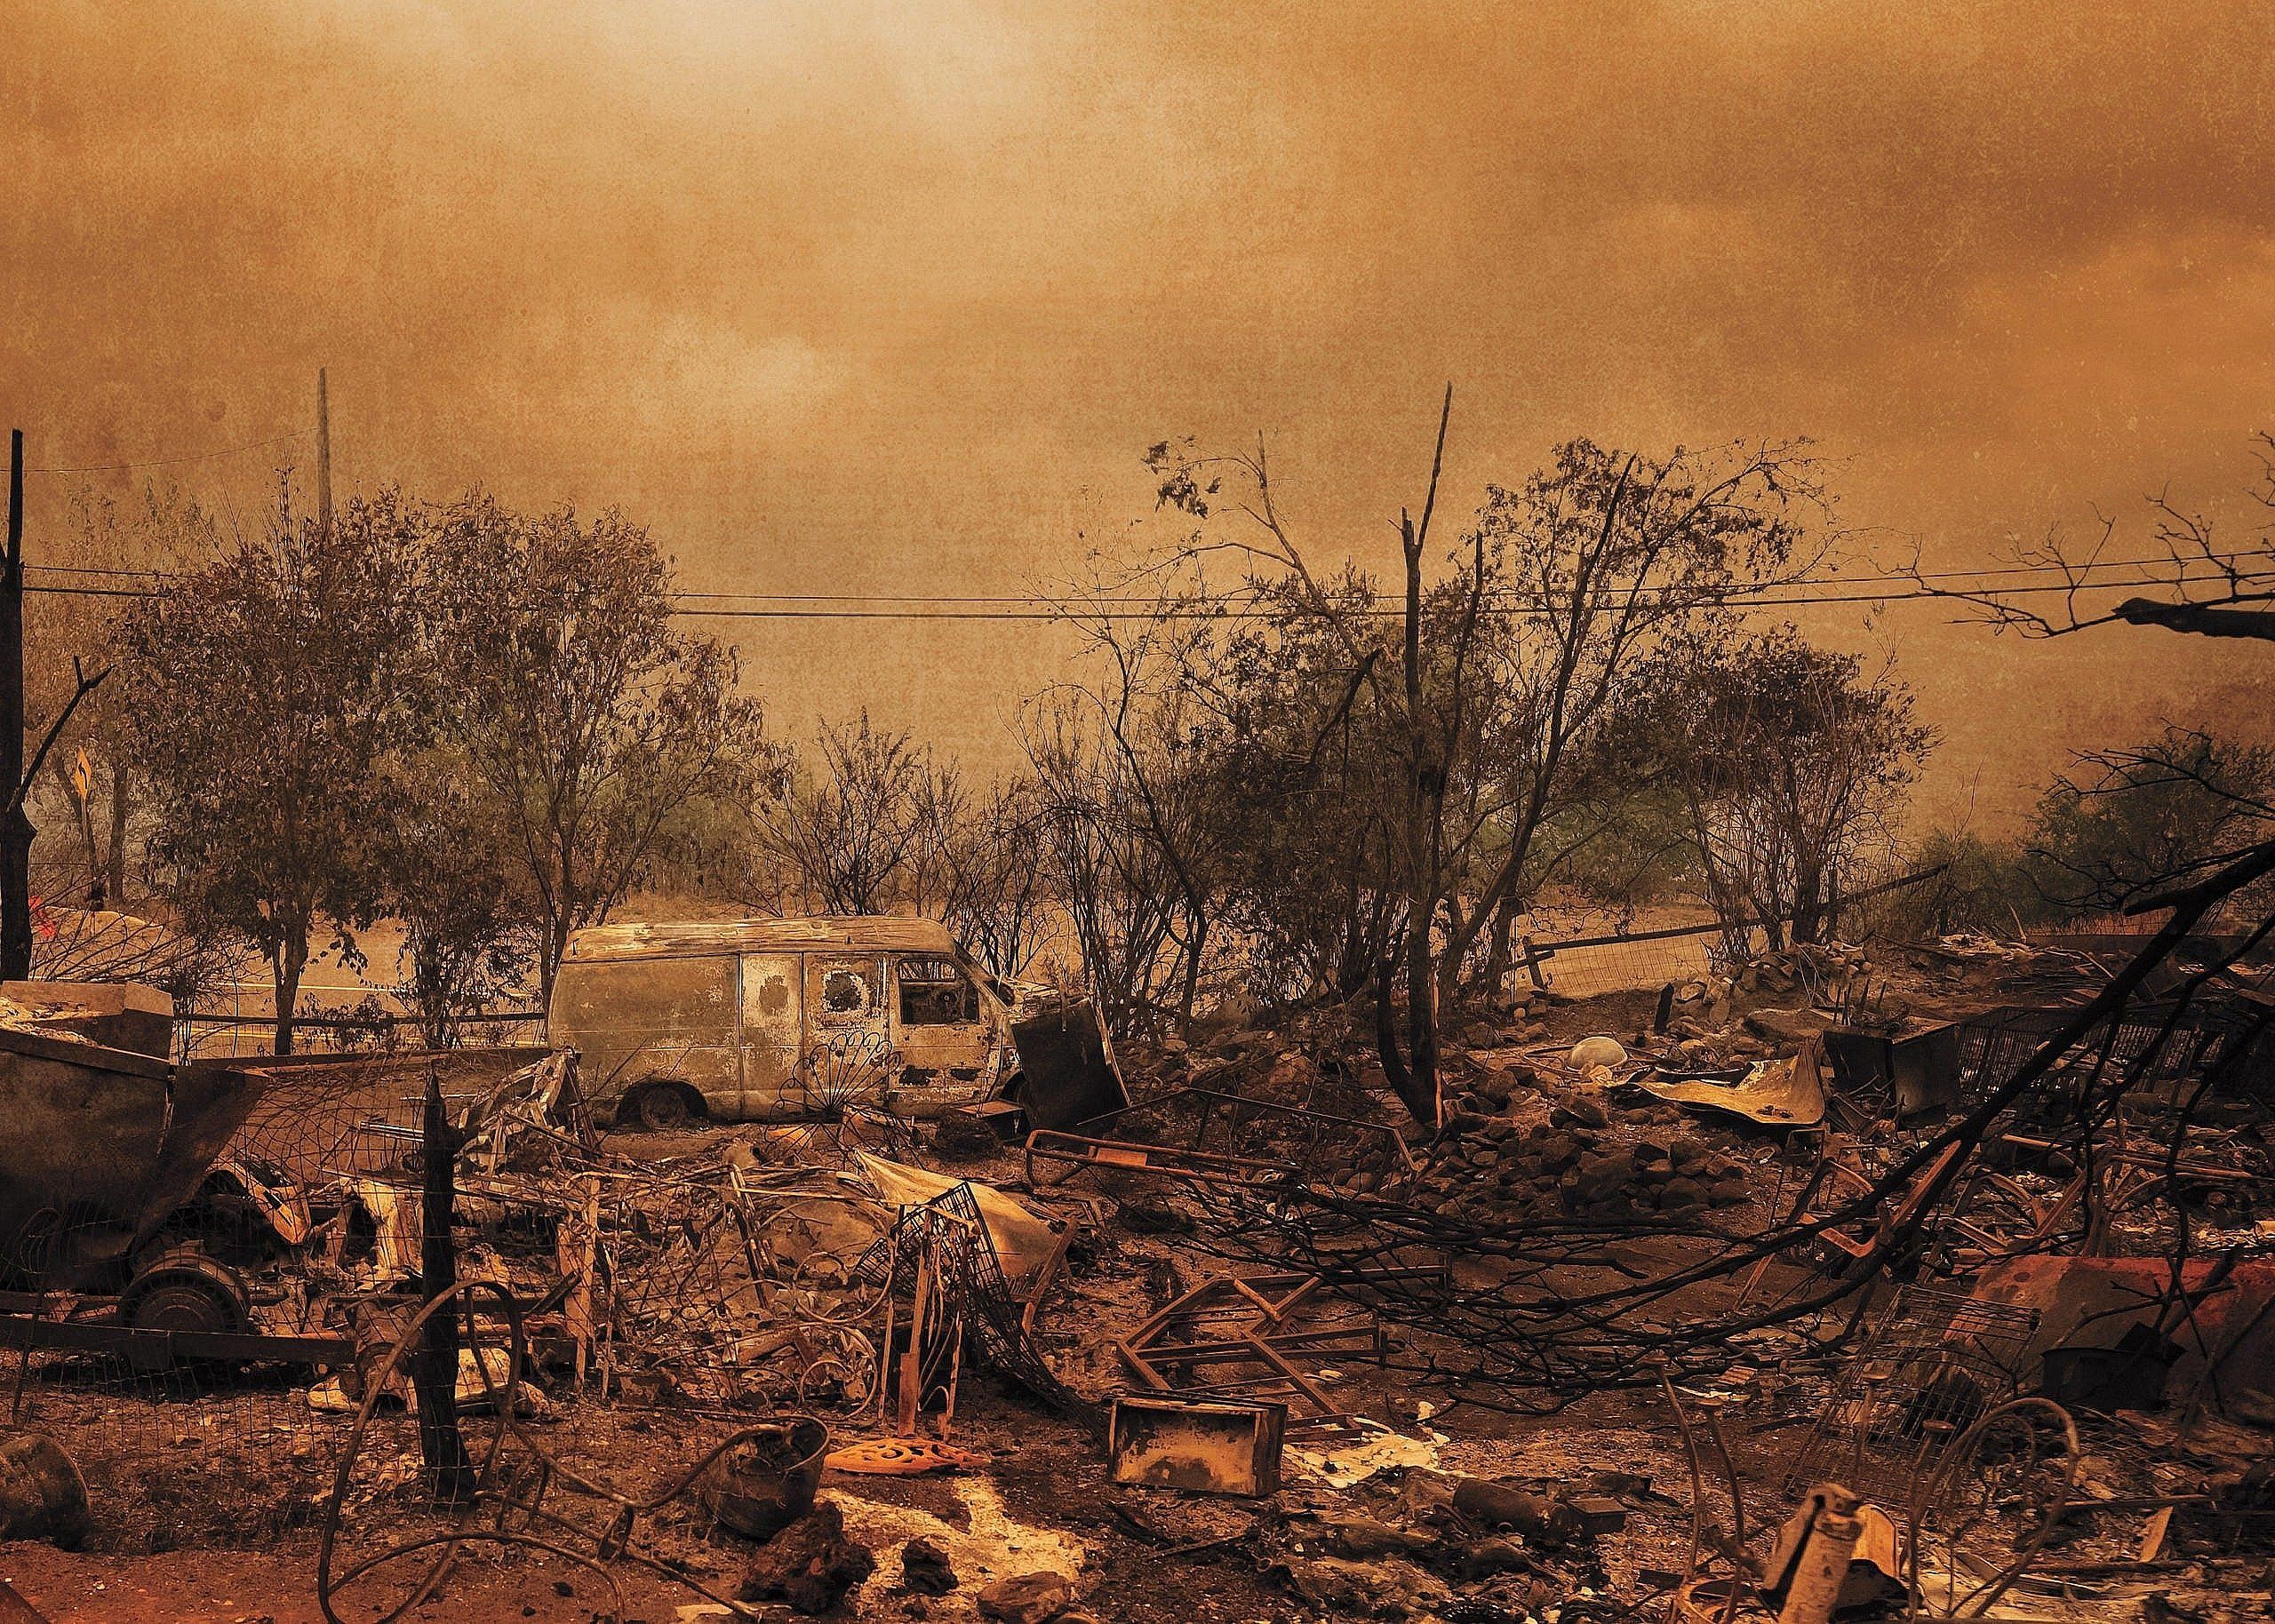
Summers lost to fire and smoke. Biblical floods. Dying forests. Retreating coasts. Economic turmoil and political unrest. It’s going to be a weird century. Here’s what it will look like—and how Canada can get through it.
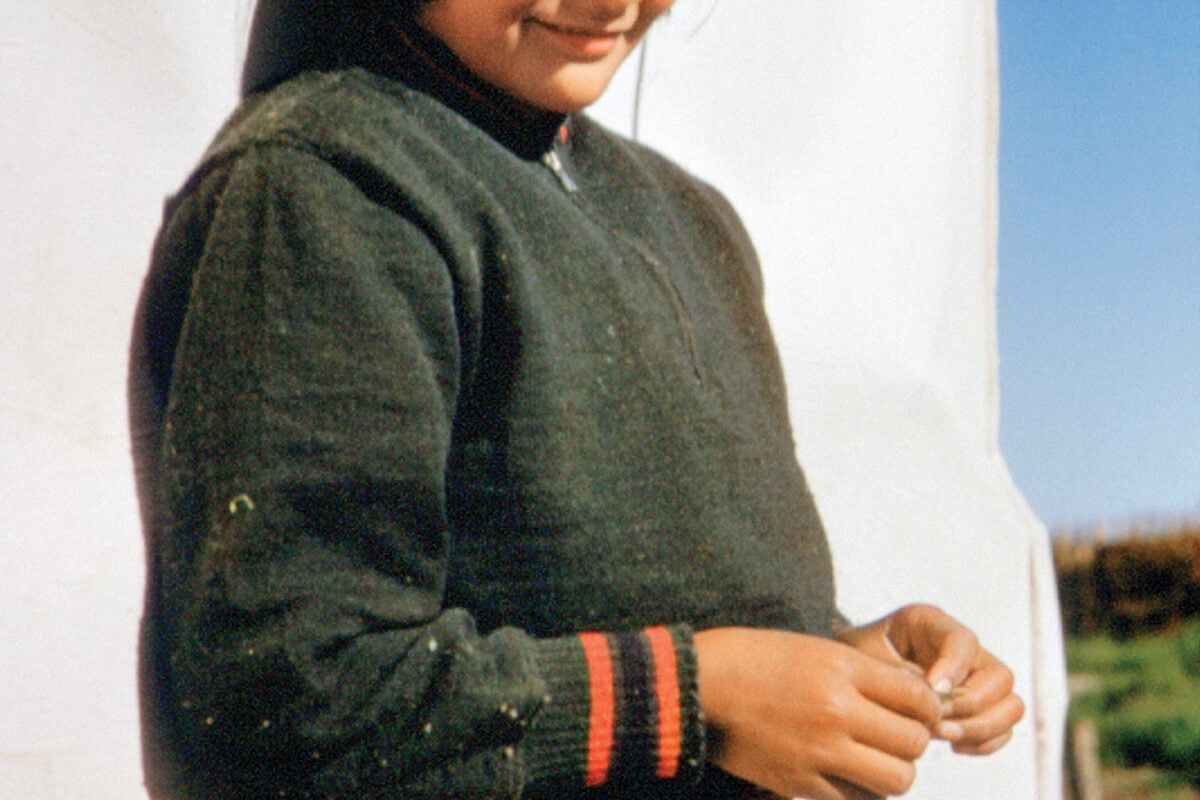
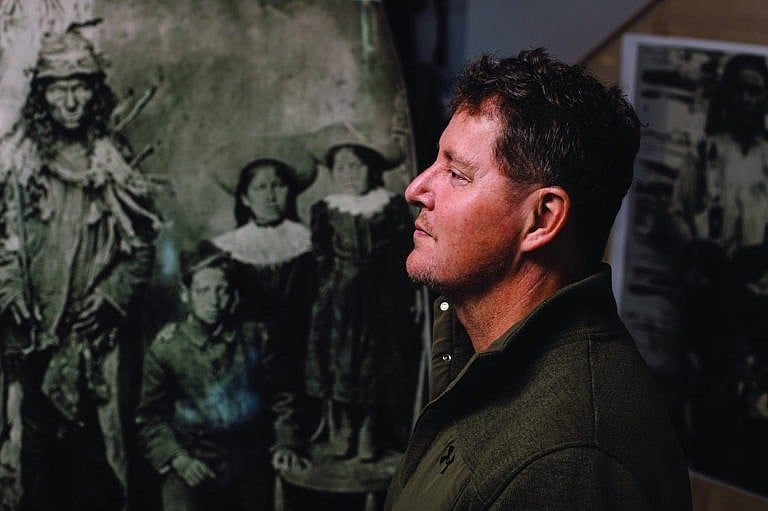
A Voyage to the North
A new exhibit chronicles daily Indigenous life in northern Ontario in the ’50s and ’60s

I Paid $22k For Private Surgery
With wait times getting longer by the year, the choice was easy
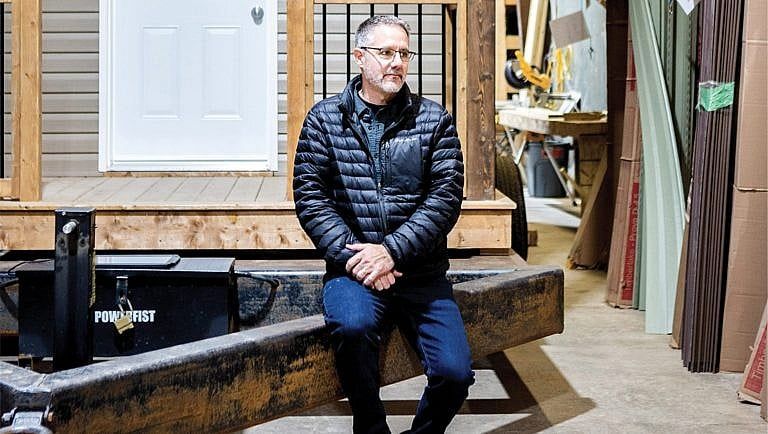
Fredericton’s Tiny-Home Revolution
Marcel LeBrun made millions as a software tycoon, then funnelled his fortune into 12 Neighbours, a planned community of 99 affordable tiny homes in Fredericton. For the city’s unhoused, it’s a chance to turn their luck around.
REAL ESTATE
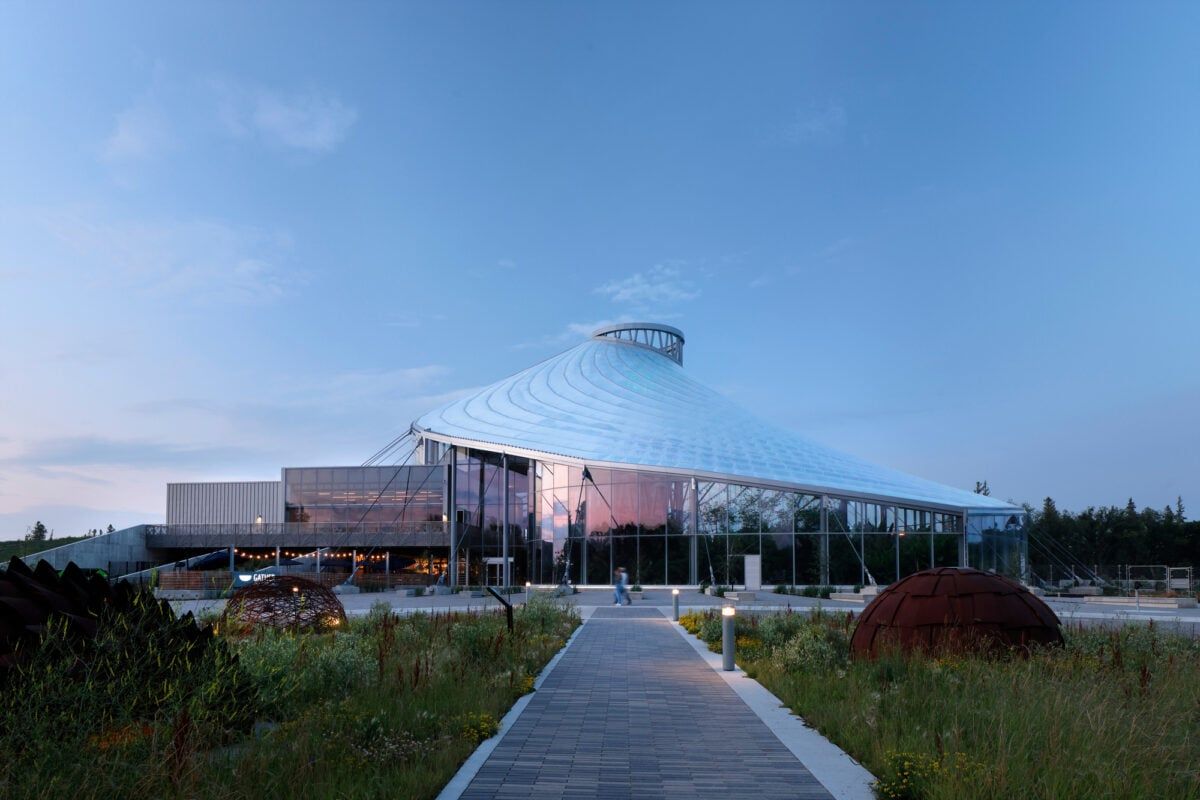
A Plant Lover’s Paradise
A spiralling roof, a 60-foot waterfall, “dinosaur trees”—how architects breathed new life into Winnipeg’s The Leaf
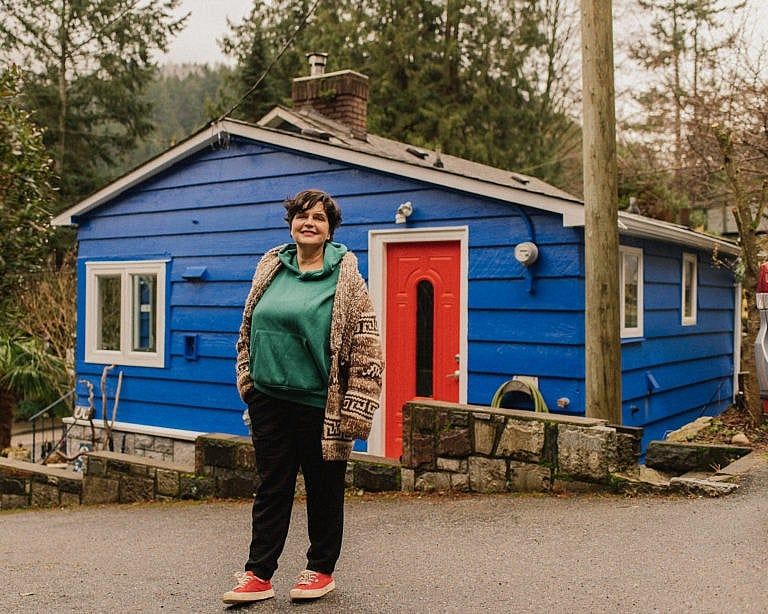
I Bought a Group of B.C. Cottages—With Strangers
When the home I loved went on the market in 2021, a friend suggested I start a collective to buy it. I said, “Oh come on, that’s ridiculous.” But the idea stuck in my head.

Inside a Real-Life Barbie Dreamhouse
Seasoned home renovator Rebekah Higgs created her own all-pink palace, which she shares with her daughter and dog

EDUCATION
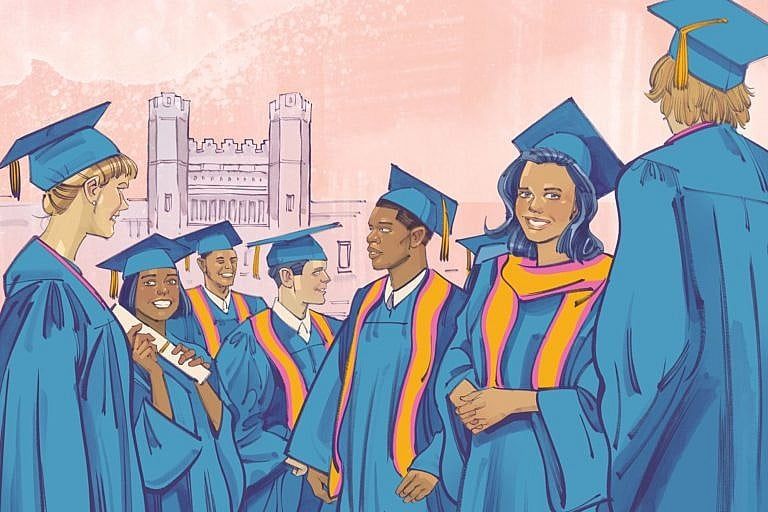
The Ultimate Guide to Canadian Universities 2024
Getting into top programs is increasingly competitive. Our Ultimate Guide to Canadian Universities is here to help.
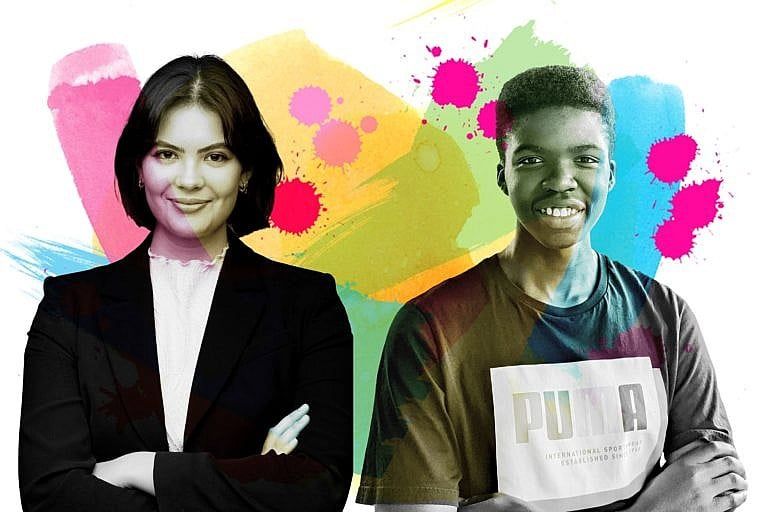
How to win a big scholarship
A strong vision, hard work and plenty of smarts are needed to impress scholarship juries. Here’s the inside story on how these students beat the odds.
My budget as a university student in Canada
Being a student can be expensive. Three undergrads share where the money goes.
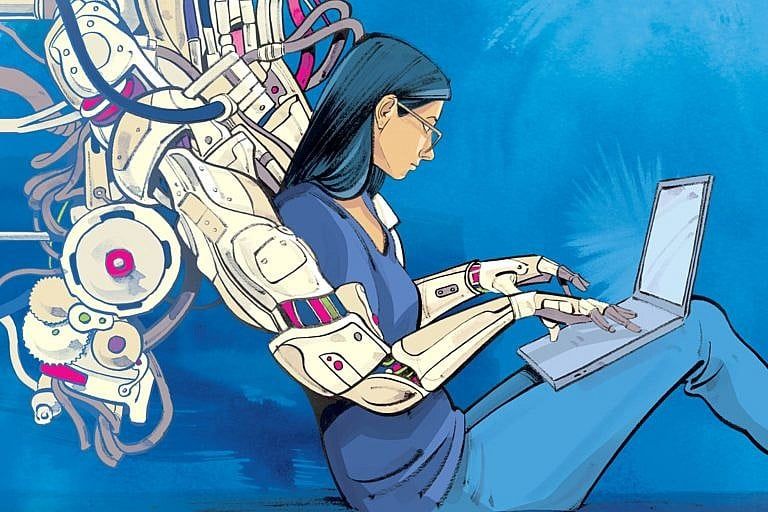
ChatGPT is everywhere. What’s fair use for students trying to get into university?
“It’s not about ‘how do we catch the cheaters?’ That’s not a forward way of thinking.”
FROM OUR PARTNERS
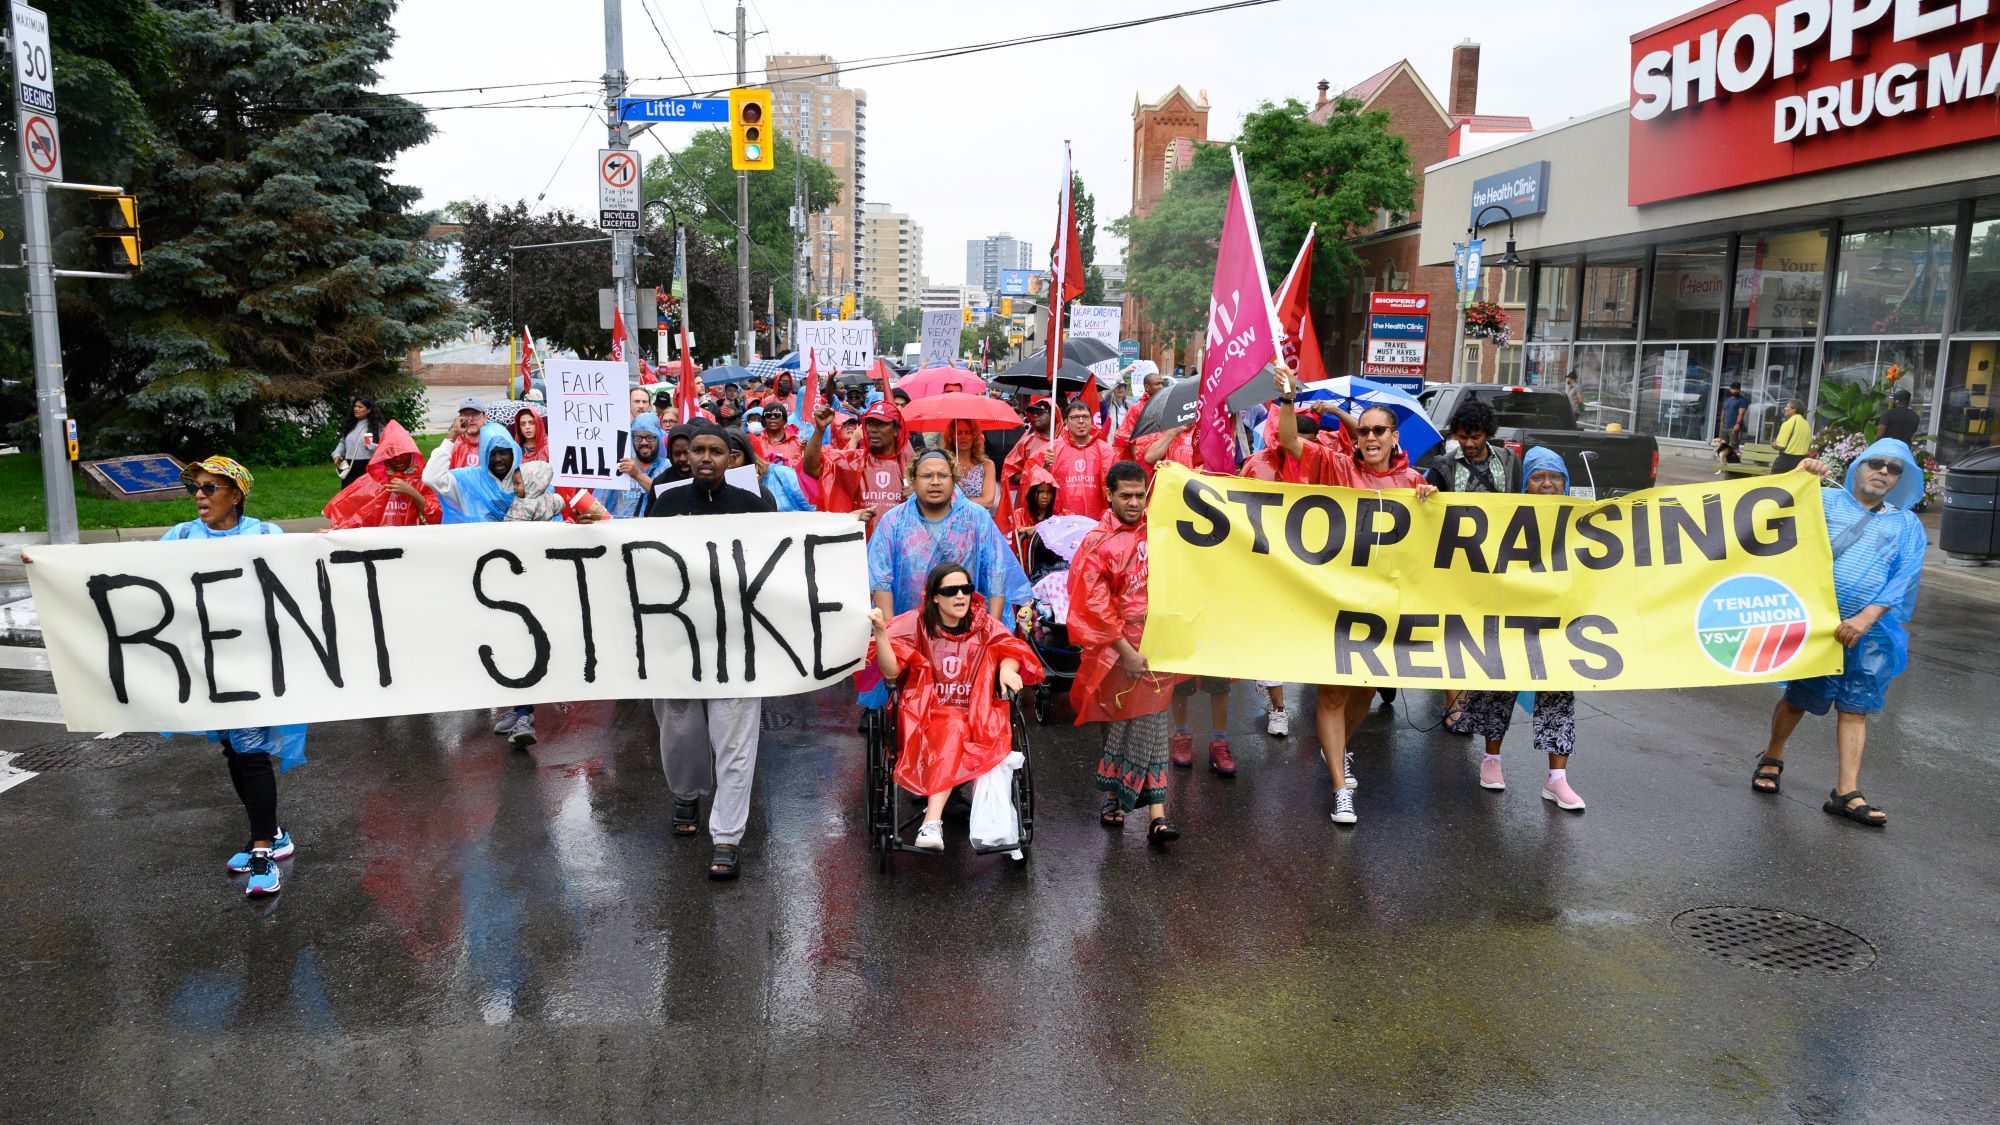
Hundreds of tenants, struggling to afford skyrocketing rents, are refusing to pay their landlords at all. They call it a rent strike. The landlords say it’s illegal. An inside look at the frontier of a growing class war.
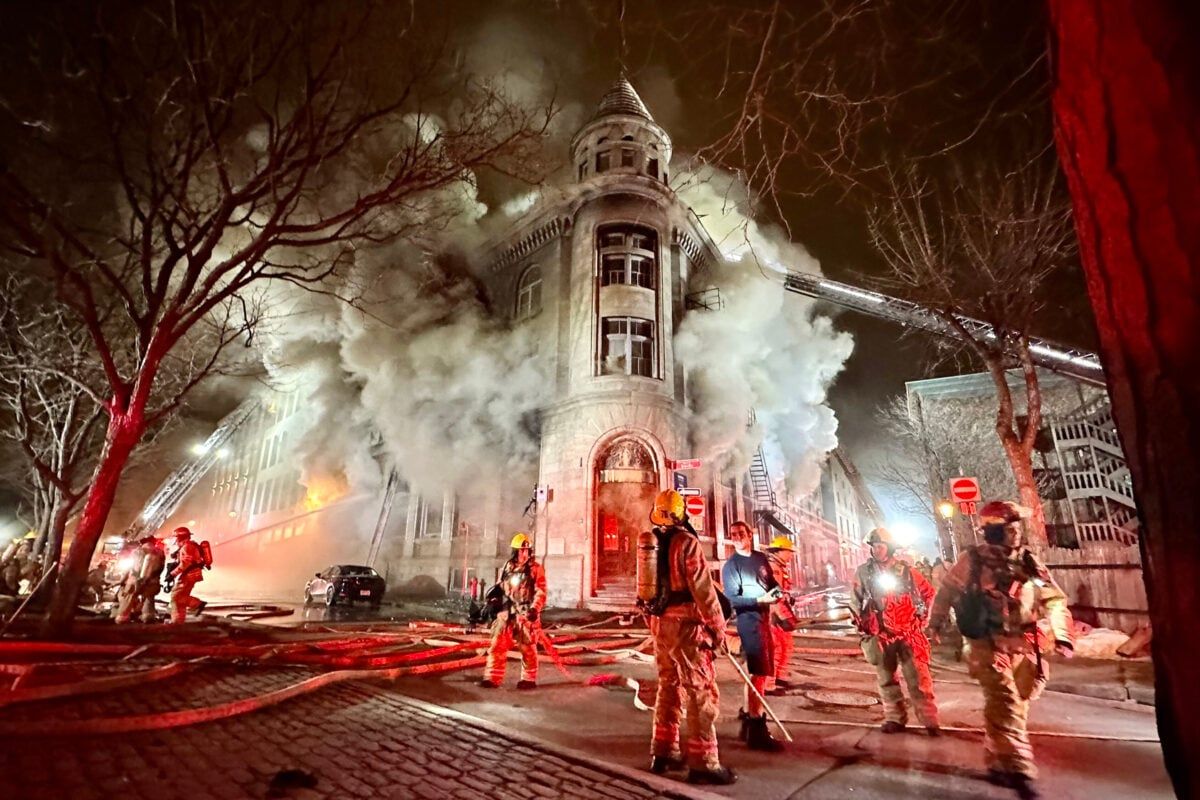
The Great Airbnb Crackdown
Last year, a massive blaze consumed several illegal Airbnb units in Montreal and killed seven people. The tragedy shone a harsh light on the Wild West of Airbnb in Canadian cities—and the battle to regulate it has just begun.

The Incel Terrorist
Oguzhan Sert was 17 when he walked into a Toronto massage parlour and killed an employee with a sword. The Crown argued the attack wasn’t just murder, but an act of terror against women. The hard part would be proving it.
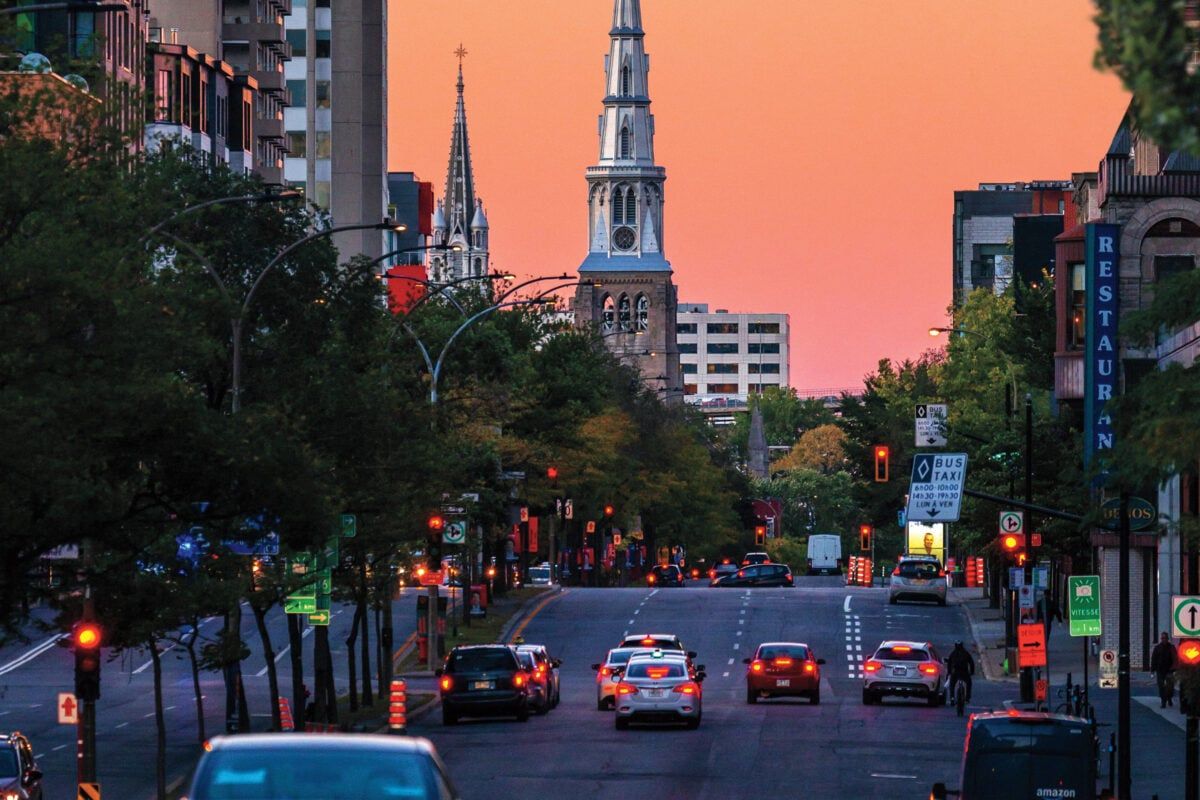
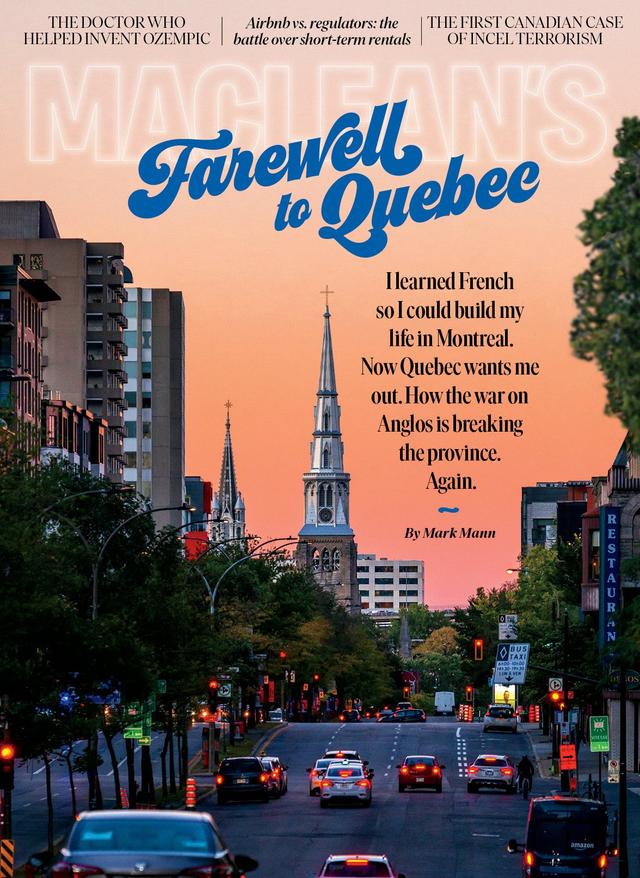
Quebec’s New French Revolution
When I moved to Montreal, it was a vibrant, multilingual metropolis. Now François Legault is waging war on English and on the cosmopolitanism that makes it Canada’s greatest city.
A Killer Among Them
In the spring of 2022, four women went missing within the same few blocks in downtown Winnipeg. This spring, the man accused of their murders will go on trial. So will the city they all called home.
The Rise of the One-and-Done Family
Many Canadian couples are having just one kid. Why a declining birth rate spells trouble for the country’s future.
How one Canadian tech millionaire built a tiny-home community
Marcel LeBrun made millions as a software tycoon, then funnelled his fortune into 12 Neighbours, a planned community of 99 affordable tiny homes in Fredericton. For the city’s unhoused, it’s a chance to turn their luck around.
The DNA Detective
RCMP officer Dean Lerat, a member of Cowessess First Nation in Saskatchewan, found many of his long-lost relatives using a DNA-testing kit. Now he helps others connect with their own families, fragmented by colonialism. The results tell the story of a whole nation.
The False Prophet of Edmonton
In a suburban industrial park, John de Ruiter built up a spiritual movement, mashing up Christian theology and New Age mysticism. Today, eight former followers claim he brainwashed them into sex. The case against him will test the boundaries of consent.
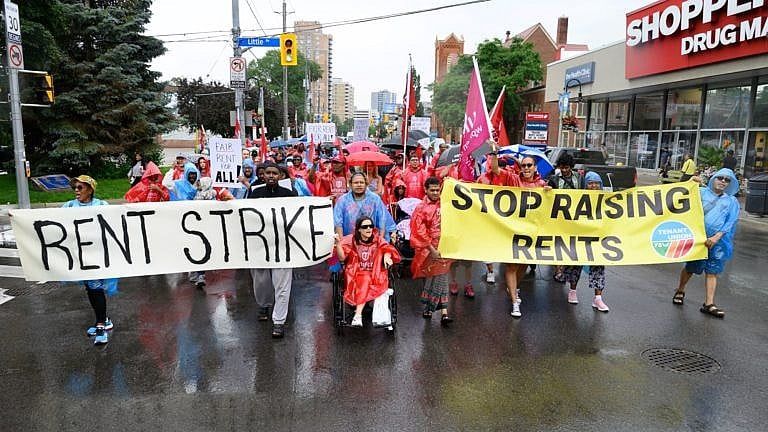
Revenge of the Renter
Hundreds of tenants, struggling to afford skyrocketing rents, are refusing to pay their landlords at all. They call it a rent strike. The landlords say it’s illegal. An inside look at the frontier of a growing class war

The Rise and Fall of a Chinese-Canadian Pop Star
Kris Wu, an ordinary kid from Vancouver, transformed into one of China’s biggest celebrities, with chart-topping albums, movie roles and lucrative brand partnerships. Then a series of social media accusations brought him down.

The Unsteady Reign of Danielle Smith
Alberta’s premier rode into office declaring war on the federal government—and won by a tiny margin. Can she keep her rebellious rural base happy, without sparking a national crisis?
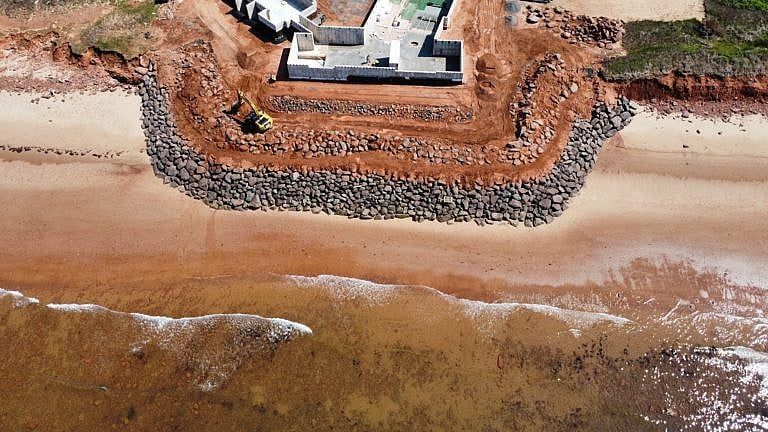
The Battle for a Prince Edward Island Beach
A Toronto millionaire wanted to build a beachfront mega-cottage on a remote stretch of Prince Edward Island’s pristine north shore. Then the locals got wind of it.