The 338Canada post-election report: We called it
Here is a brief post-mortem of last night’s election results compared with the final 338Canada federal projection. I say "brief" for two reasons: 1) I wish to wait until all the numbers are official before diving into individual districts; 2) I badly need some sleep.
Overall, the winner was correctly identified in 299 of 338 districts (88 per cent). I had set the bar at 300 (damn you, Nunavut!), so it’s fairly respectable.
Individual ridings aside, it is (almost) always a safe bet to trust the averages. And, as you will see below, the averages were pretty darn good.
But before we look at the regional results, let’s take a look at the hit and miss rate by projection labels. The 338Canada model classifies all district projections in four labels: Safe, Likely, Leaning and Toss up:
- The final projection labeled 88 districts as safe. The correct winner identified in all 88, for a perfect score of 100 per cent;
- A total of 106 districts were labeled as likely. The correct winner was called in 103 of 106, for a success rate of 97 per cent;
- Sixty districts were labeled as leaning. The correct winner was identified in 53 of them (88 per cent).
- Finally, 84 districts were toss ups. The model picked the right winner in 55 of them, for a respectable score of 65 per cent.
Let’s take a look at the regional projection, from east to west.
Related Posts
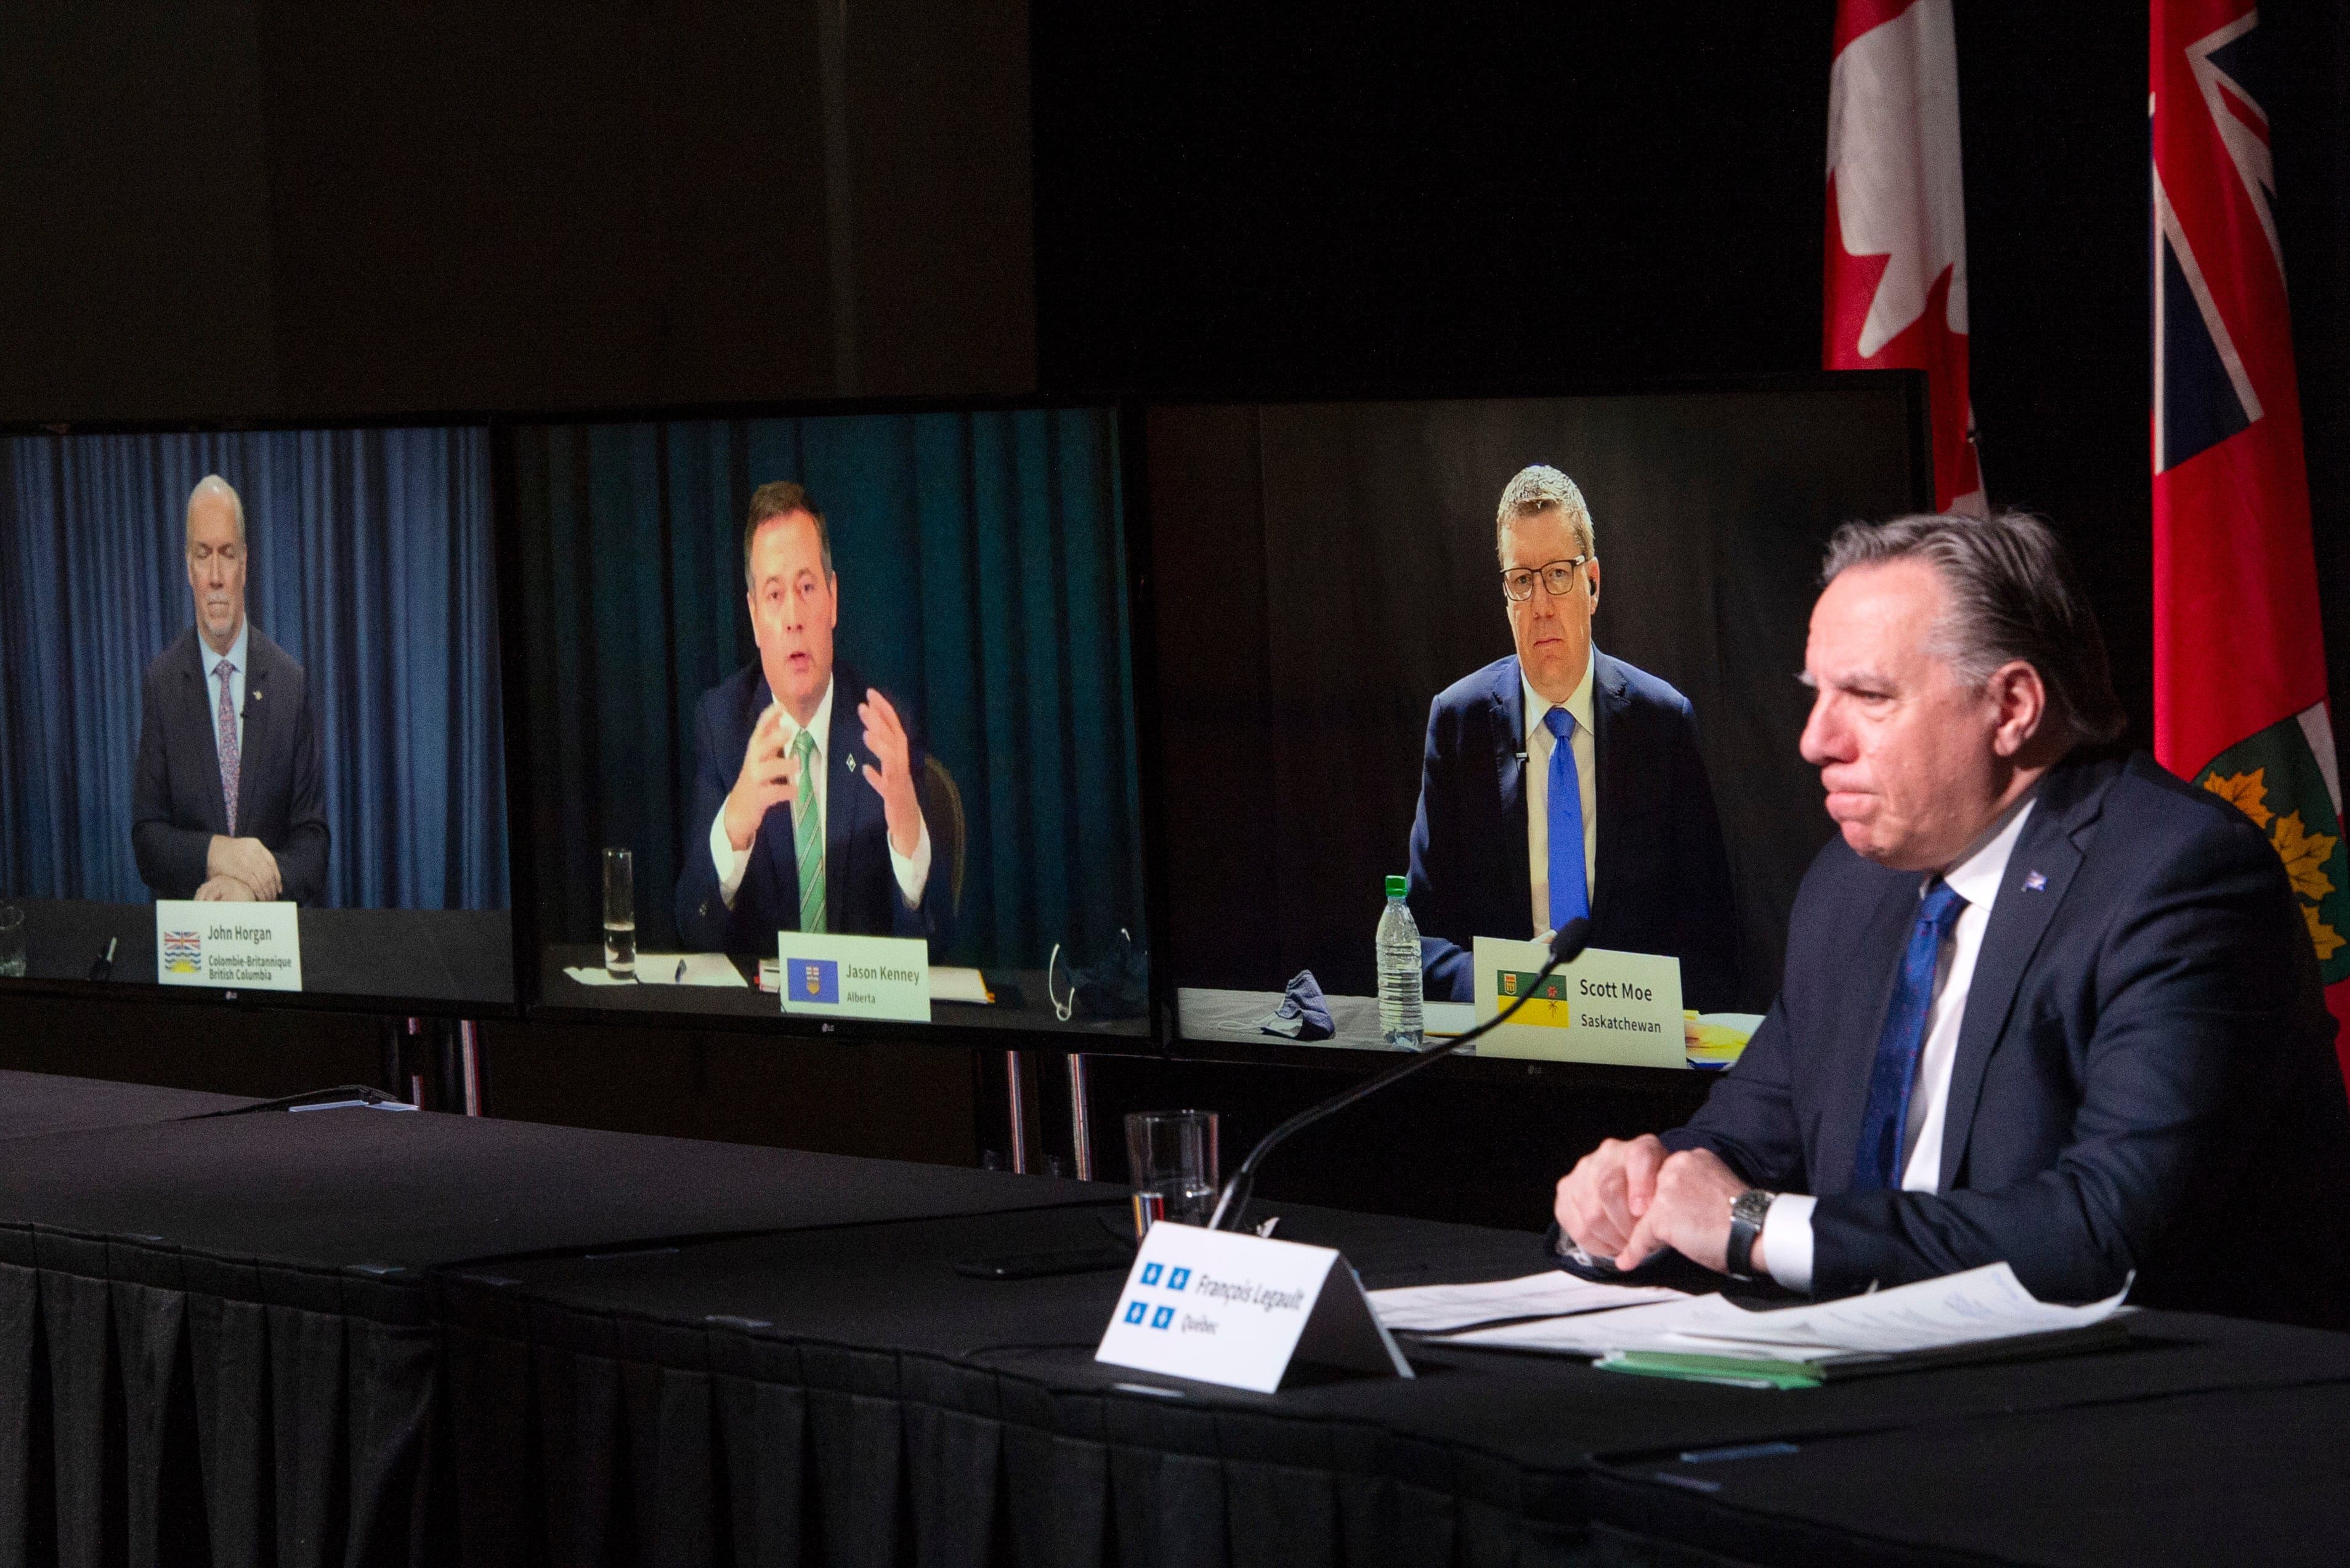
338Canada: A tale of two premiers
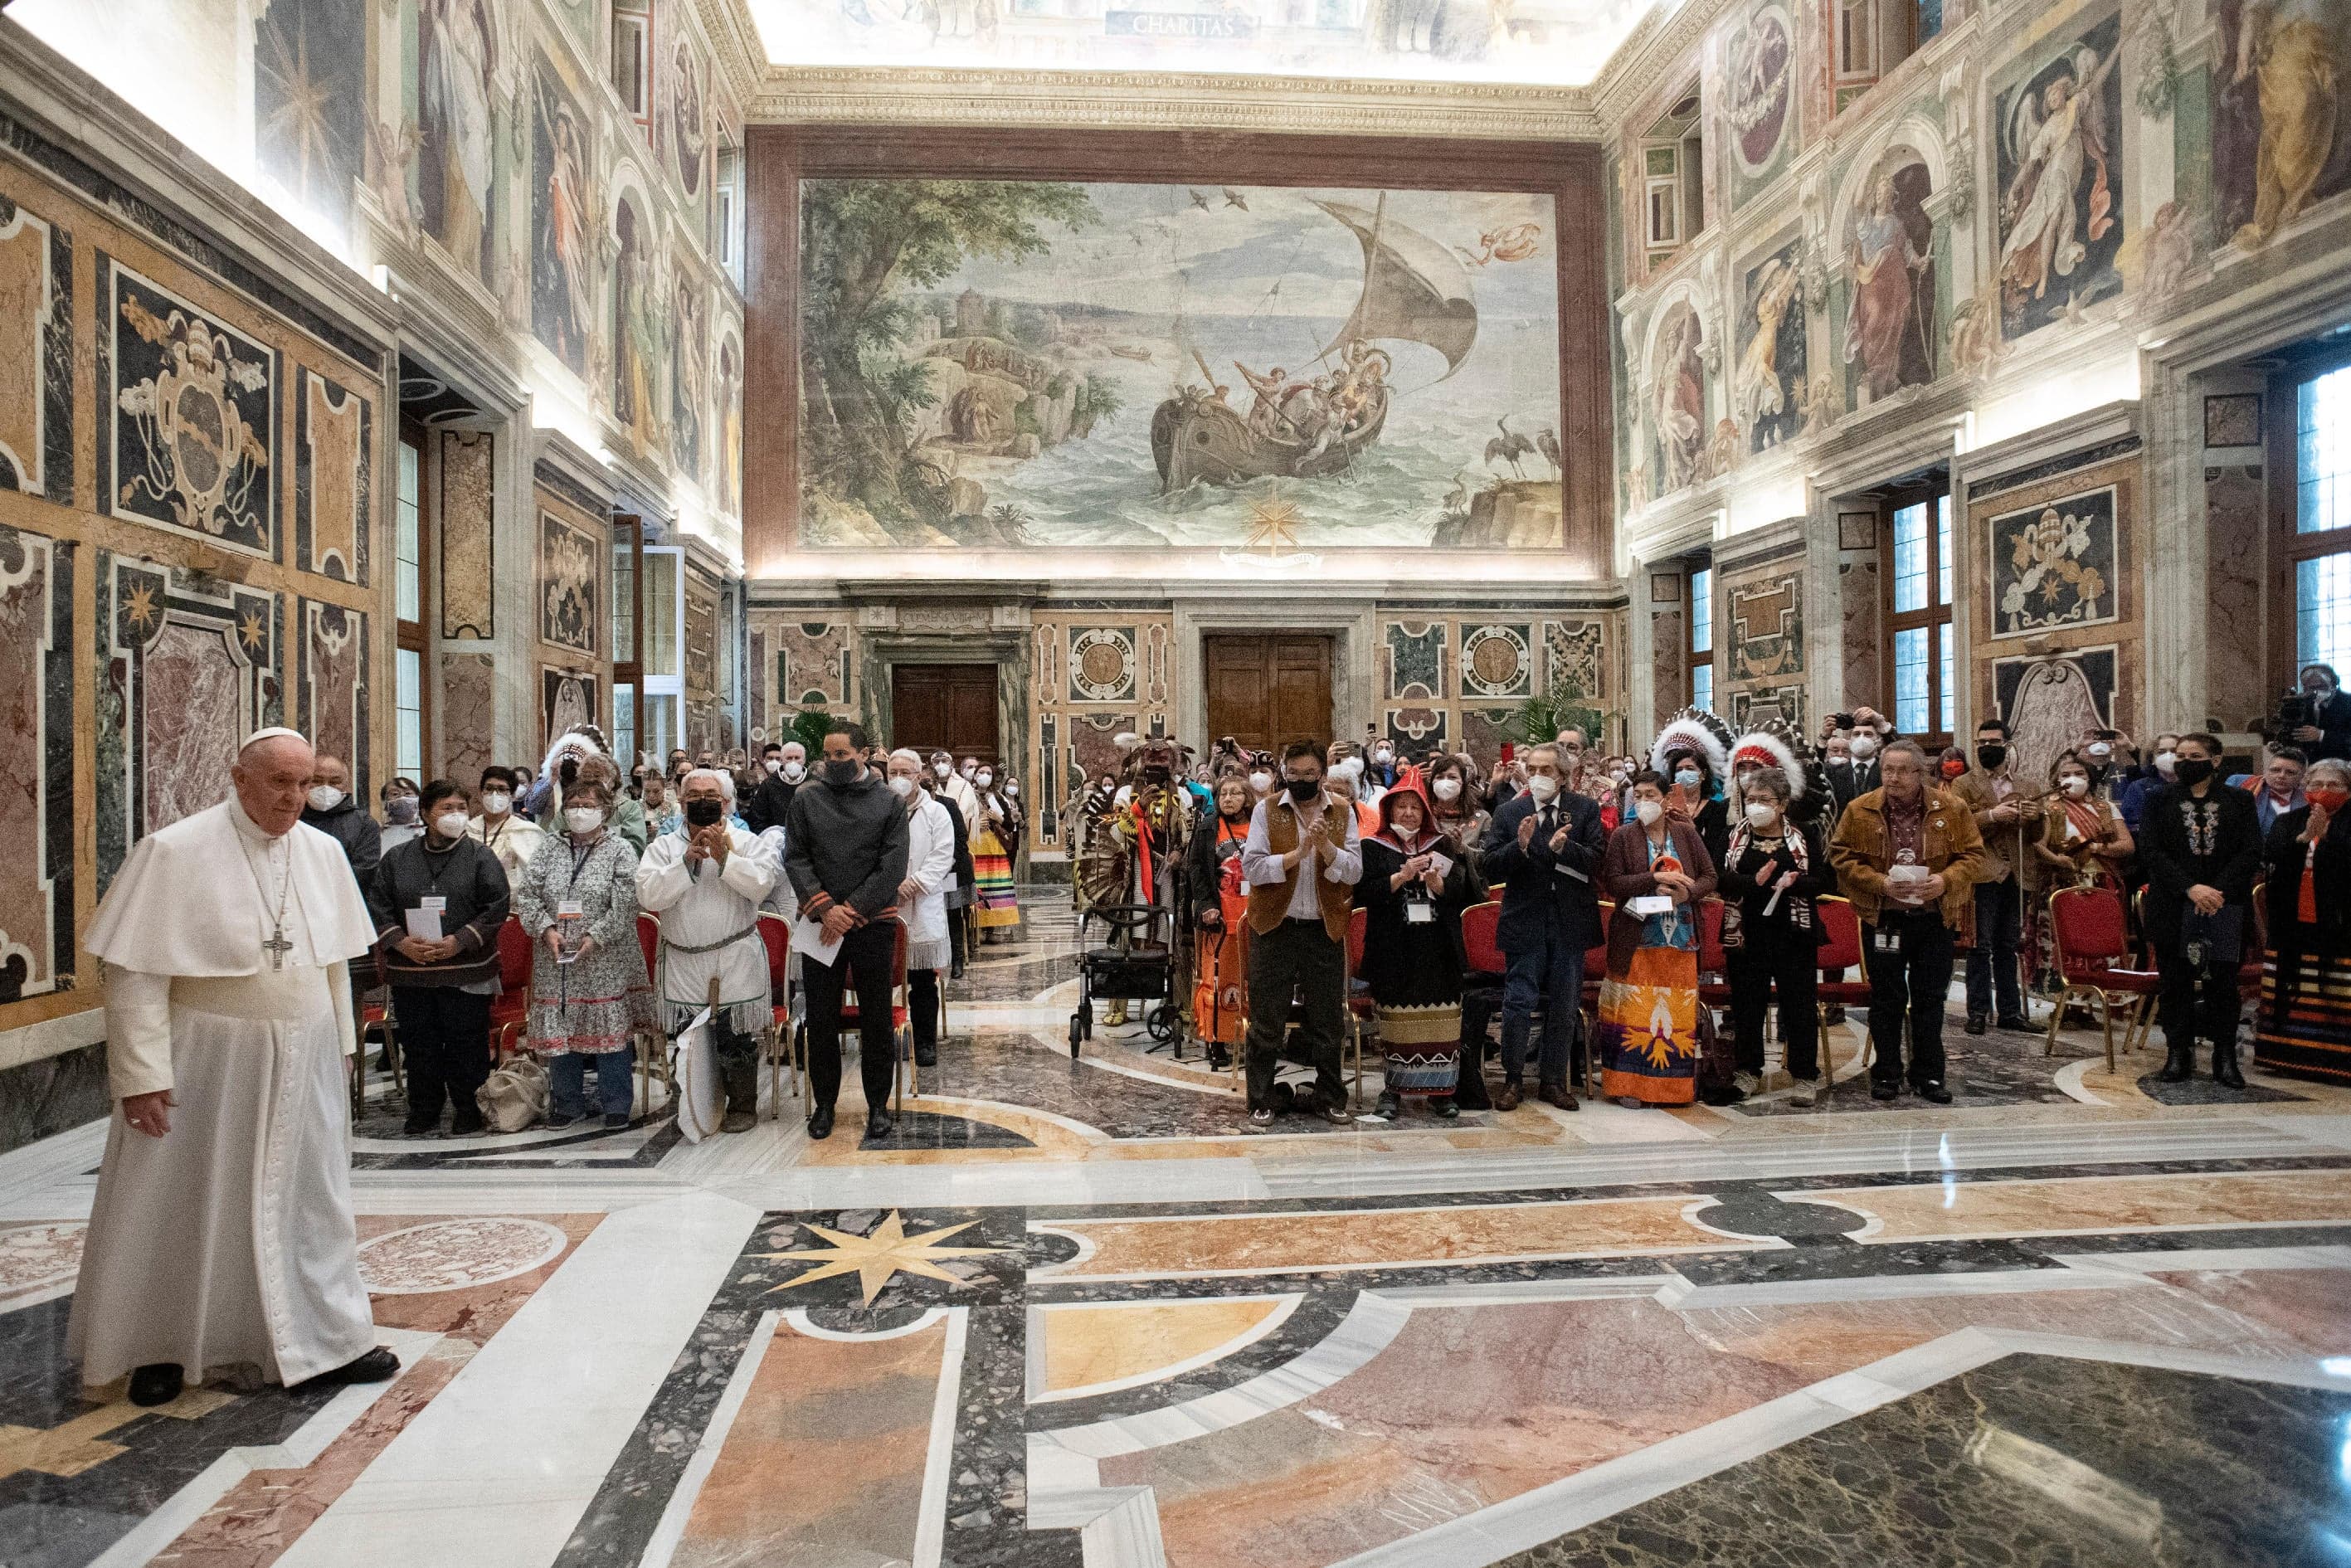
Pope Francis apologizes for residential school abuses
Atlantic provinces
In the following graphs, the coloured numbers and bars represent the seat projection averages and confidence intervals, respectively.
As you can see below, the Atlantic projection was almost spot on. The model had the Greens competitive in Fredericton, but not as the favourite (it was projected as a CPC toss up).
Quebec
The Quebec projection was also very close, although it was expected that Maxime Bernier would win his seat of Beauce. He lost by 8 points against Conservative candidate Richard Lehoux.
Ontario
In Ontario, the model’s average overestimated the NDP and underestimated the Liberals. All considered though, every party projection was still pretty close to the averages.
Prairies
In the Canadian Prairies, although some individual ridings were missed, the overall projection was spot on (trust the average!):
Alberta
Although Alberta was not too difficult to analyze, the final projection was also right on the mark:
British Columbia
Finally, the most enigmatic province turned out not so bad for the model. All seat projections were within a few seats from the actual results.
Up north, the Liberals were correctly identified as the winner in Yukon and the Northwest territories. Nunavut elected its NDP candidate and was missed by the model (although it was projected as a toss up). Moreover, the Green Party of Canada was significantly overestimated in the North.
Overall, the Liberals fed off a weaker than expected performance from the NDP. The Conservative, Bloc and Green projections were all fairly close to the final results:
More analysis of the results will be come soon. Despite the lack of sleep and overall exhaustion of the past two months, I simply cannot be unhappy this morning. The 338Canada model fared well. Hard work (and yes, a little luck) has paid off.
MORE ABOUT FEDERAL ELECTION 2019:
Philippe J. Fournier is the creator of 338Canada.com, Qc125.com, a regular contributor to L’actualité magazine and a professor of physics and astrophysics at Cégep de Saint-Laurent in Montréal.
Related Posts

New federal budget will include up to $8 billion in defence spending
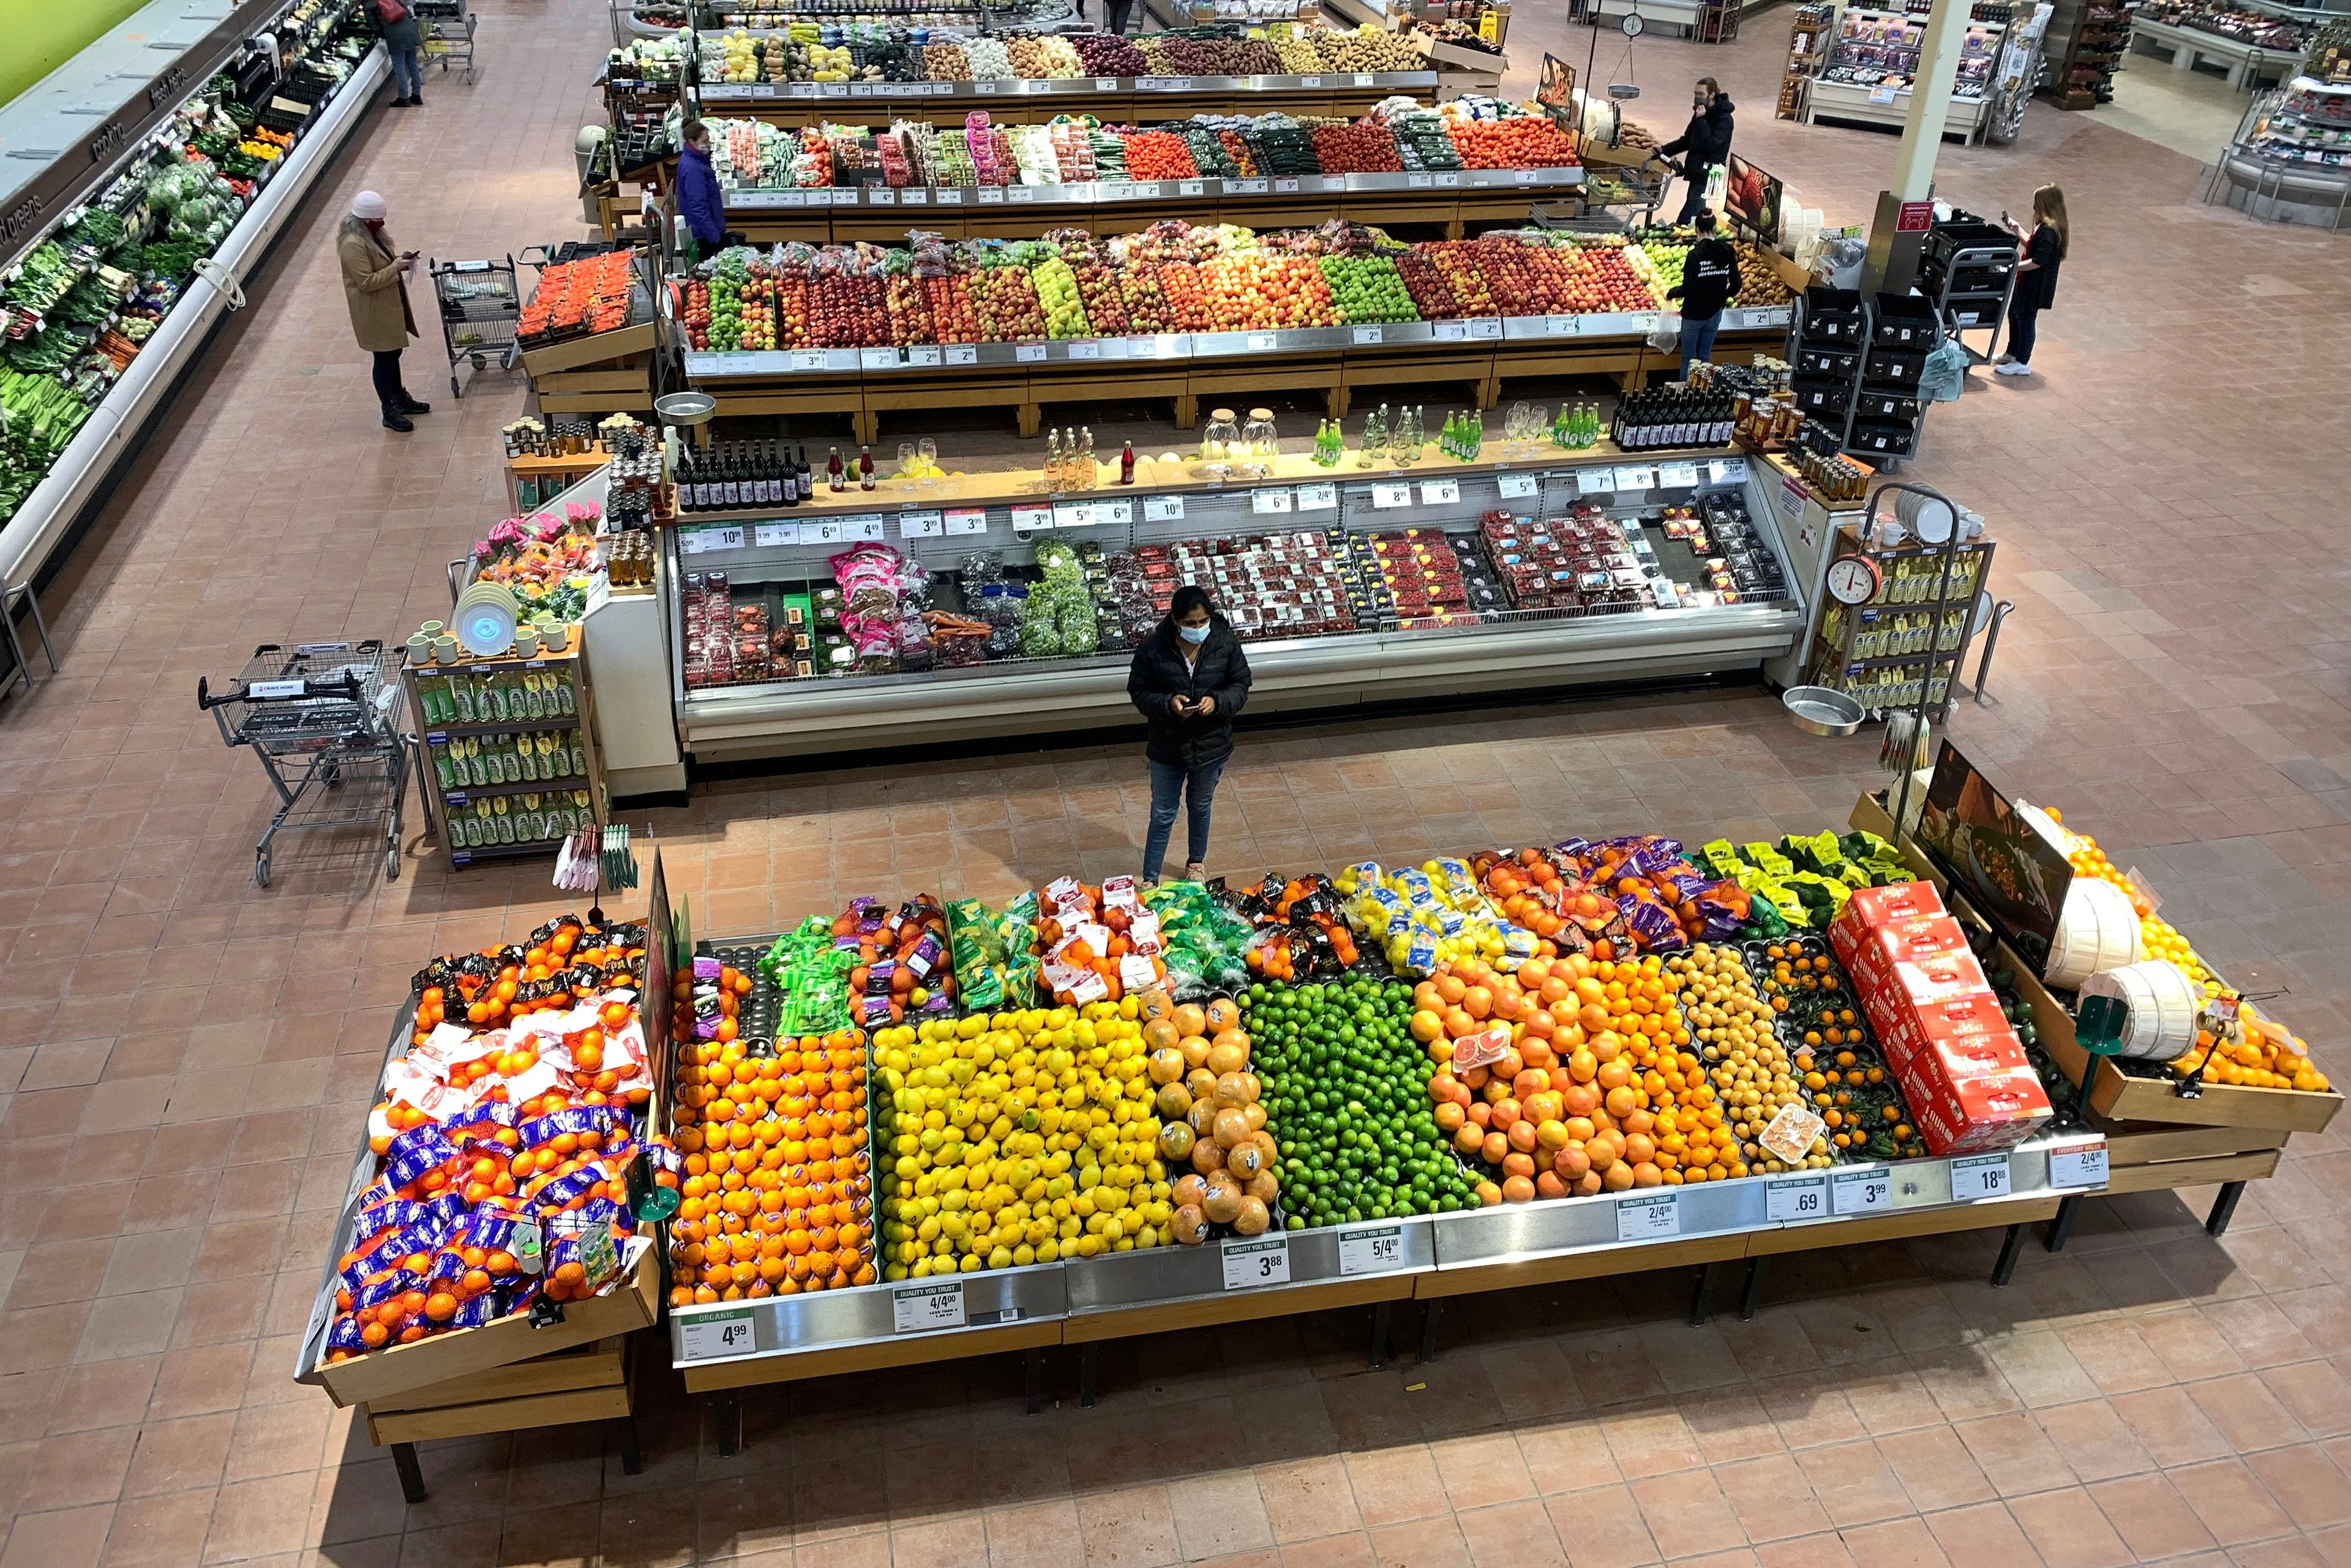
Inflation rate surpasses a three decade high
Jonathan Vance pleads guilty, gets conditional discharge

The federal budget is a mixed bag
Get the Best of Maclean’s straight to your inbox.
Sign up for news, commentary and analysis. Join 60,000+ Canadian readers.